TRON, ApeCoin, and Decentraland Price Analysis: 10 May

There was a heavy sell-off in the crypto market in the past few days as Bitcoin shed value alongside global stock indices. TRON had been one of the few coins that had trended upward in the past week, but it fell beneath crucial support. ApeCoin and Decentraland could offer selling or shorting opportunities in the hours to come.
TRON (TRX)
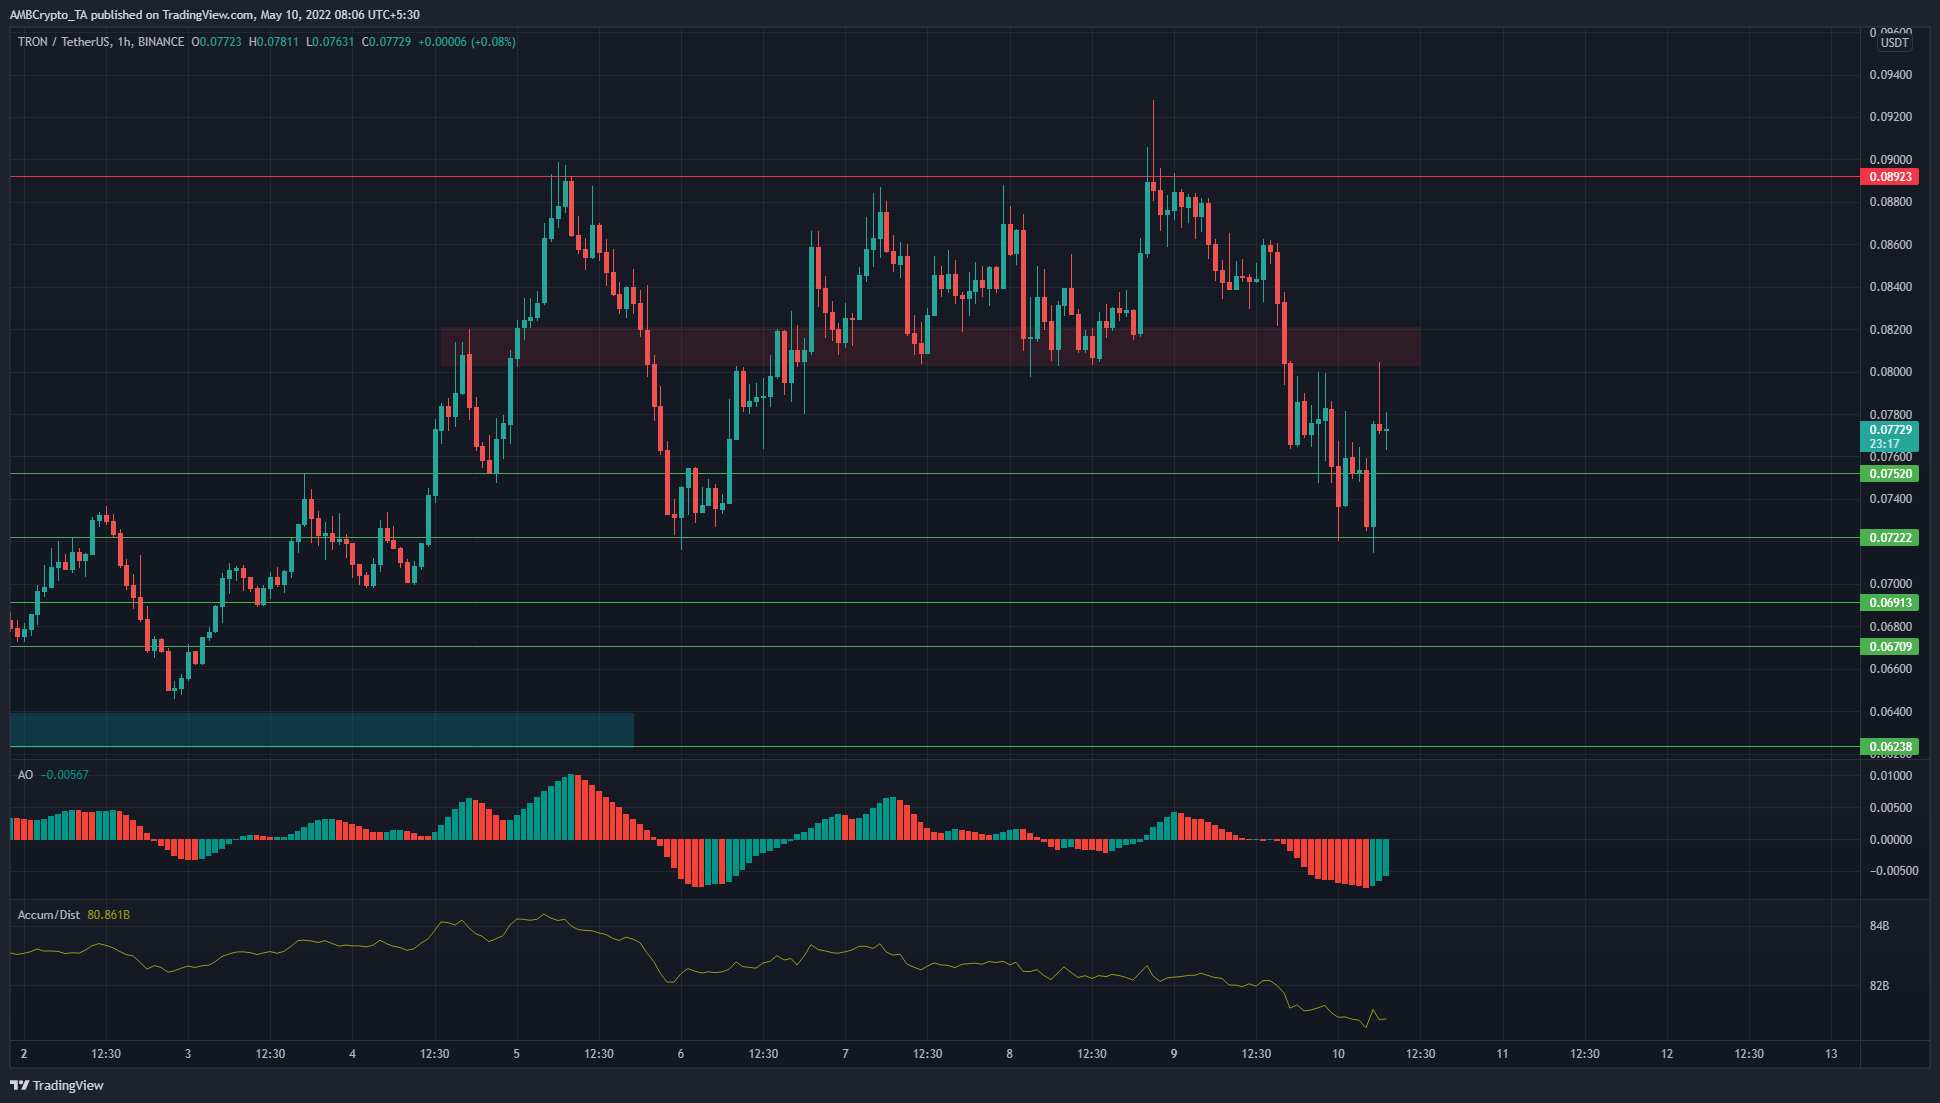
On the hourly chart, TRX was in an uptrend in the past few days but was simply unable to climb past the $0.089 resistance level. At the same time, the past three days also saw the A/D indicator begin to fall even as the bulls tried to drive the prices higher.
This was a sign that sellers had strength in the market, and the past couple of days saw TRX retrace back to the $0.0722 support level. The Awesome Oscillator was also well below the zero line to show strong bearish momentum. The $0.08-$0.082 area (red box) is likely to serve as resistance.
ApeCoin (APE)
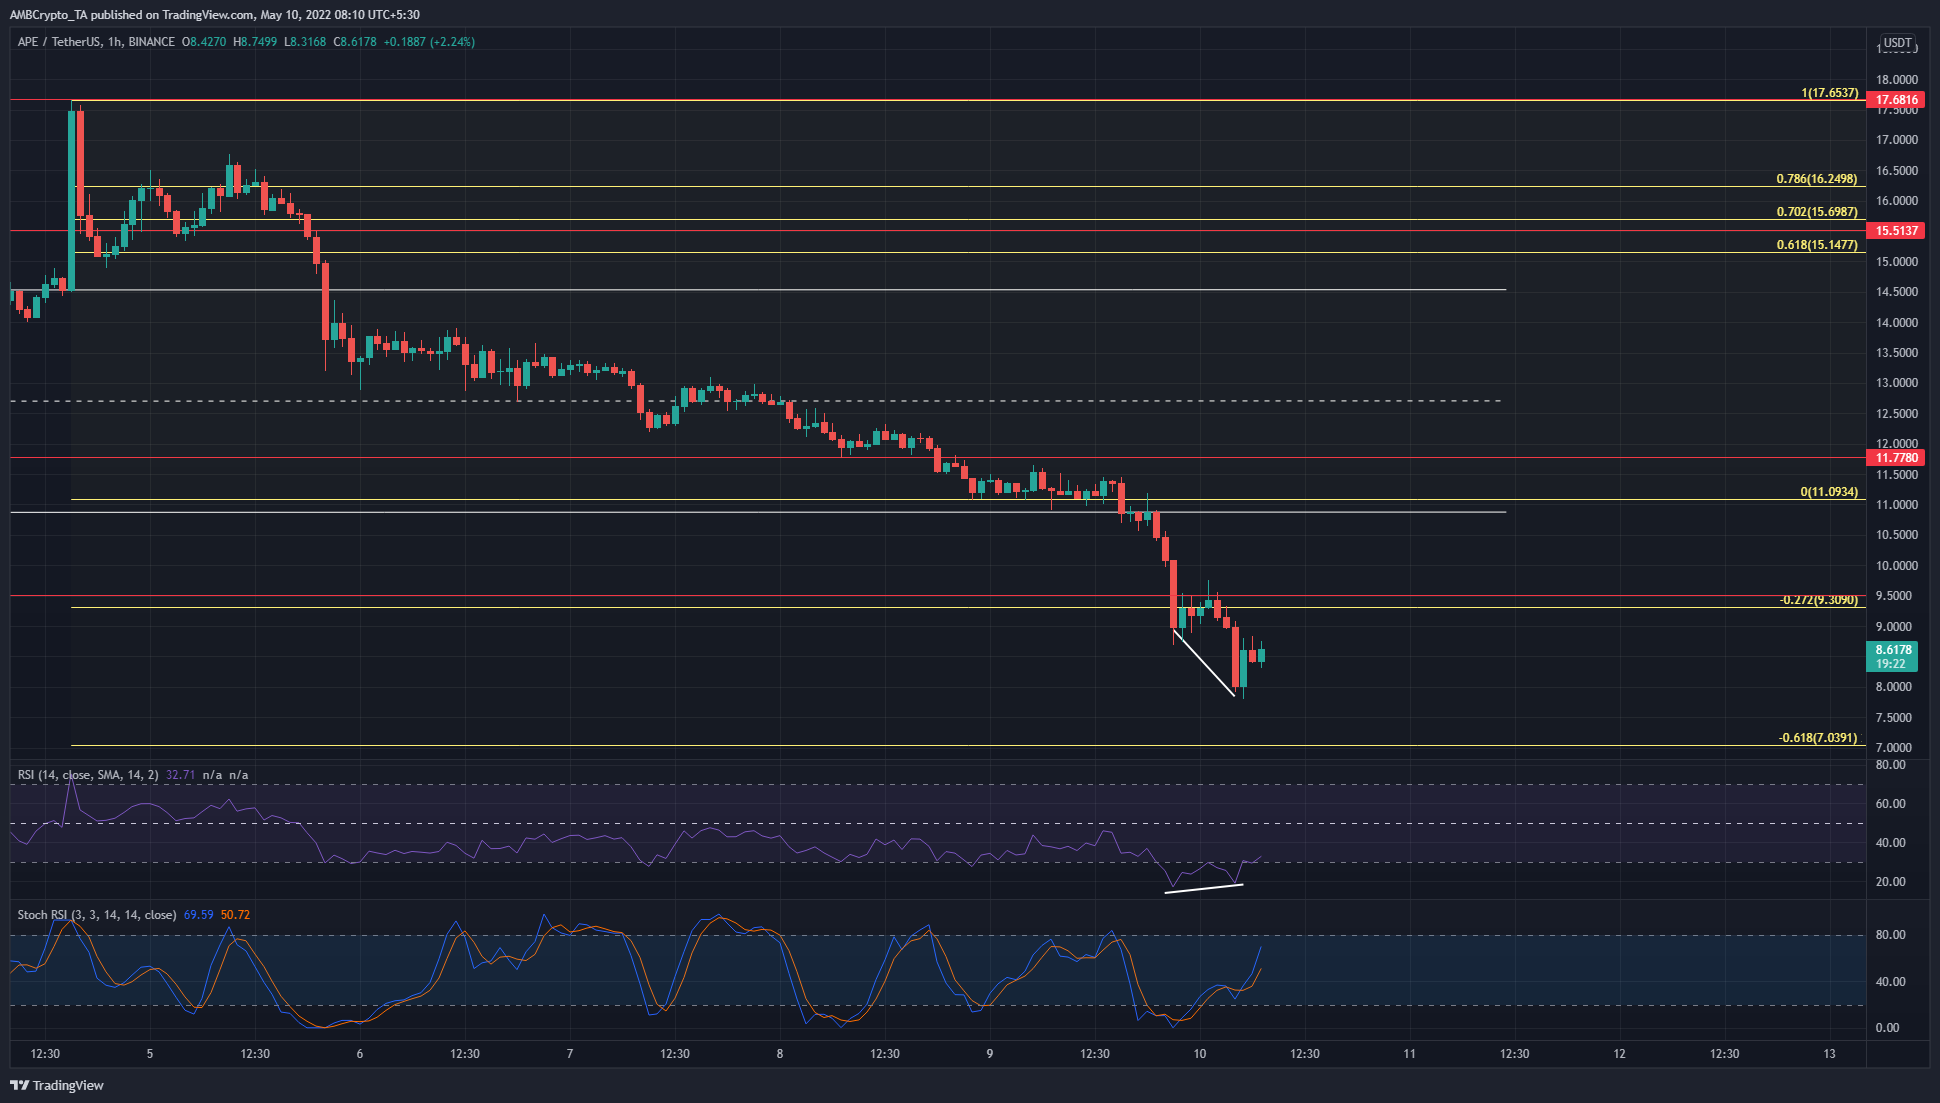
ApeCoin has fallen nearly 40% after dropping below the $14.5 mark, a level that was formerly a range high. APE broke out of this range in mid-April, but in the past few days, it fell below this range.
The coin formed a bullish divergence (white) with the RSI on the charts and bounced from the $8 mark. However, this would likely be followed by a hidden bearish divergence to signal the continuation of the bearish trend. Such a divergence, alongside the Stochastic RSI forming a bearish crossover, could be used to enter a short position with careful risk management.
To the downside, $7 is a technical target based on Fibonacci extension levels.
Decentraland (MANA)
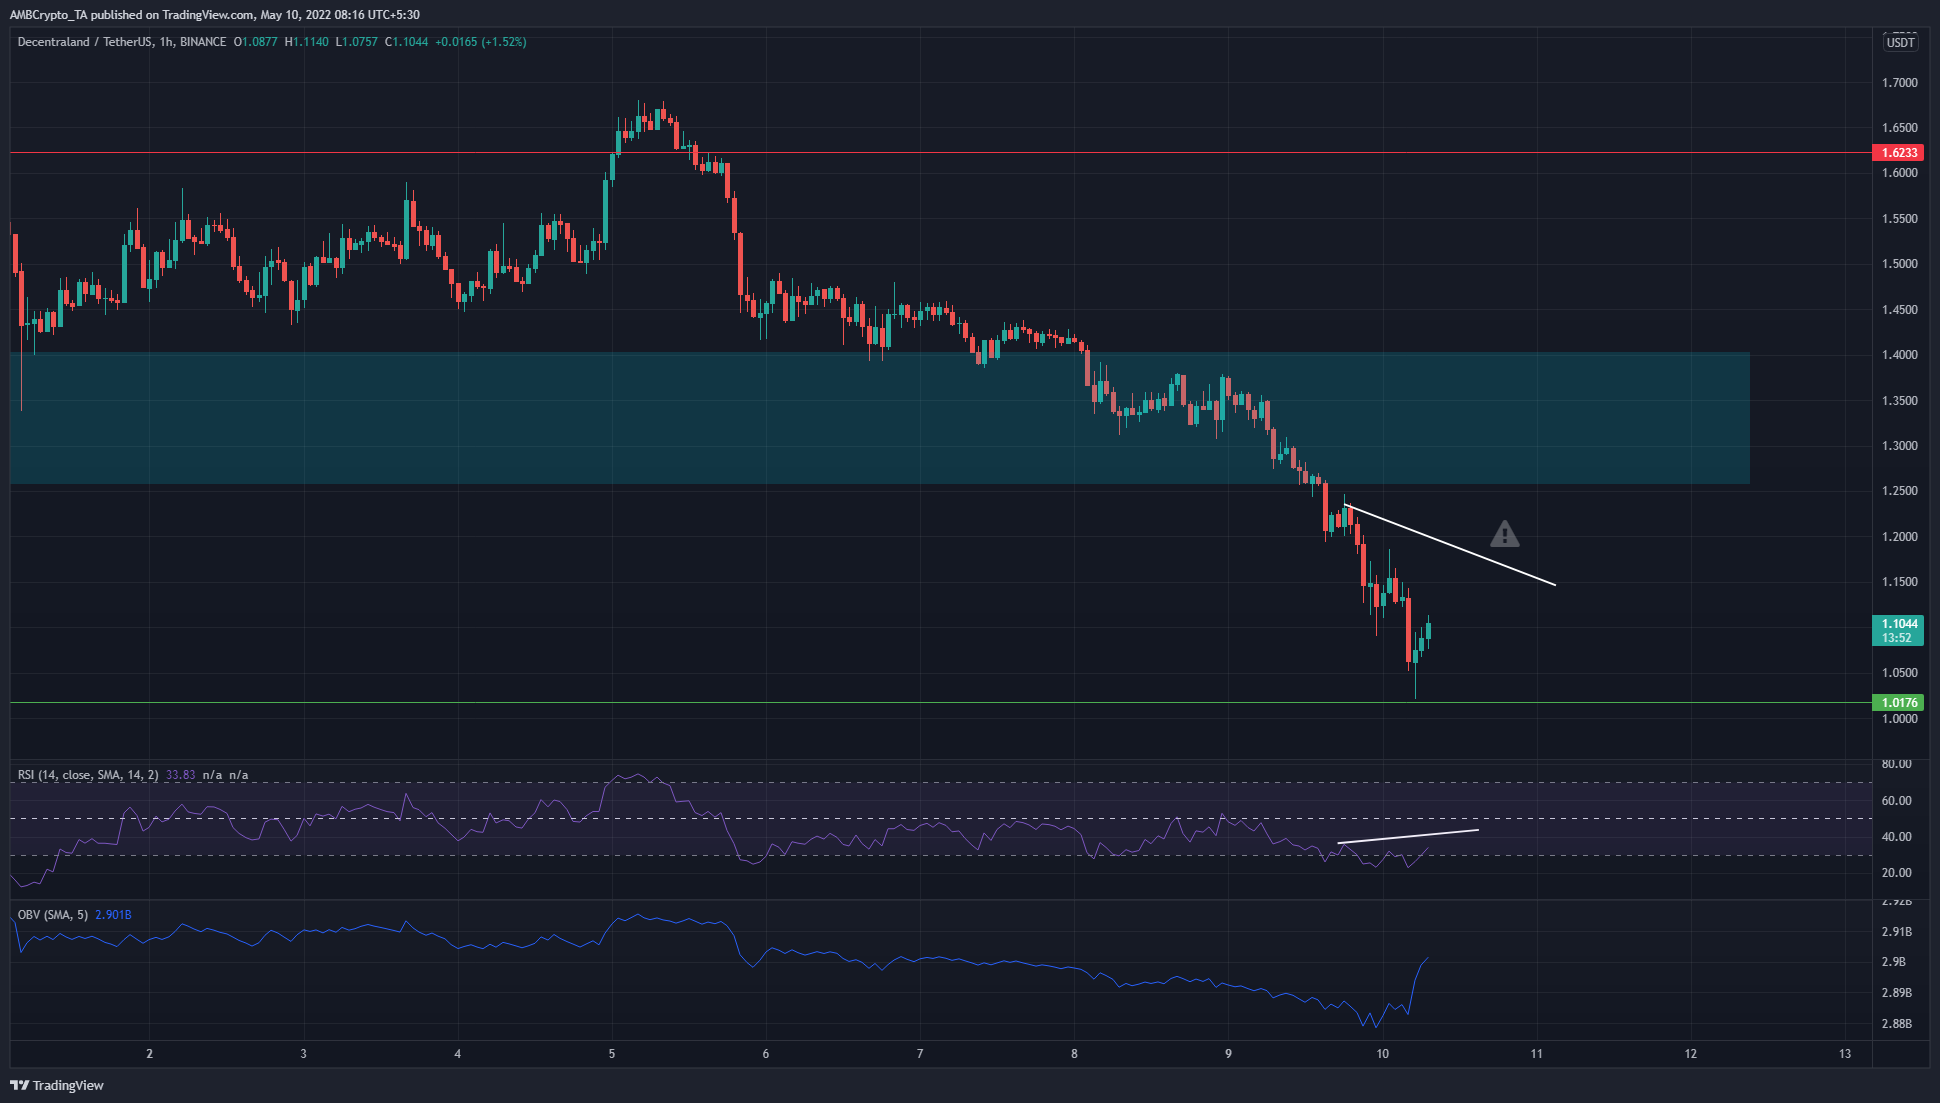
The $1.25-$1.4 is an area of long-term demand for MANA, and in the past few days, this area was broken quite decisively. The OBV has been in a downtrend to signal the strength of the sellers in the past week.
At press time, both the OBV and the RSI were climbing. This was likely not a reversal of the trend, but rather a relief rally toward $1.1-$1.15. A hidden bearish divergence, that is, a higher high on the RSI but a lower high on the price chart, is something to look out for on the hourly chart. Such a development could lead to MANA’s bounce being reversed.


