Tron, Ontology, SUSHI Price Analysis: 11 February

Tron surged to $0.05 and retraced some of its gains on the charts while Ontology breached the $1-mark, a level it hadn’t visited since February last year. Finally, SUSHI’s charts registered short-term bearish pressure as it was unable to convincingly assail the $15.8-level of resistance.
Tron [TRX]
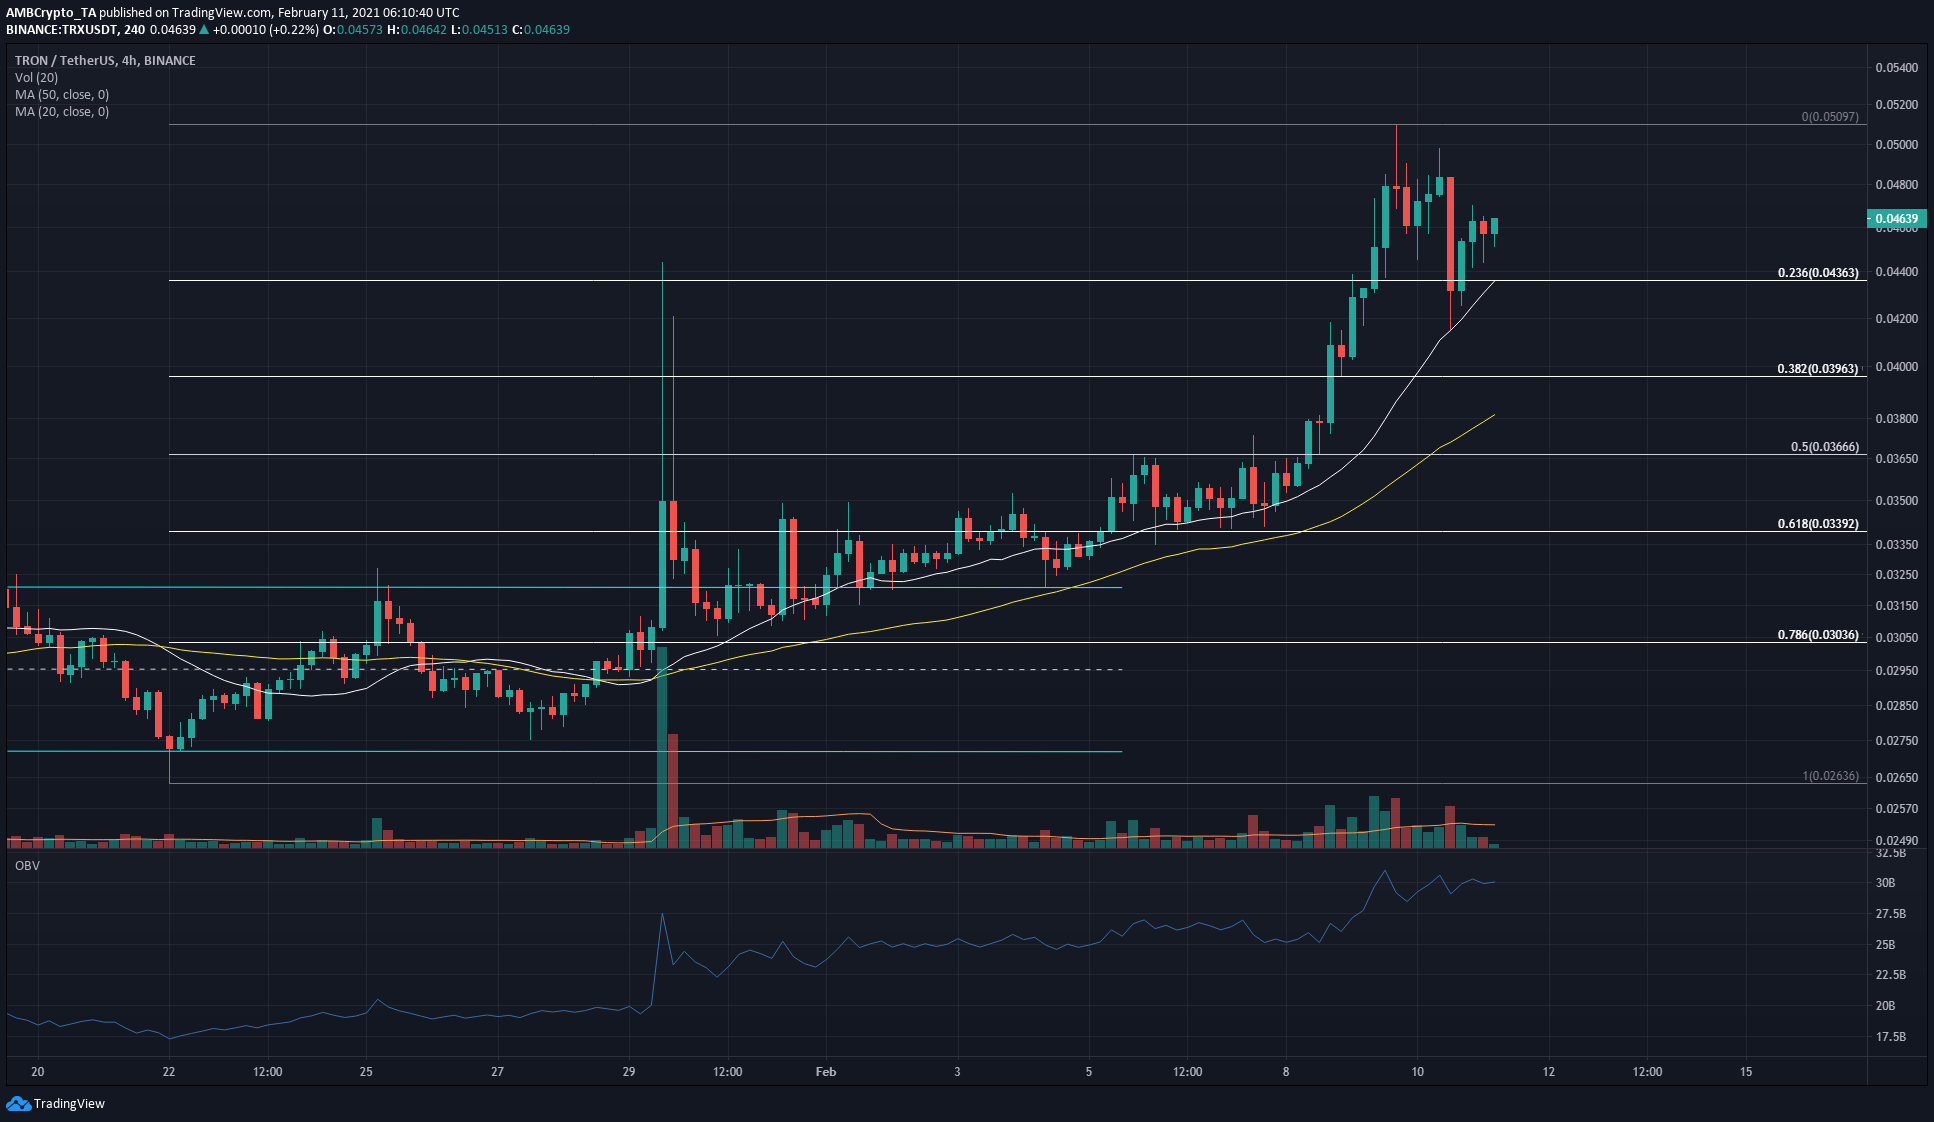
The breakout past the range (cyan) and its subsequent retest confirmed the bullish breakout, and TRX surged from $0.0315 to touch $0.05 within a week.
The OBV has been on an uptrend and its charts showed strong demand from buyers.
The 20 SMA (white) was moving above the 50 SMA (yellow) to show that the bullish momentum was not yet stalled. The 23.6% retracement level did see some demand from buyers. Losing this level would likely see TRX head lower towards $0.039, the 38.2% retracement.
Ontology [ONT]
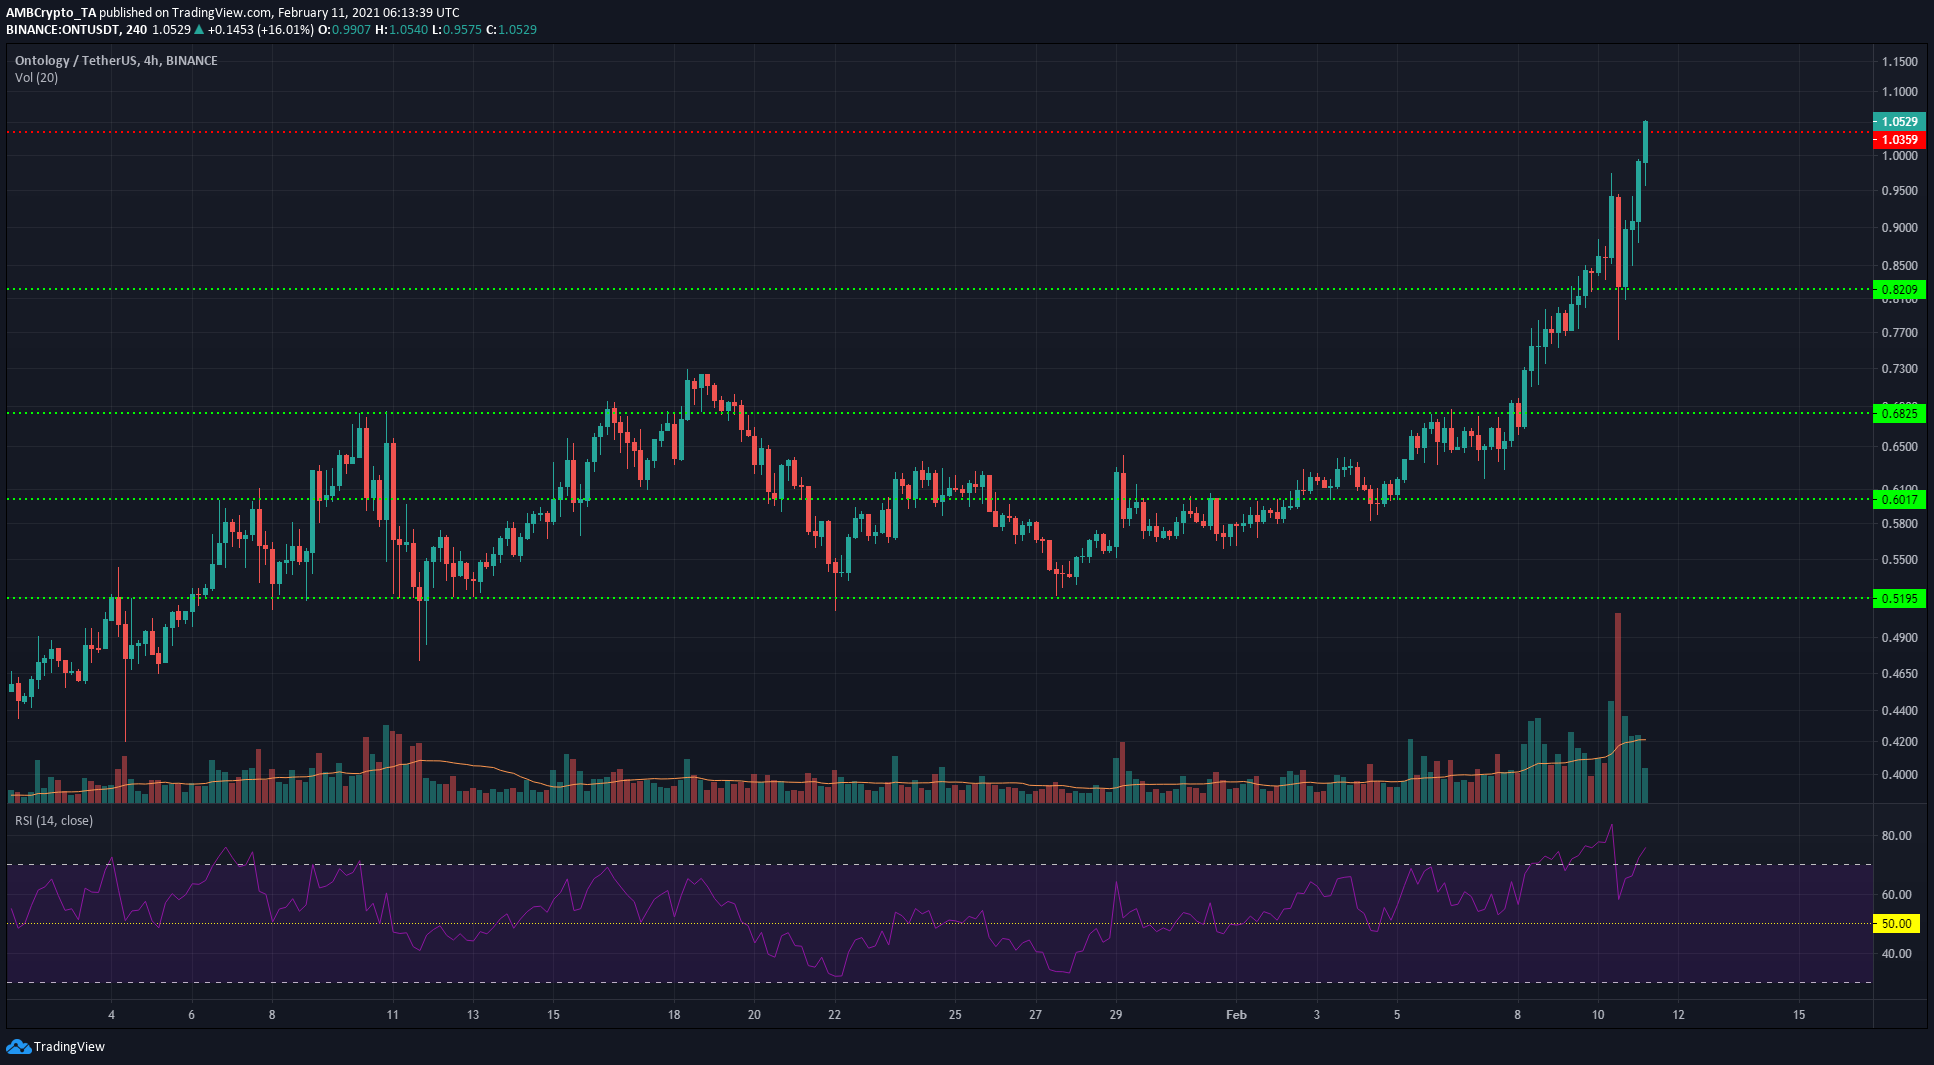
ONT surged to test the $1-level of resistance. The $0.95-region saw some selling pressure develop over the past few trading sessions, and saw ONT pull back to test $0.82 as a level of support. Since then, ONT has seen extraordinary trading volume, with the crypto surging by an additional 27% to test the $1.03-level.
The RSI was in the overbought zone, but a retracement wasn’t seen. Over the next few hours, it would become more clear if ONT manages to flip this level to support. Almost exactly a year ago was the last time ONT was trading at this level, and it is an important level for bulls to conquer.
A Doji, hammer, or hanging man pattern can be used to judge a reversal as imminent. Until then, the bullish momentum can be expected to push ONT upwards.
SushiSwap [SUSHI]
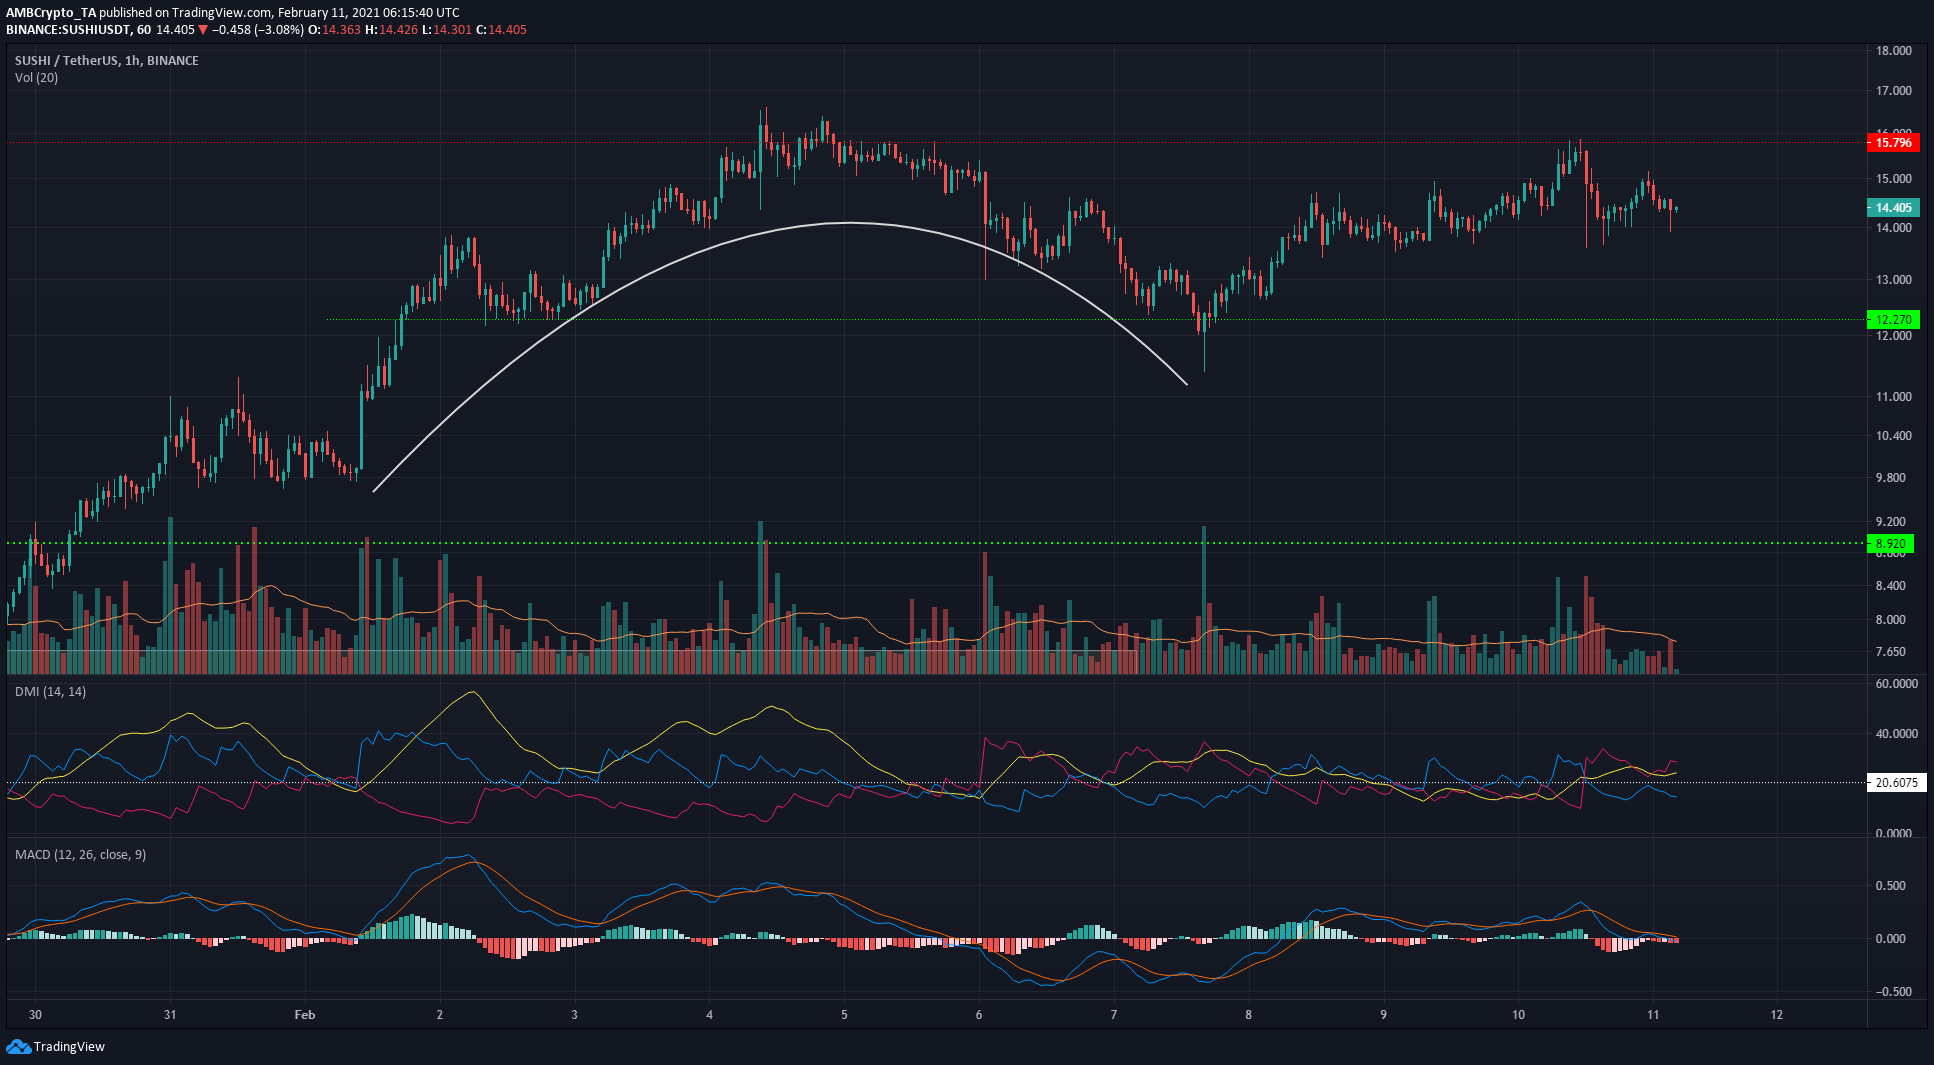
SUSHI formed what appeared to be an ascending, inverted scallop pattern on the charts, and although it bounced strongly off the $12-level, it was unable to breach the previous highs at $16. The $15.8-$16 region has offered substantial selling pressure to SUSHI.
On the 1-hour timeframe, the Directional Movement Index showed that a downtrend was in progress, with the ADX (yellow) rising above 20, and the -DMI (pink) rising to show the bearish nature of the trend.
The MACD was close to zero and a dive beneath it appeared imminent, giving more evidence to the downward momentum for SUSHI.


