
Bitcoin – Why BTC’s $156K–$168K year-end target looks likely

Tron and Compound reported strong gains made in recent days, with TRON gaining by nearly 40% in the span of 48 hours. Synthetix was trading below a region of supply, but demand was slowly surfacing and could drive its prices higher.
Tron [TRX]
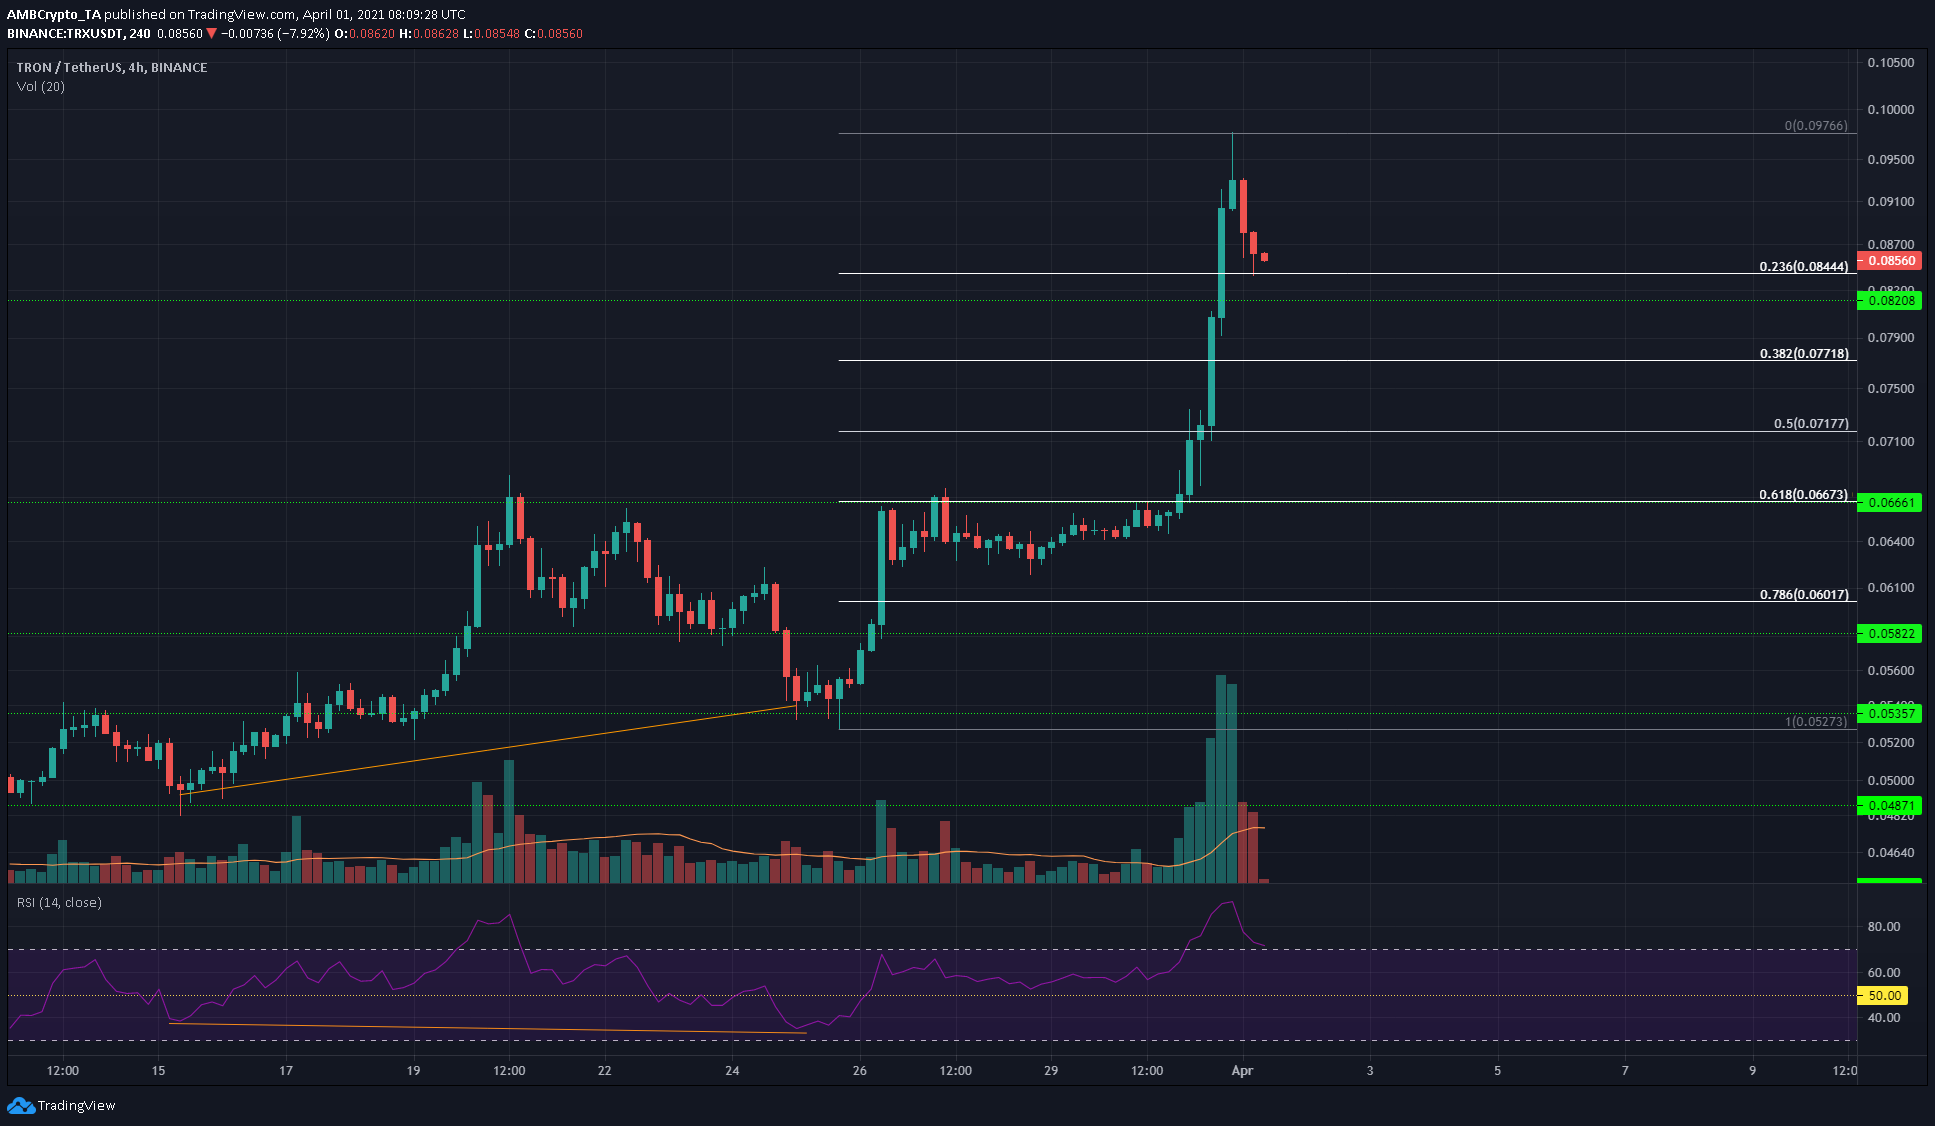
Source: TRX/USDT on TradingView
A week ago, on the 4-hour chart, a bullish divergence between the price and momentum was seen for TRX. This was followed by a move to $0.66, a level that had been a level of resistance earlier in March. The price consolidated under this level for a few days and an influx of strong demand led to TRX soaring towards $0.097.
At the time of writing, TRX was in a pullback, and the Fibonacci levels of retracement at $0.082 and $0.077 can be expected to serve as supports. The RSI was still above 70 even after the pullback to $0.082, showing that a deeper retracement could be seen. A retest of $0.071 would be an ideal entry to a new long position.
Synthetix [SNX]
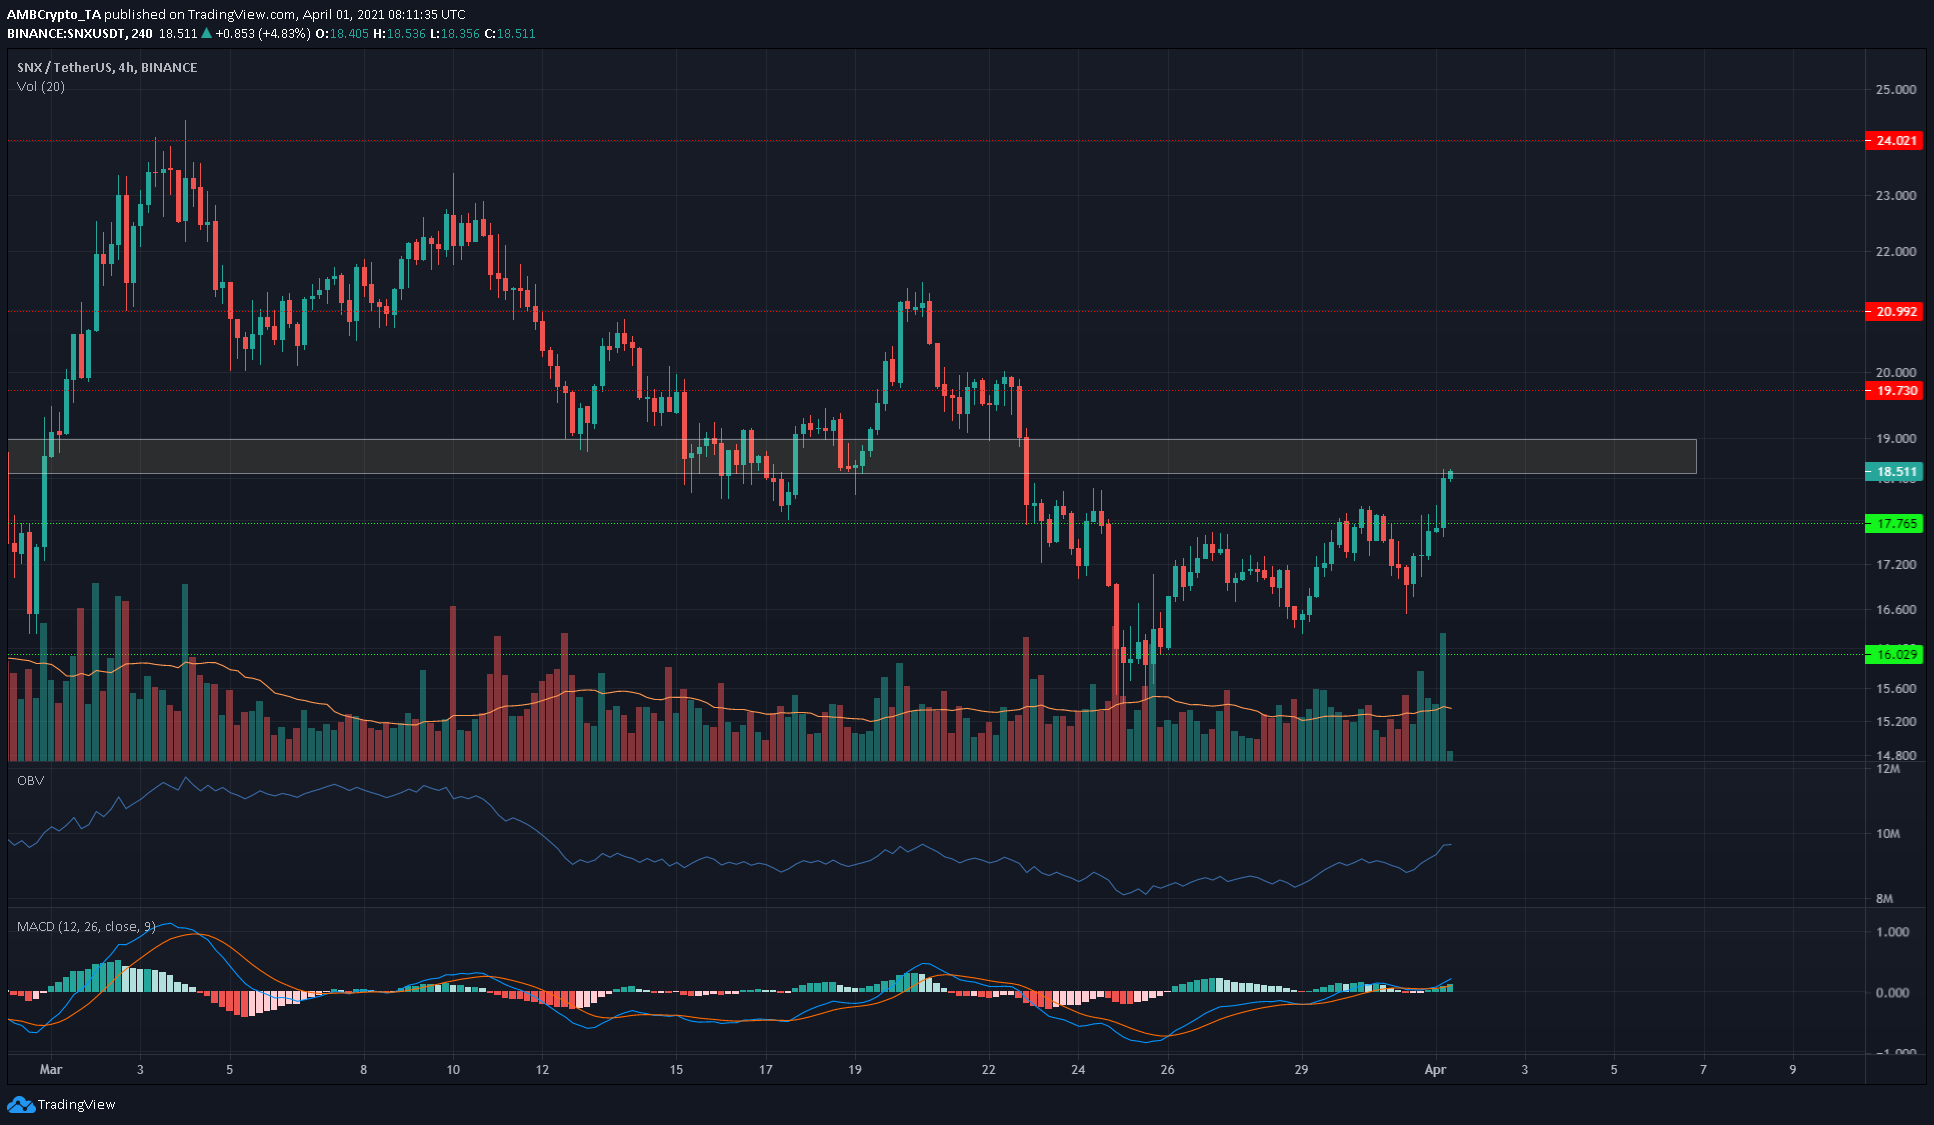
Source: SNX/USDT on TradingView
Synthetix was not strongly bullish on the charts – It approached a region of supply on a bounce off $16 after a month-long downtrend. The OBV showed that the past few days have seen greater buying volume than selling.
The MACD climbed above zero to note bullish momentum. However, SNX would need to flip the $18.5-region of supply to demand before attempting to move towards $20 once more. The retest of this region as demand would be a buying opportunity.
Compound [COMP]
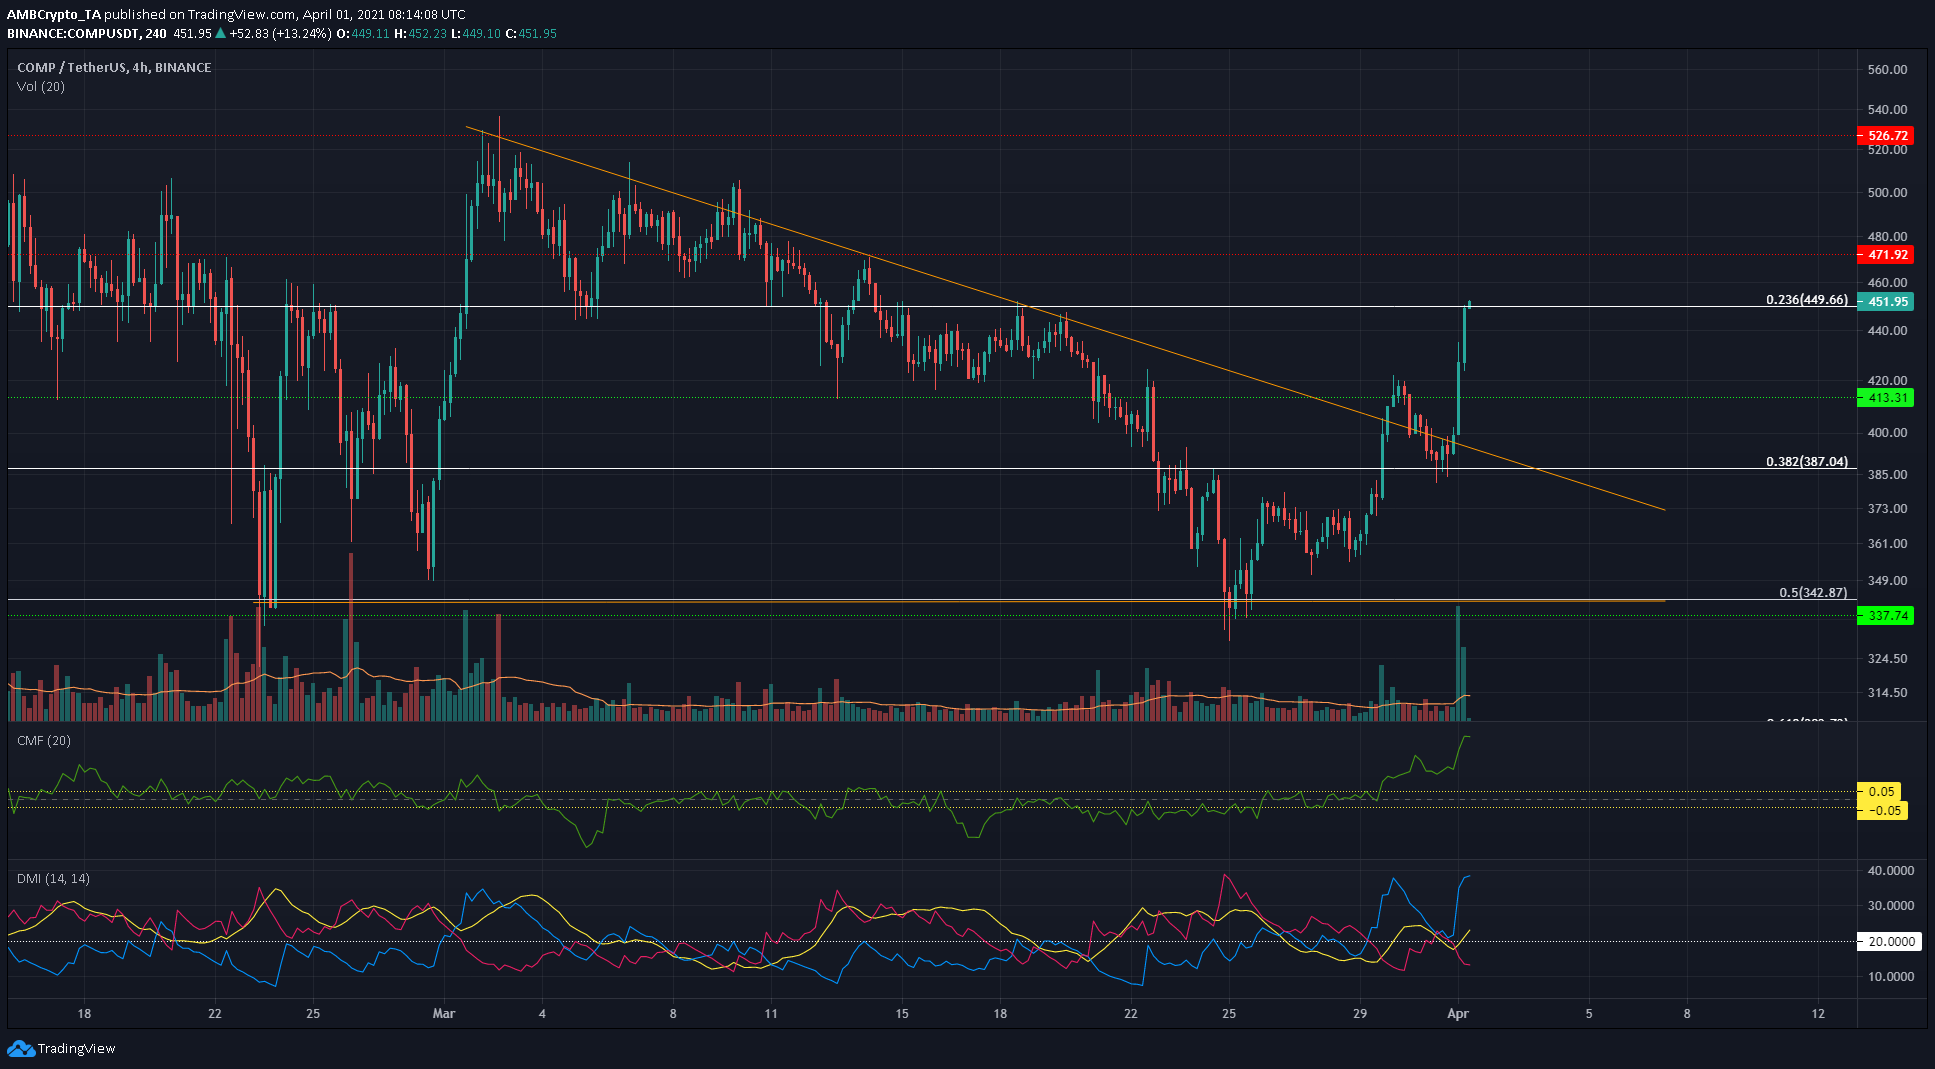
Source: COMP/USDT on TradingView
In orange was a descending triangle pattern that COMP formed over the month of March. The defense of the $340-area, and the latest breakout past the descending trendline showed that COMP could reach the peak of the triangle at $525 in the coming days.
The Chaikin Money Flow has been above +0.05 for a few days now, and the past few hours saw the ADX (yellow) climb above 20 on the Directional Movement Index. This showed a strong uptrend was in progress.
$471 and $526 are the next levels of resistance if COMP flips $451 to support.


