TRON [TRX] investors could look out for buying opportunities at these levels

Disclaimer: The findings of the following analysis are the sole opinions of the writer and should not be considered investment advice.
To be clear, the crypto market is at an especially risky area as Bitcoin floated just above a support level. In the weeks to come, fear could rear its head once more and force investors to flee from crypto. Yet, managing risk is also an important part of investing. There are two levels on the charts that need to be defended as support for TRON, while a close above $0.075 would be a signal of further gains.
TRX- 12 Hour Chart
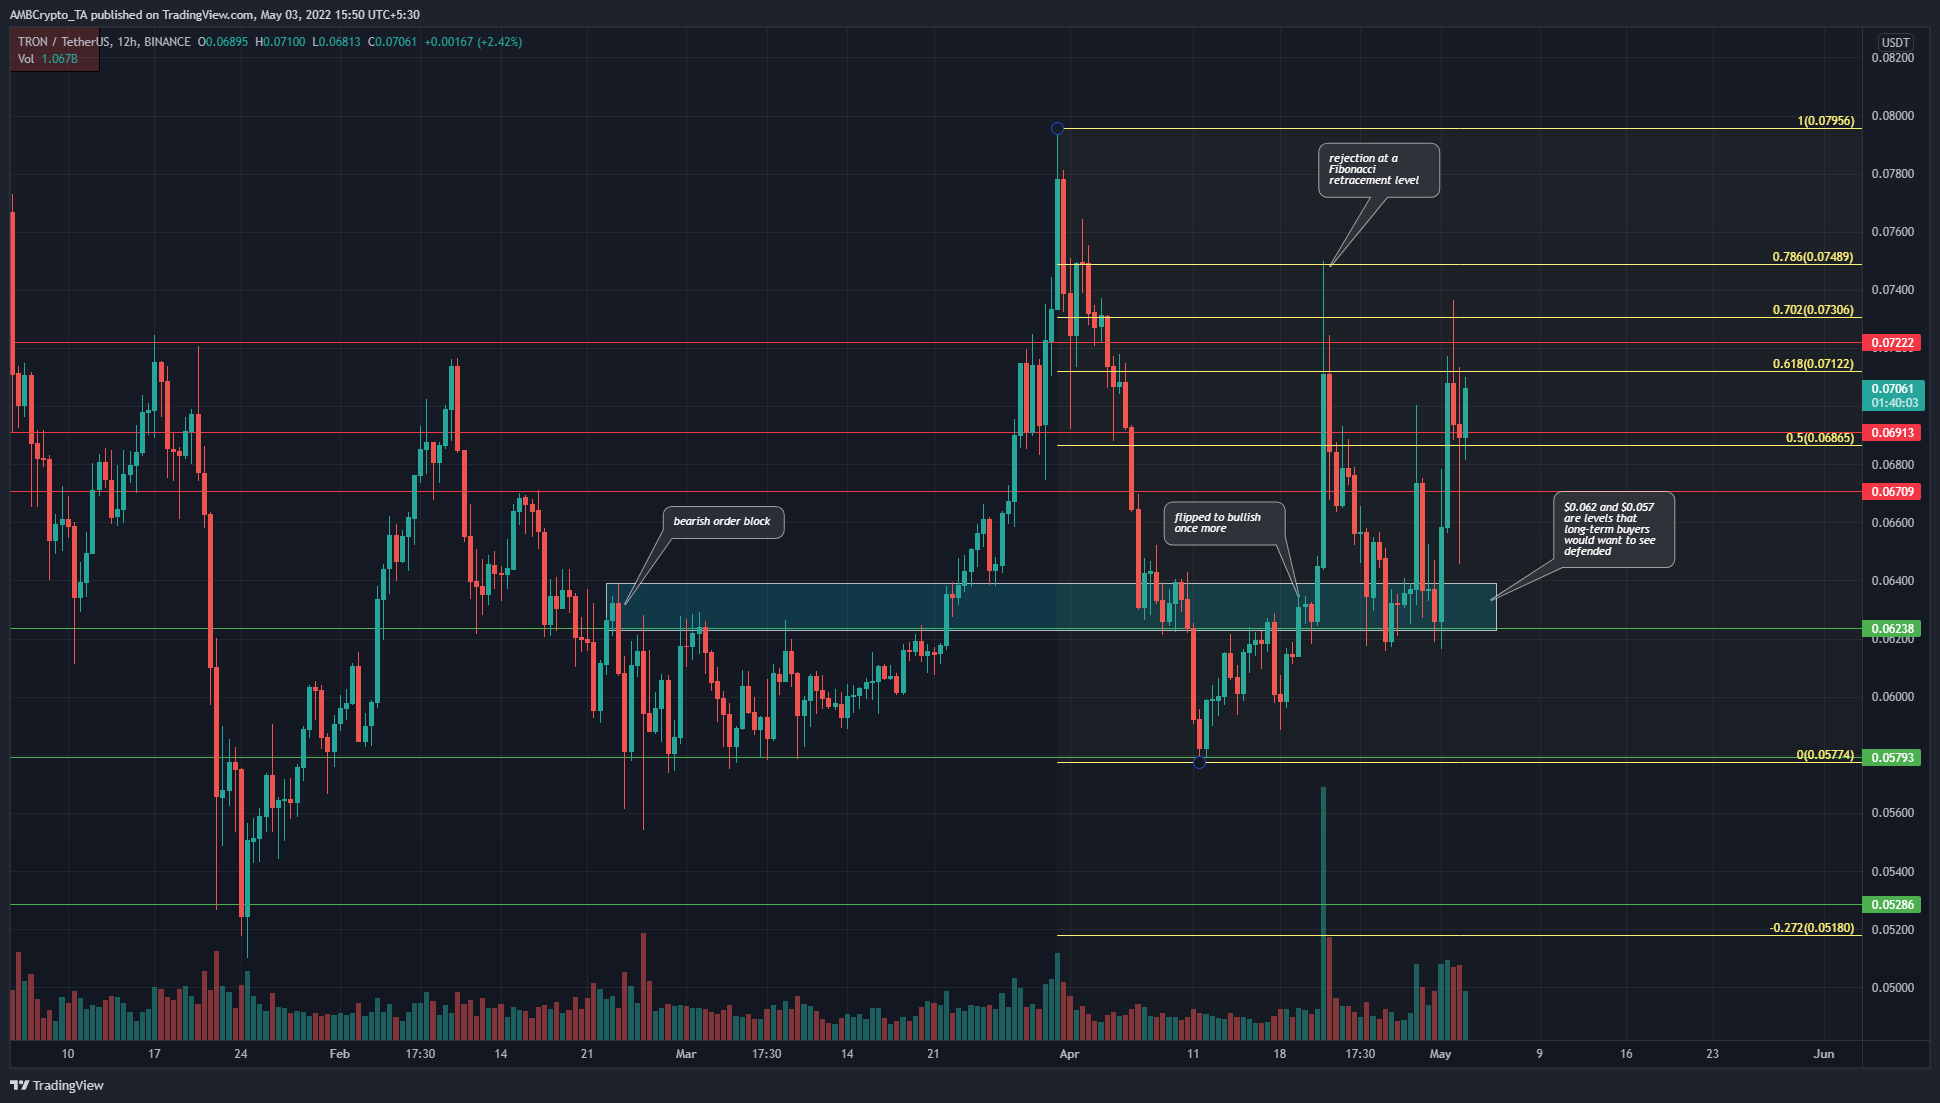
The 12-hour price charts showed that the past two months have seen TRX bulls defend the $0.057 and $0.062 levels with some ferocity. Moreover, the $0.062 area (cyan box) has been a bearish order block since mid-February. This area has exchanged hands from bears to bulls and in mid-April, was back in the hands of the bulls once again.
Therefore, to preserve the bullish structure, the $0.057 and $0.062 levels need to be defended in the days and weeks to come. A set of Fibonacci retracement levels (yellow) was drawn based on TRX’s move down from $0.0795 to $0.0577.
These levels showed that the 61.8%-78.6% retracement levels, and the area between them ($0.0712-$0.0749) can be a place for sellers to take a stand. Yet, if buyers can drive prices past these levels, seller exhaustion could see bulls drive the price past $0.08.
Rationale
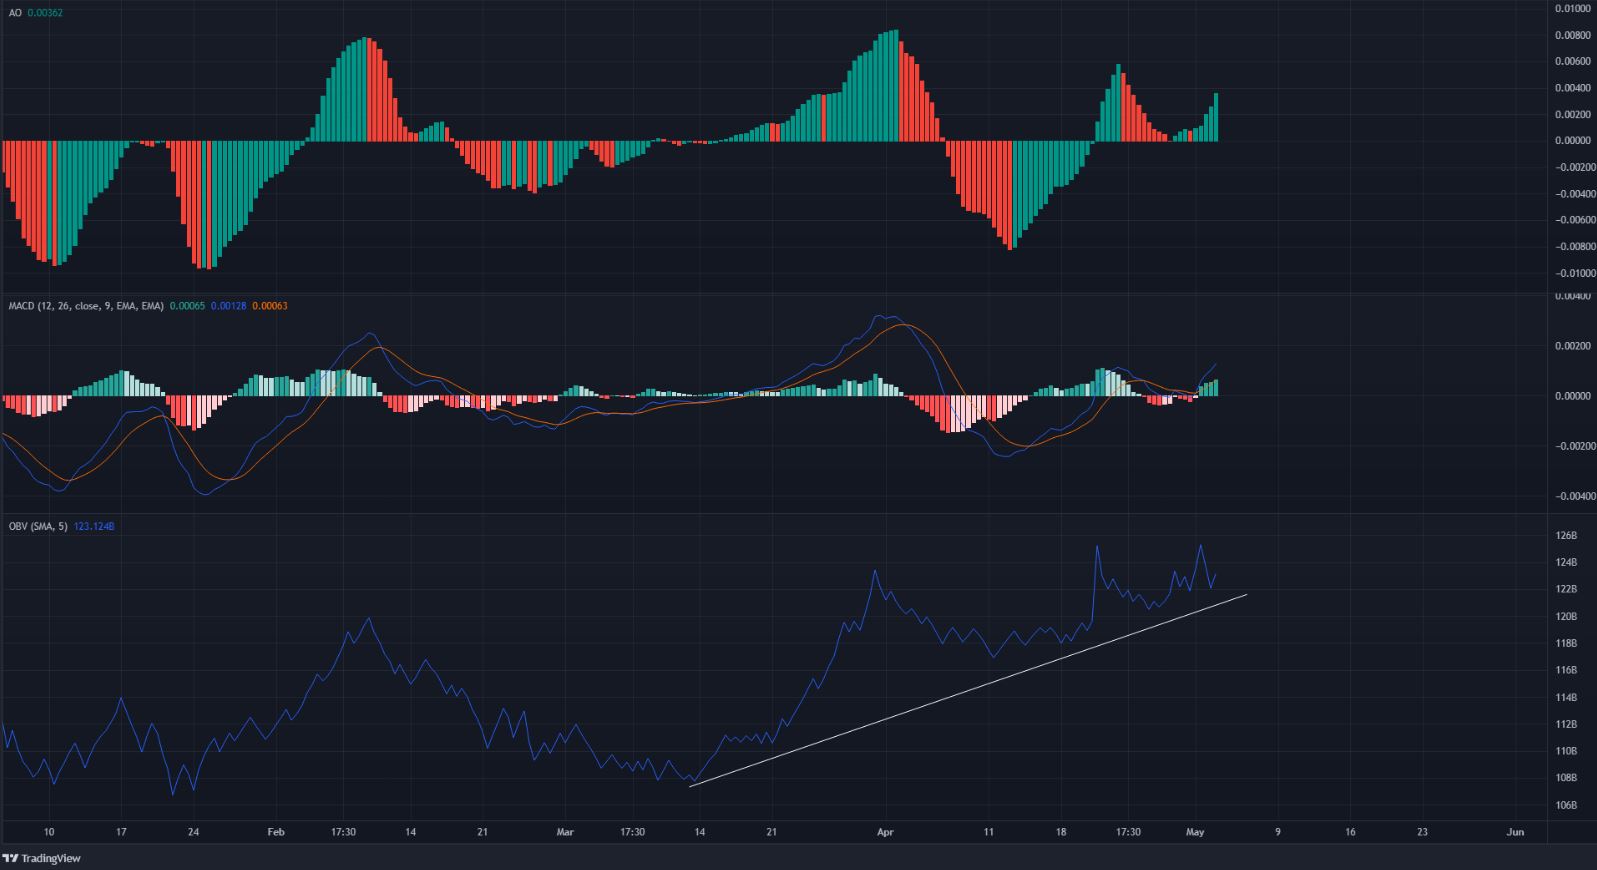
The Awesome Oscillator climbed past the zero line to show rising bullish momentum. The MACD also formed a bullish crossover above the zero line and continued to ascend, which is a buy signal and indicative of strong bullish momentum.
To back this up, the OBV has also posted a series of higher lows in the past two months, which meant that buying volume was much higher than selling volume in the same period.
Conclusion
The uptrend of the OBV and the strong bullish momentum indicators highlighted how TRON was likely to push higher up the charts. On the flip side, a session close below $0.062 and $0.057 could be a signal to exit the market and look for selling opportunities.