Tron, Waves, Maker Price Analysis: 03 March

At press time, Tron needed to flip an important level at $0.048 to target a bullish reversal on the 4-hour timeframe. WAVES eyed a northbound move towards the $11-mark, but not before overcoming some bearish presence in the market. Finally, Maker was on its way to recovery after bouncing back from the $1,945-support level.
Tron [TRX]
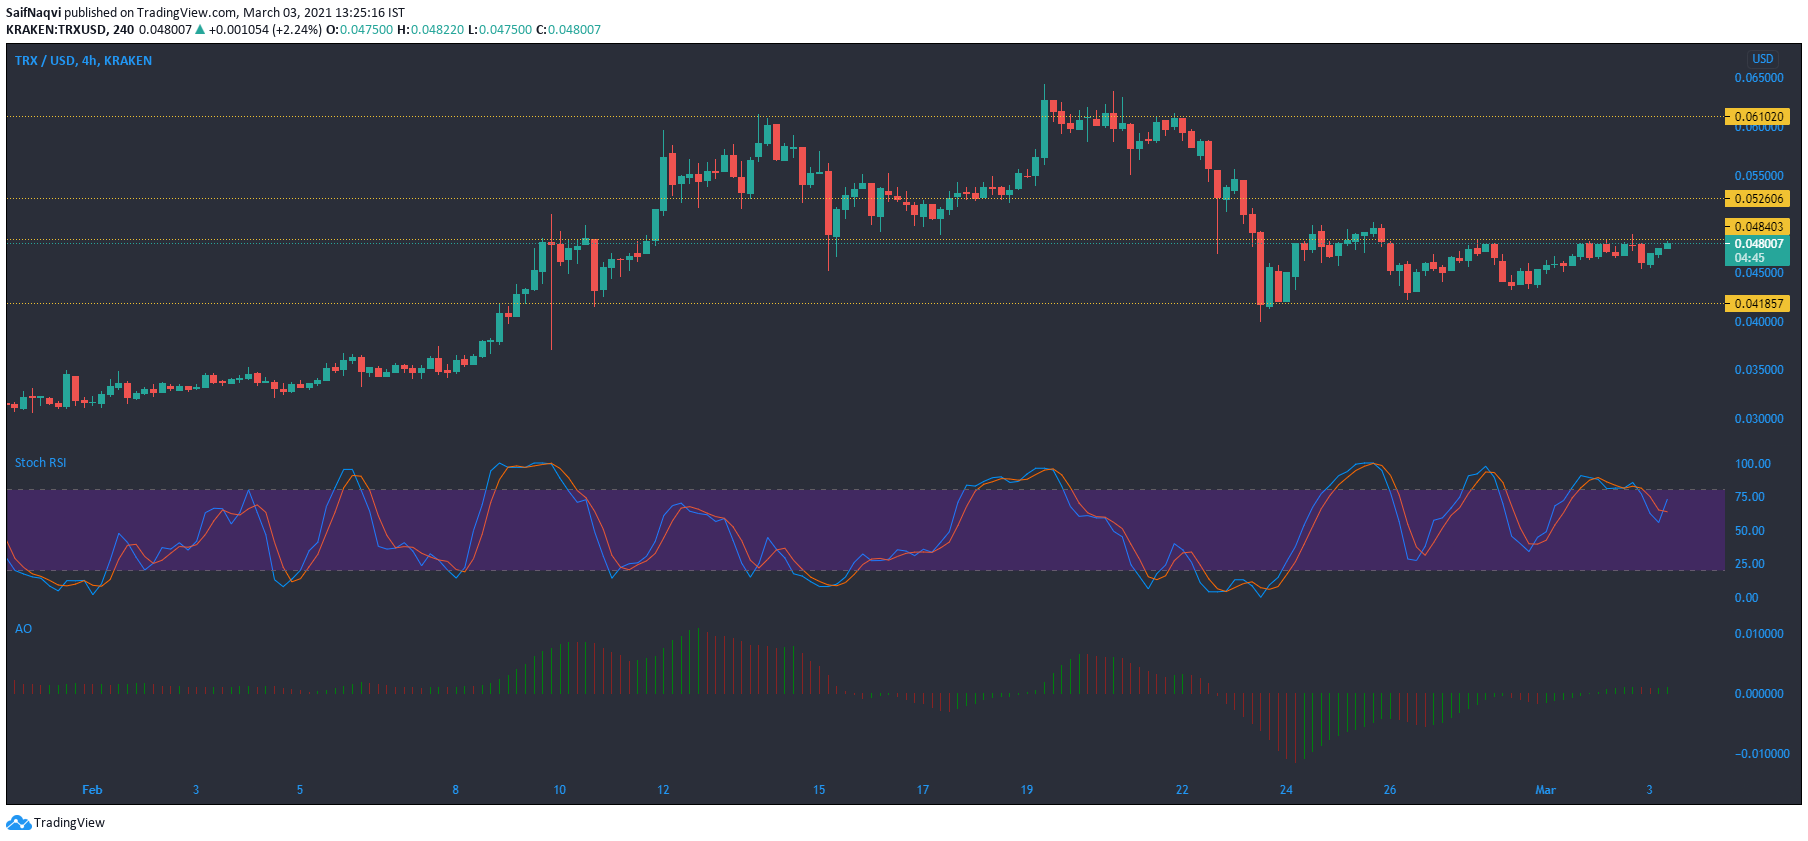
Even though the $0.048-resistance level has held strongly over the past week, Tron consistently formed higher lows in its attempt to move above the upper ceiling. This suggested that the bears would not likely hold on to the aforementioned level as bullish sentiment picked up all across the market. The sentiment was reflected by the Stochastic RSI since it was pointing towards the overbought zone, at press time.
The Awesome Oscillator displayed some neutrality but was leaning in favor of the buying side. With respect to the recent bearish nature of Tron’s price, a hike above the $0.048-resistance level is crucial to consider a bullish comeback on the charts.
Waves [WAVES]
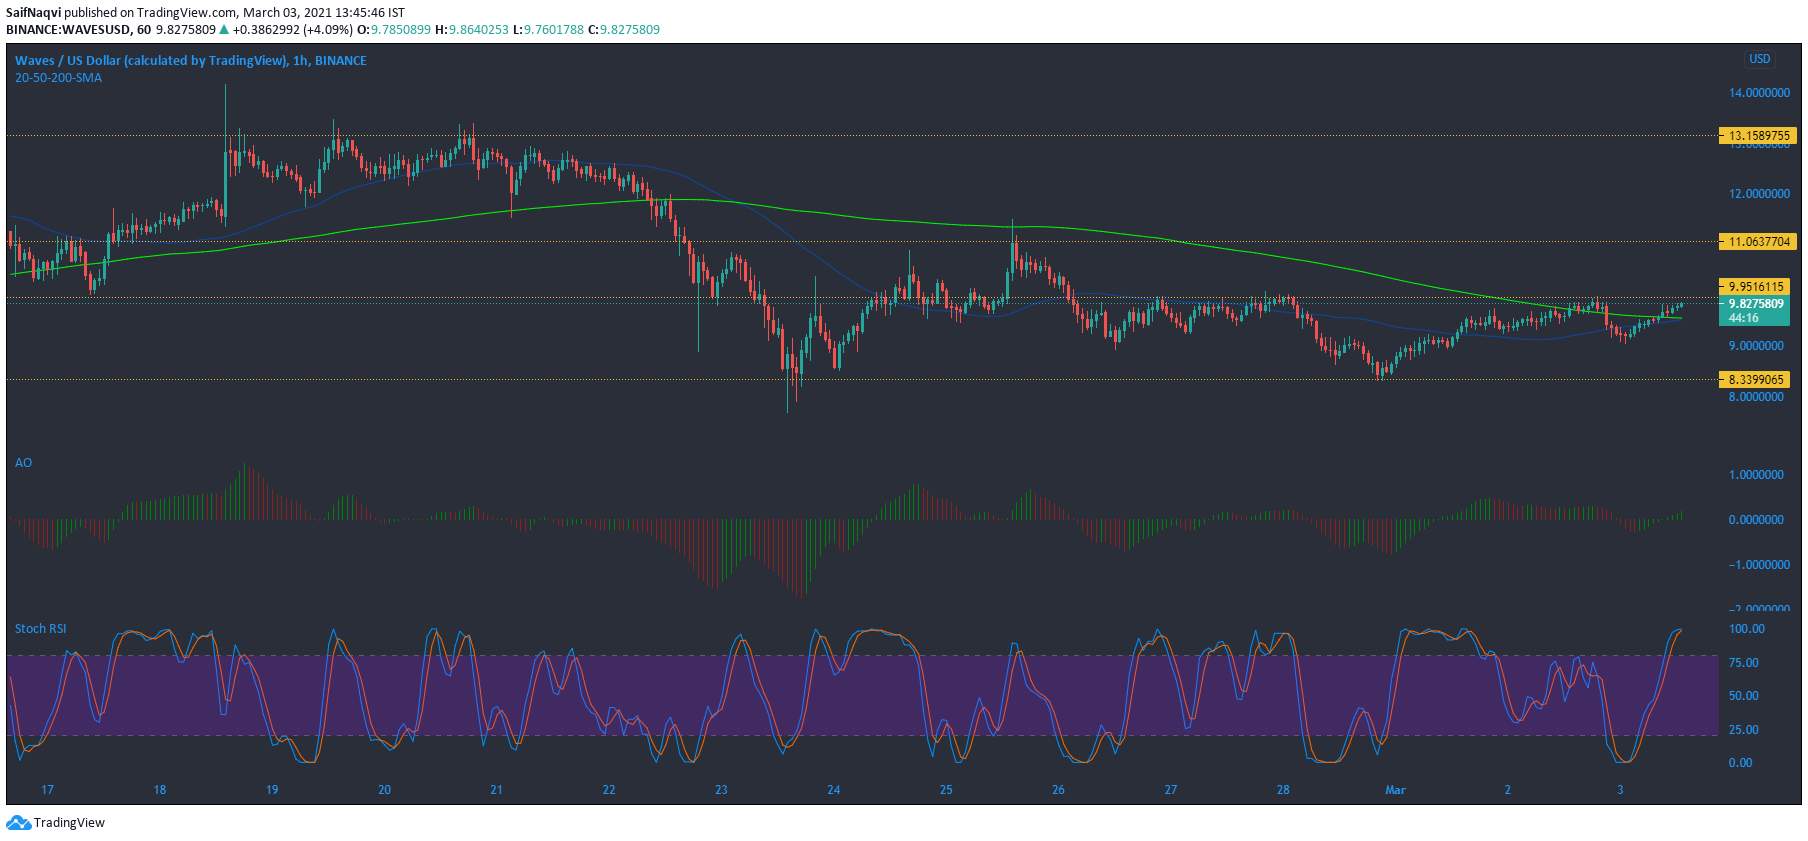
WAVES’ recovery was clearer on the hourly timeframe as the 50-SMA (blue) closed in on the 200-SMA (green). A crossover above the long-term moving average could trigger some buying in the market and push the price above its immediate resistance. The Awesome Oscillator lent its weight behind a favorable outcome after the green bars rose above the half-line. A bullish scenario could see the price move north and towards the $11-resistance mark.
On the flip side, the Stochastic RSI hinted at a reversal as it was being traded in the overbought zone. What remains to be seen is whether the bearish prediction could offset the bullish sentiment present in the WAVES market.
Maker [MKR]
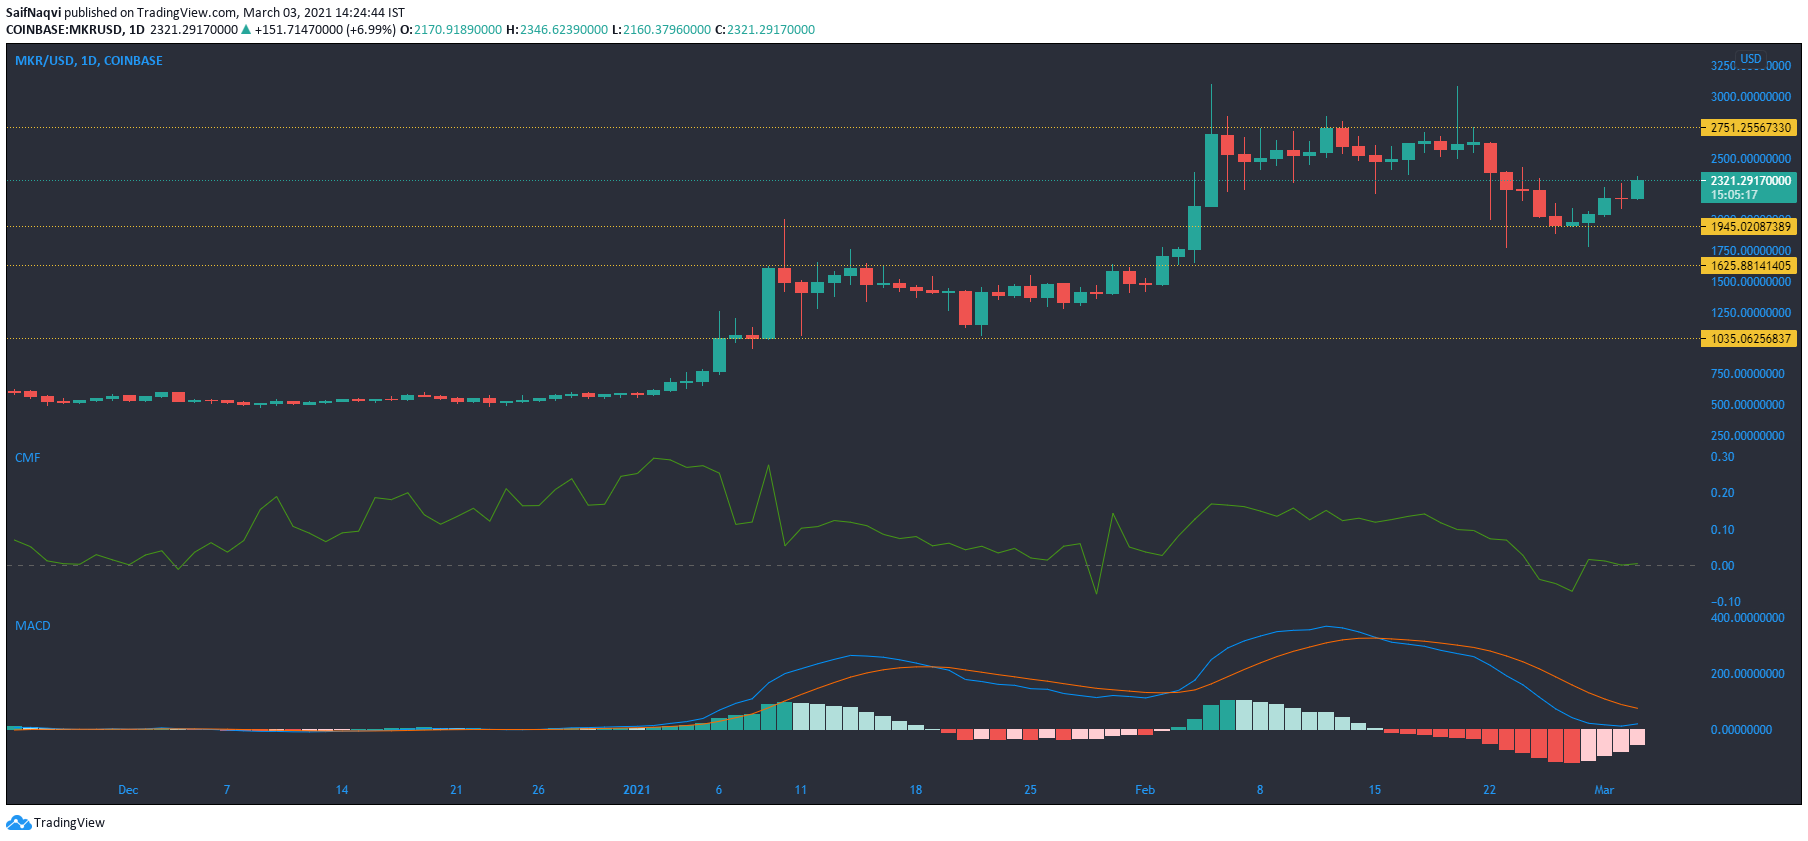
At the time of writing, Maker rose by over 4% in the last 24 hours and was trading at $2,321. Its daily chart underscored the positive movement after the price bounced back from the $1,945-support. In fact, a bearish doji, which is usually a sign of a reversal, was also negated after a higher close on the succeeding candlestick.
The MACD line closed in on the Signal line, while bearish momentum weakened on the histogram. Perhaps, a greater bullish development was the fact that the CMF, which tracks the flow of institutional capital, was maintaining itself just above the half-line.
Its recent price action suggested that MKR shared a strong correlation with the flow of capital as both moved in tandem over the past few sessions. Nevertheless, a hike to record levels could largely be determined by the state of the broader market.