Tron’s TVL thrives but can the same be said about TRX’s price action?
TRX’s RSI stayed in the overbought zone, which could drive the selling pressure. Other market indicators too didn't go easy on TRX as they flashed bearish signs.
![Tron’s [TRX] latest bull rally might end soon as these indicators turn bearish..](https://ambcrypto.com/wp-content/uploads/2023/05/TRX-3.png)
- Tron’s staking ecosystem performed recently, as the total TRX staked remained stable
- TRX’s price had already declined by more than 1% in the last 24 hours
Tron [TRX] investors had a comfortable week as the token registered promising gains. According to CoinMarketCap, TRX’s price increased by more than 9% in the last seven days.
At the time of writing, TRX was trading at $0.07708 with a market capitalization of over $6.9 billion. Not only that, but Tron’s staking ecosystem also grew of late, which looked encouraging. However, CryptoQuant’s data revealed that the coming week might not look the same.
Read Tron’s [TRX] Price Prediction 2023-24
A look at Tron Staking
Tronscan, in a tweet posted on 23 May, revealed growth in its DeFi ecosystem. As per the tweet, TRX Staking Governance stood second on the list with $3,436,249,926 TVL in the Tron ecosystem.
🔥Total Value Locked(#TVL) in #TRON #DeFi Ecosystem are all growing today! $TRX Staking Governance ranks No.2 with $3,436,249,926 TVL in #TRON Ecosystem. pic.twitter.com/8gjhBnUe72
— TRONSCAN (@TRONSCAN_ORG) May 23, 2023
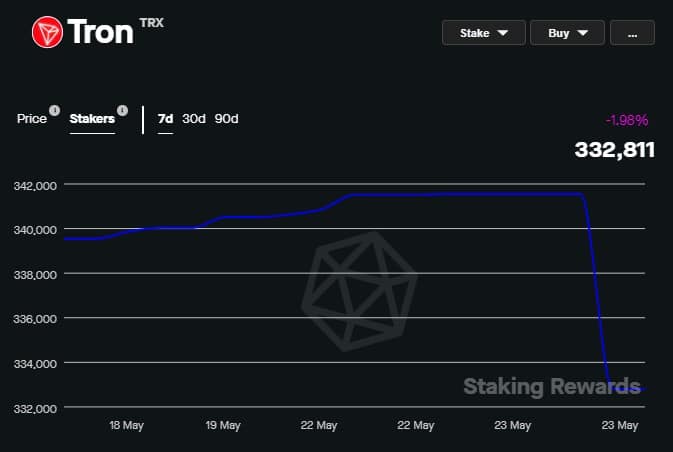
The amount of TRX staked also remained pretty stable throughout the last month. Tron Stake 2.0’s share accounted for nearly 9% of the total TRX staked, while Stake 1.0 had over 90%. However, Staking Rewards’ data revealed that the number of TRX stakers had declined marginally over the last seven days.
Nonetheless, Tron’s adoption maintained its growth trajectory as it reached another milestone. TRONSCAN’s data also revealed that the total number of addresses on the Tron network exceeded the 16 million mark, which was positive news.
Investors and their worry
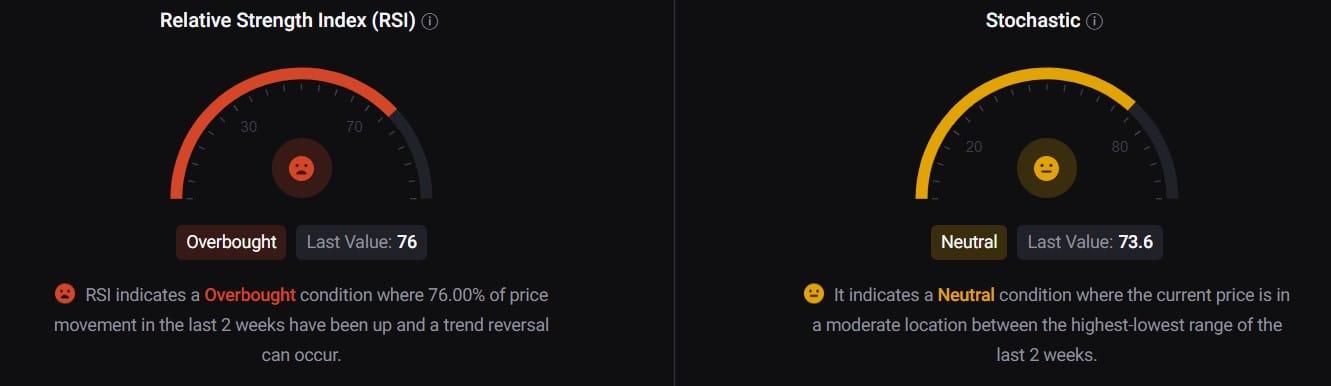
After a comfortable week, data from CryptoQuant revealed that at press time, TRX’s price had entered an overbought zone. This can increase selling pressure on TRX, in turn reducing its price over the coming days.
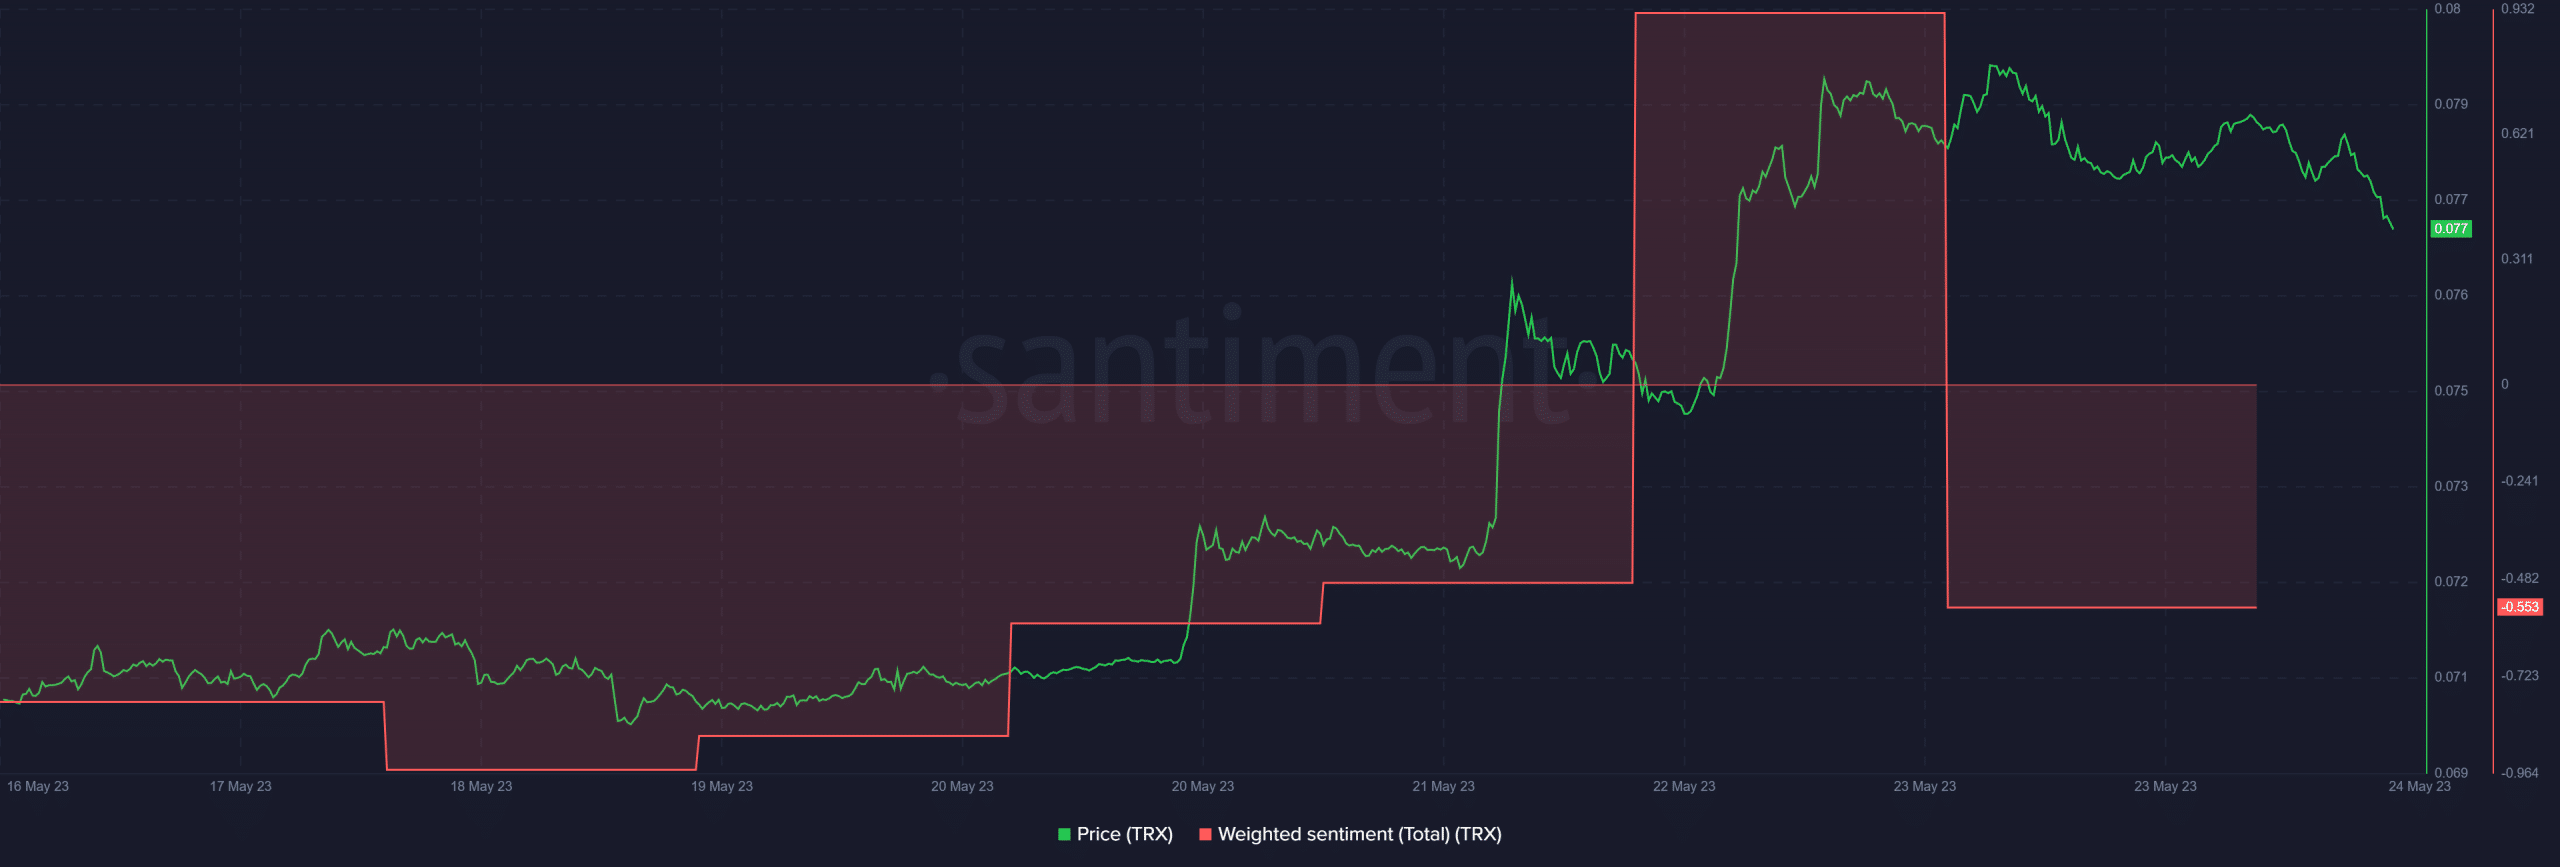
The impact of this has already started to appear, as TRX’s 24-hour price chart was red. Over the last day, TRX’s price had declined by 1.3%. TRX’s weighted sentiment also drifted in the negative zone, suggesting investors were not confident in the token.
Moreover, LunarCrush’s data revealed that bullish sentiment around TRX went down by 46% and bearish sentiment increased by 31% in the last 24 hours.
How much are 1,10,100 TRXs worth today
The bears are here
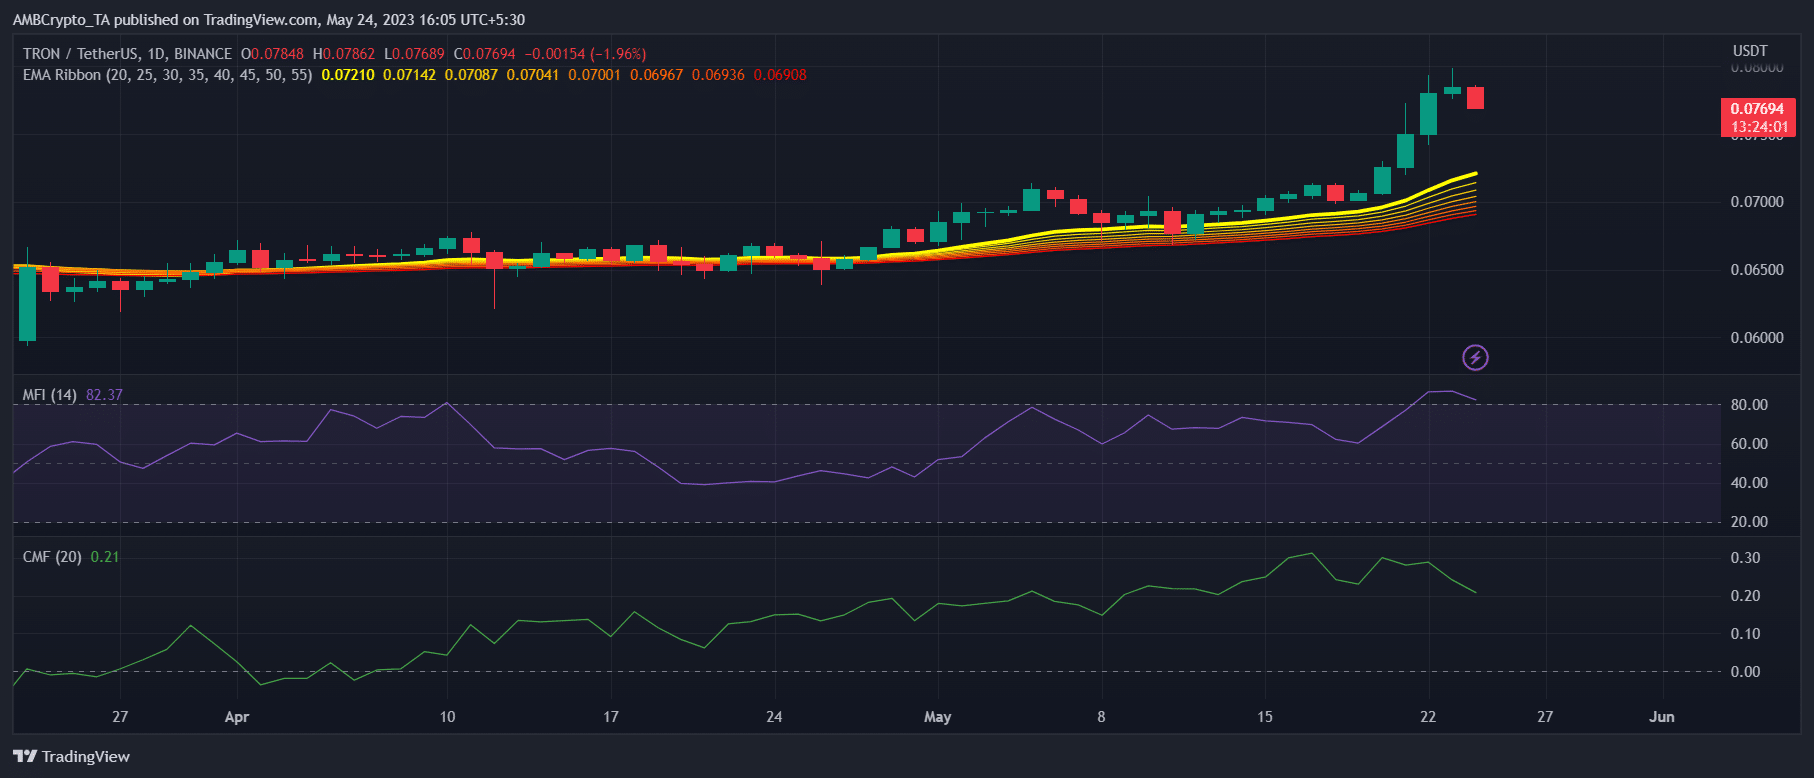
Like the Relative Strength Index (RSI), TRX’s Money Flow Index (MFI) also entered the overbought zone, which was a typical bearish signal. Tron’s Chaikin Money Flow (CMF) also registered a downtick, further increasing the chances of a continued price decline over the coming days.
Nonetheless, the Exponential Moving Average (EMA) Ribbon still remained bullish, as the 20-day EMA was above the 55-day EMA.