UNI trades at $4 support; traders can look for this before placing trades
Uniswap's Open Interest took a hit alongside prices in the past 24 hours. This reflected discouraged longs. But the more significant factor was the spot CVD

Disclaimer: The information presented does not constitute financial, investment, trading, or other types of advice and is solely the writer’s opinion.
- UNI was trading at an HTF support, heightening bullish chances of a recovery
- The decline in demand suggested otherwise
Uniswap [UNI] saw an update to its Time-Weighted Average Market Maker [TWAMM]. This update is expected to reduce the impact of sudden price swings on large trades. On the price action front, Bitcoin’s [BTC] recent losses saw UNI plunge lower.
Read Uniswap’s [UNI] Price Prediction 2023-24
As previously stated by AMBCrypto, Uniswap has a bearish higher timeframe bias. The report highlighted the $4.5 level as one to short UNI at. This idea was vindicated but the volatility on 2 October saw prices jump to $4.67, which could have stopped some short-sellers.
Will June’s bullish order block be defended?
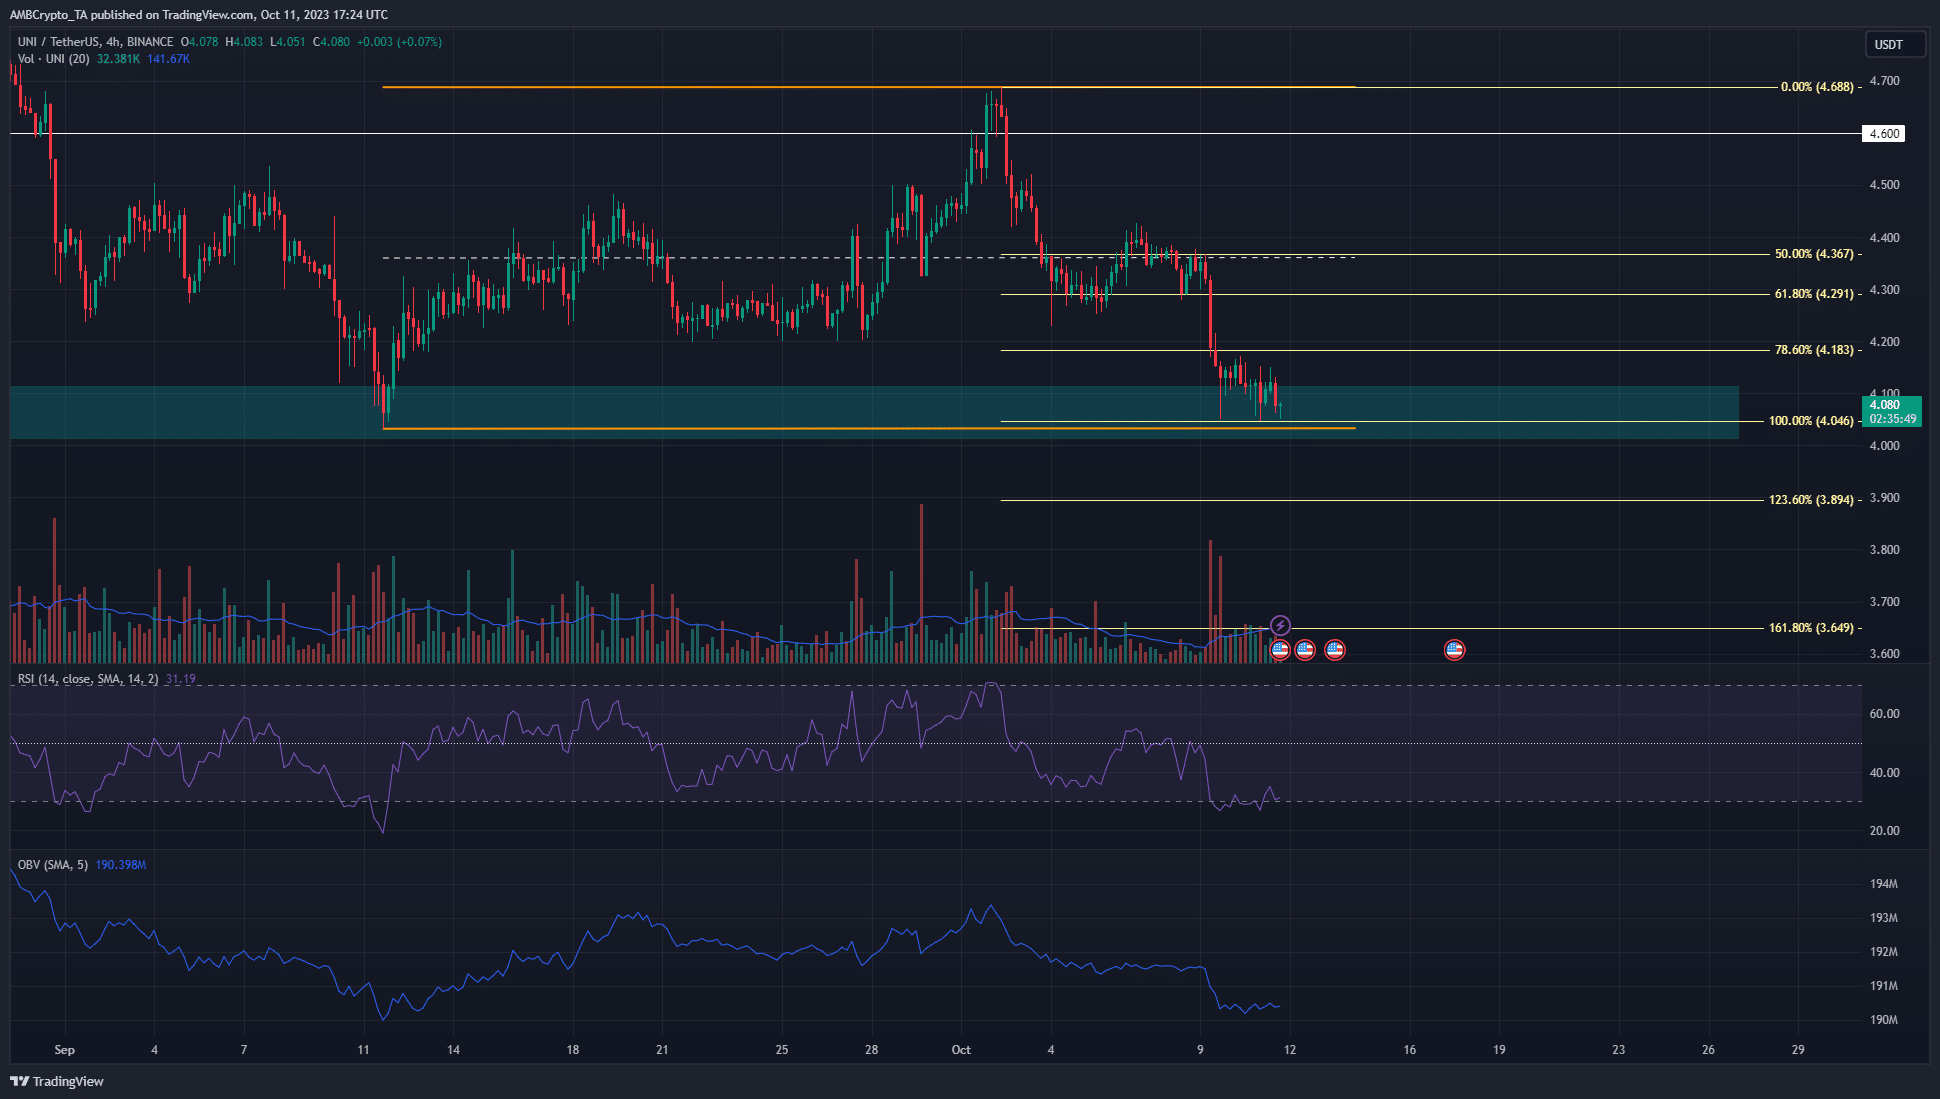
Uniswap was trading at the psychological $4 support level at the time of writing. It was also a bullish order block on the one-day chart from mid-June. There were two ways to look at UNI. The first was from a range-bound perspective.
The range (orange) extended from $4.03 to $4.68. The presence of the daily Order Block (OB) meant the chance of a bounce was good. The market structure and momentum were bearish, with the Relative Strength Index (RSI) at 31. More importantly, the On-Balance Volume (OBV) would need to see a bounce to reflect buying pressure. A continued decline in the OBV would reflect bearish dominance, which leads to the second scenario for UNI.
The Fibonacci levels (pale yellow) showed southward extension levels at $3.9 and $3.65 as possible targets for UNI in the event of a drop below the OB. After a drop below $4, a retest of the $4-$4.1 zone could present an ideal shorting opportunity.
The lack of spot demand meant further losses had a higher likelihood
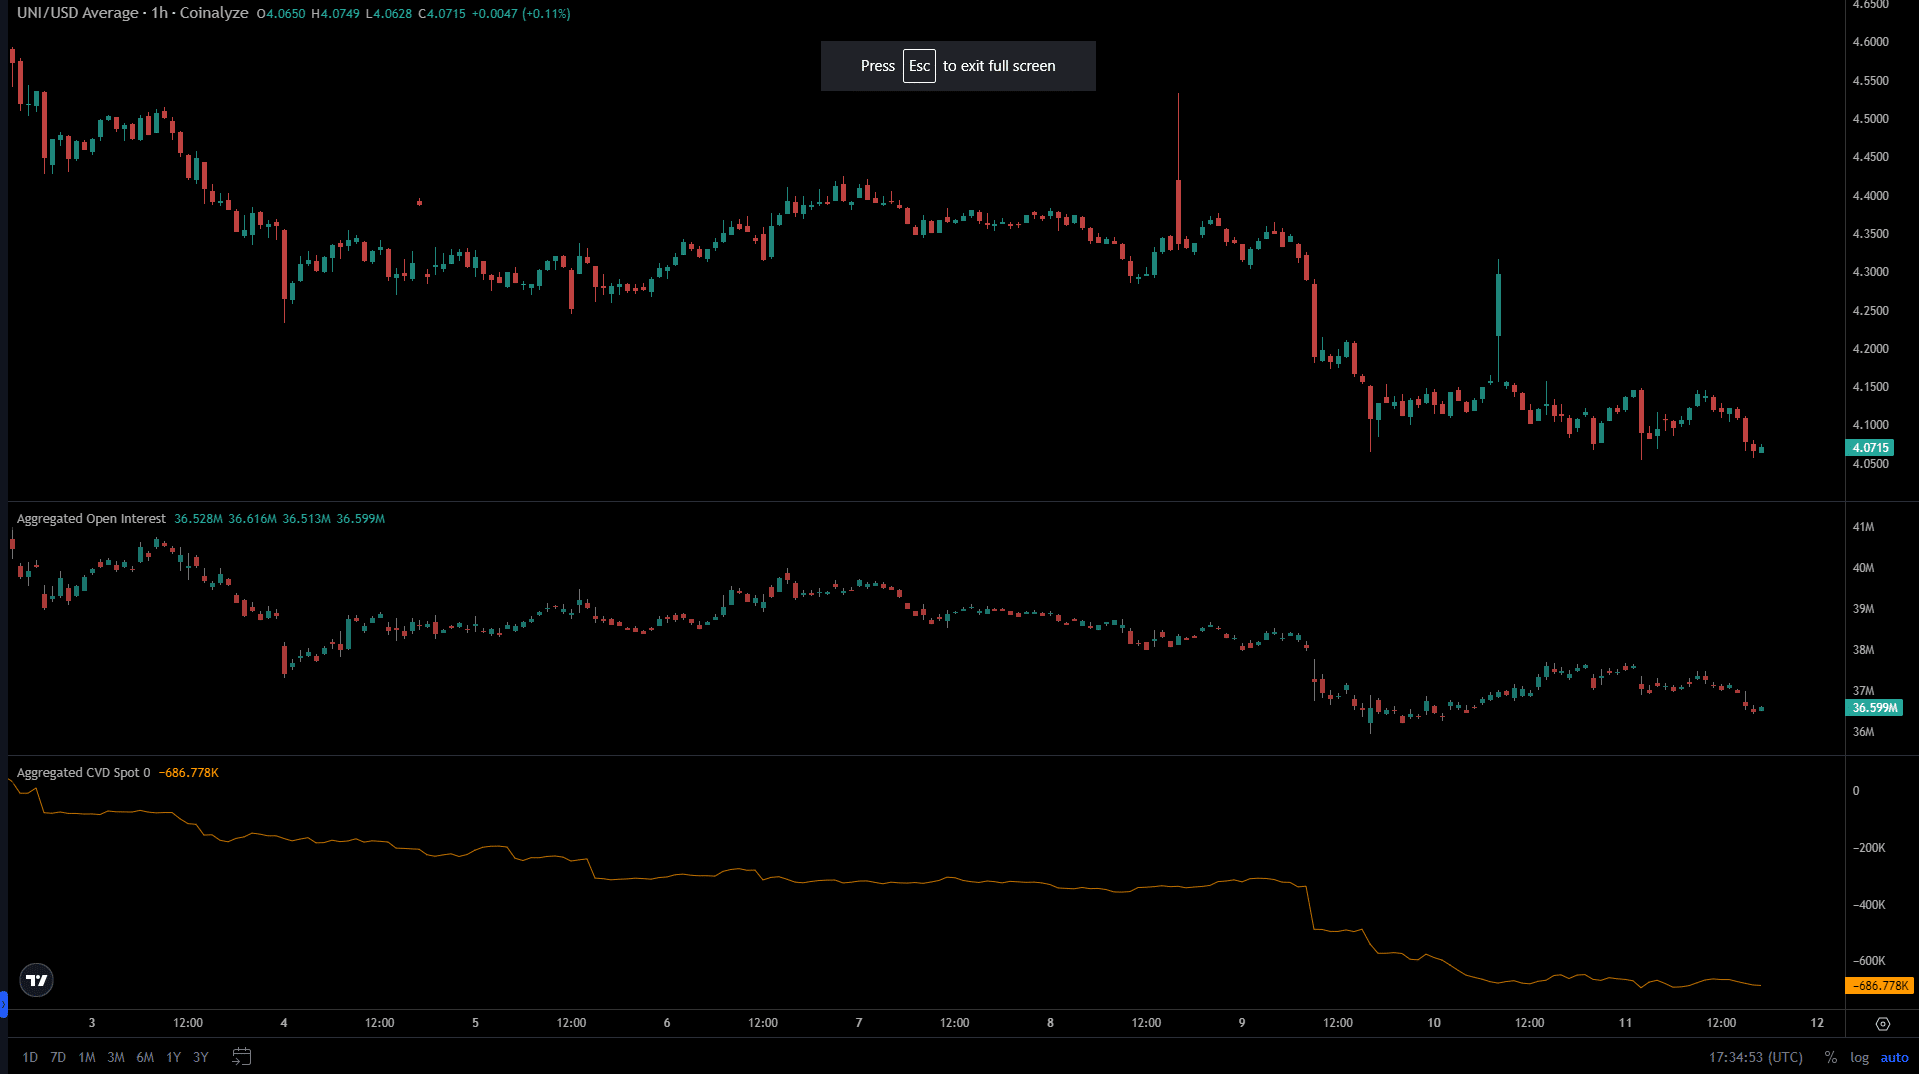
The Open Interest (OI) took a hit alongside prices in the past 24 hours. This reflected discouraged longs. But the more significant factor was the spot Cumulative Volume Delta (CVD). This indicator has trended downward since 9 October.
How much are 1, 10, or 100 UNI worth today?
It was unlikely that UNI could embark on a rally to the range highs if the spot CVD continued to stay flat or declined. Hence, unless this changes, traders can anticipate losses in the coming days.