Uniswap, EOS, Compound Price Analysis: 14 March

Uniswap climbed past $44 but was driven back lower as demand was unable to keep up with the price. EOS tested the $4.4 area of supply and Compound was in a downtrend over the past few days.
Uniswap [UNI]

Source: UNI/USDT on TradingView
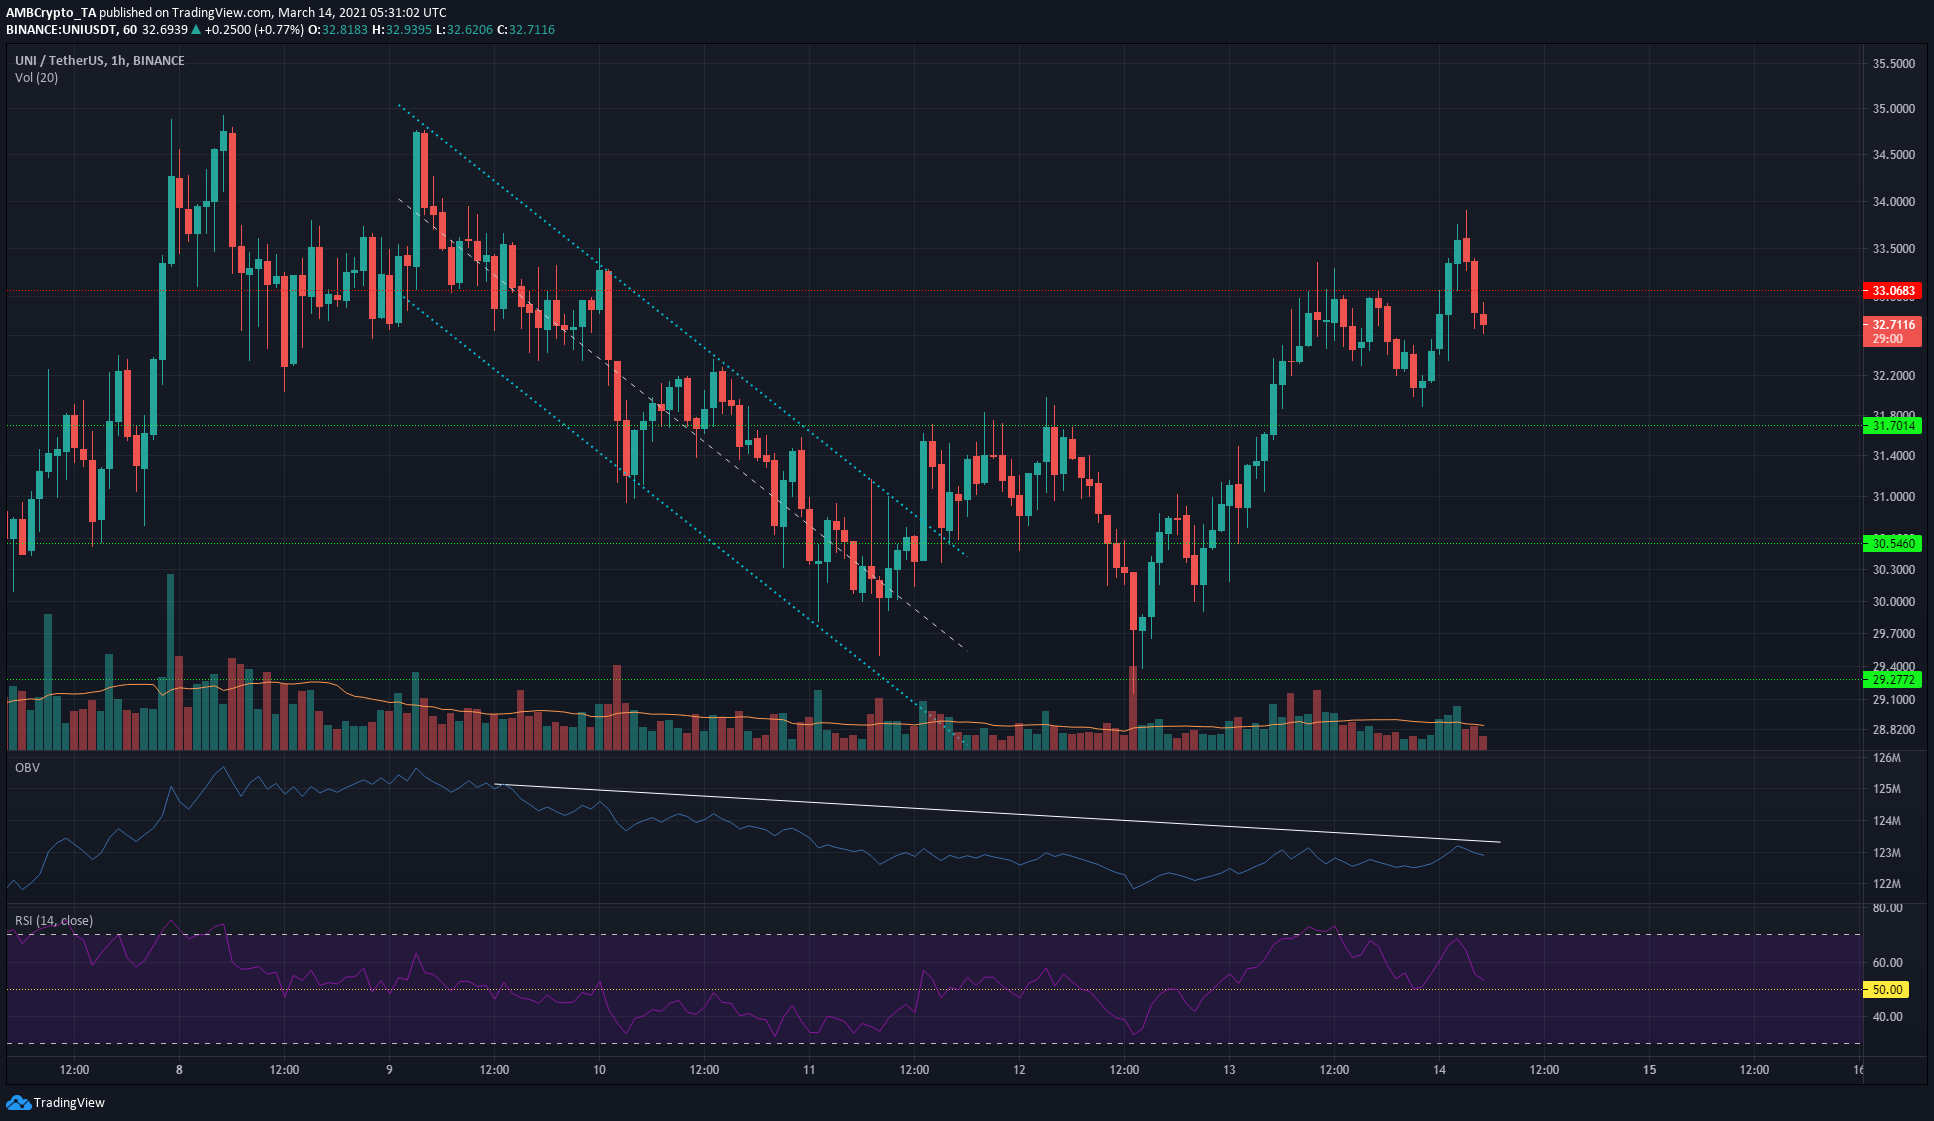
Over the past couple of days, UNI has recovered with momentum after falling to $29.2. Since then, it has climbed past the $30.5 and $31.7 levels of resistance, and even rose above $33 a few hours ago but faced rejection.
The reason for the rejection could be a lack of buyers. Looking at the OBV from when UNI was at $33 nearly a week ago, it can be seen that since then the selling volume has been greater than the buying volume. This lack of demand could see UNI pushed toward $32 once more before another move upward.
The RSI also showed a bearish divergence on the hourly chart, making the $32-$32.5 an area where buyers could step in after the dip.
EOS

Source: EOS/USDT on TradingView
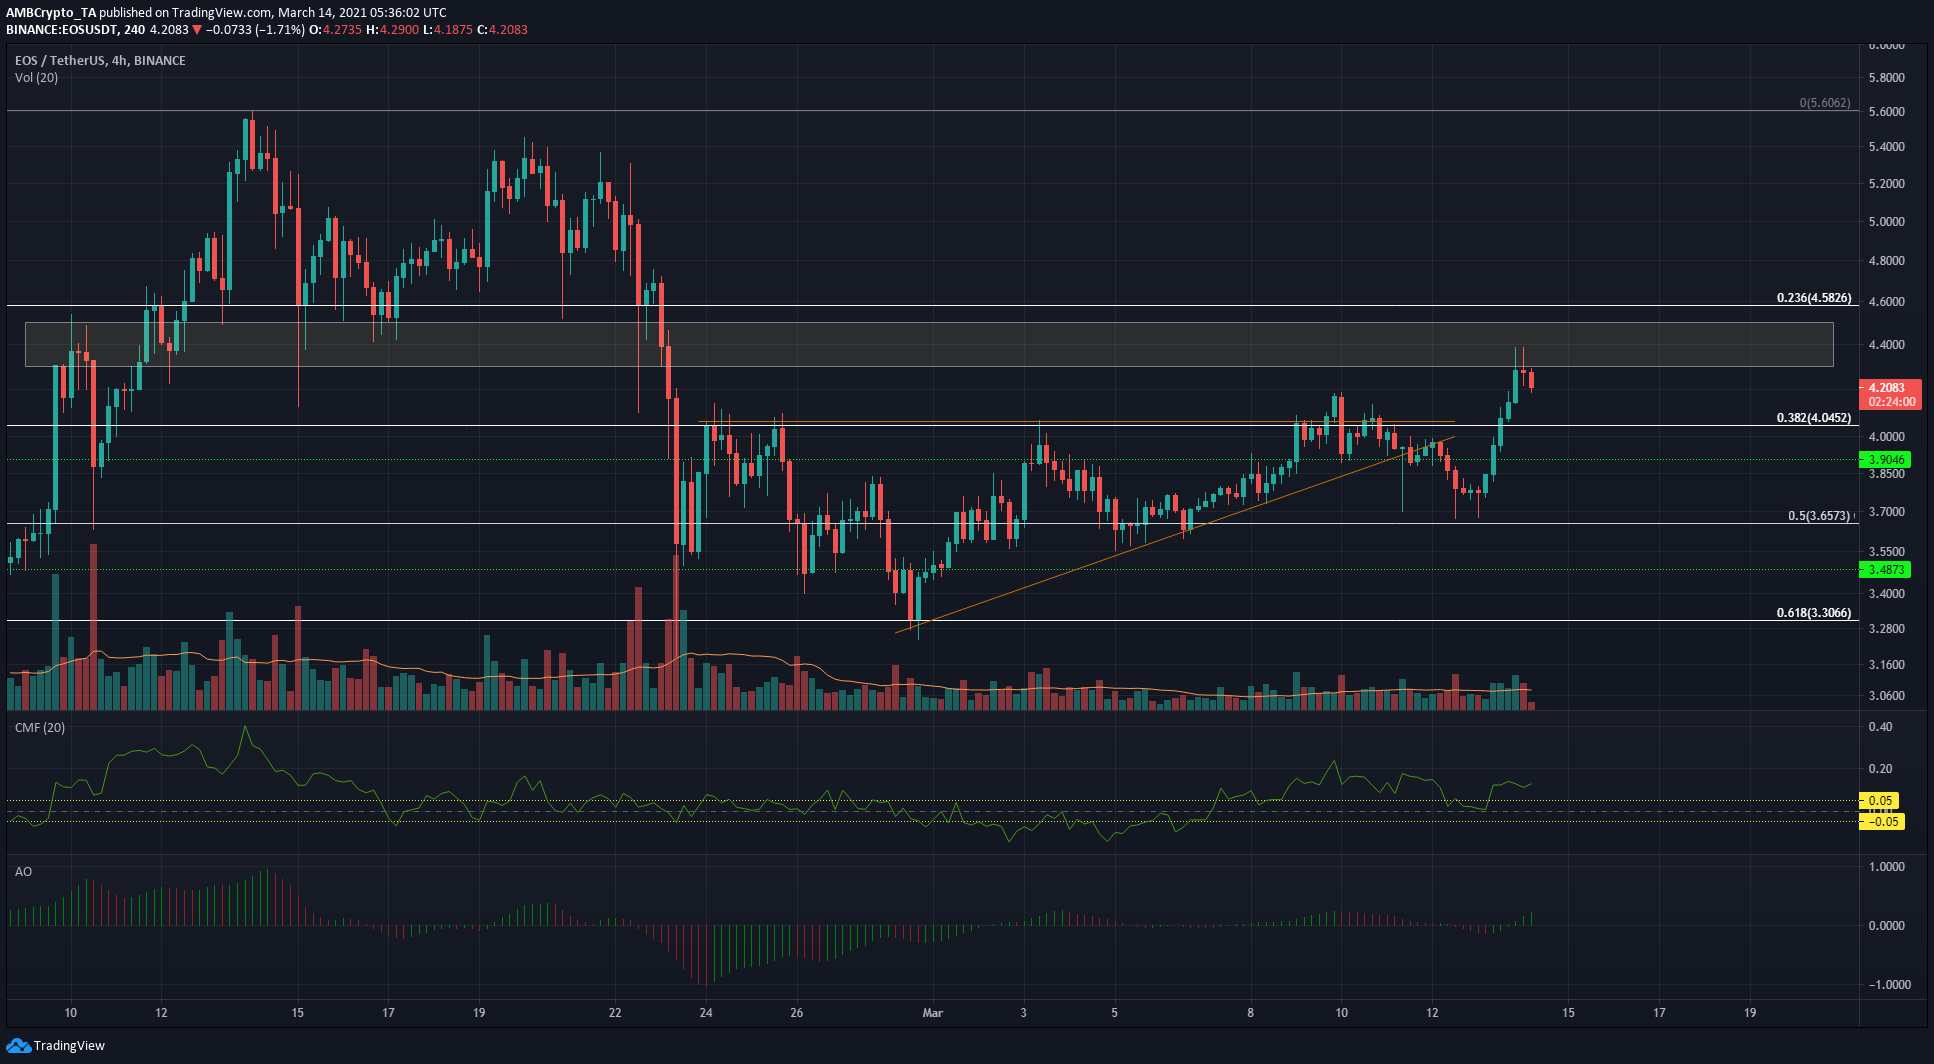
On the 4-hour chart, momentum appeared to side with the bulls as the Awesome Oscillator crossed over above the zero line. EOS also rose past $4 and met rejection at the $4.4 area of supply.
The Chaikin Money Flow showed net capital flow into the market, pointing toward buyer dominance. Trading volume has also been above average as EOS climbed past the $3.9 and $4 marks.
A possible scenario for EOS is a dip to $4.1-$4.15 area and another attempt to scale past the $4.4 area of supply. The ascending triangle (orange) pattern, which generally sees a bullish breakout, will likely see a weakened surge due to the pullback before the breakout of the past few days, making the $4.6 level a significant level of resistance.
Compound [COMP]

Source: COMP/USDT on TradingView
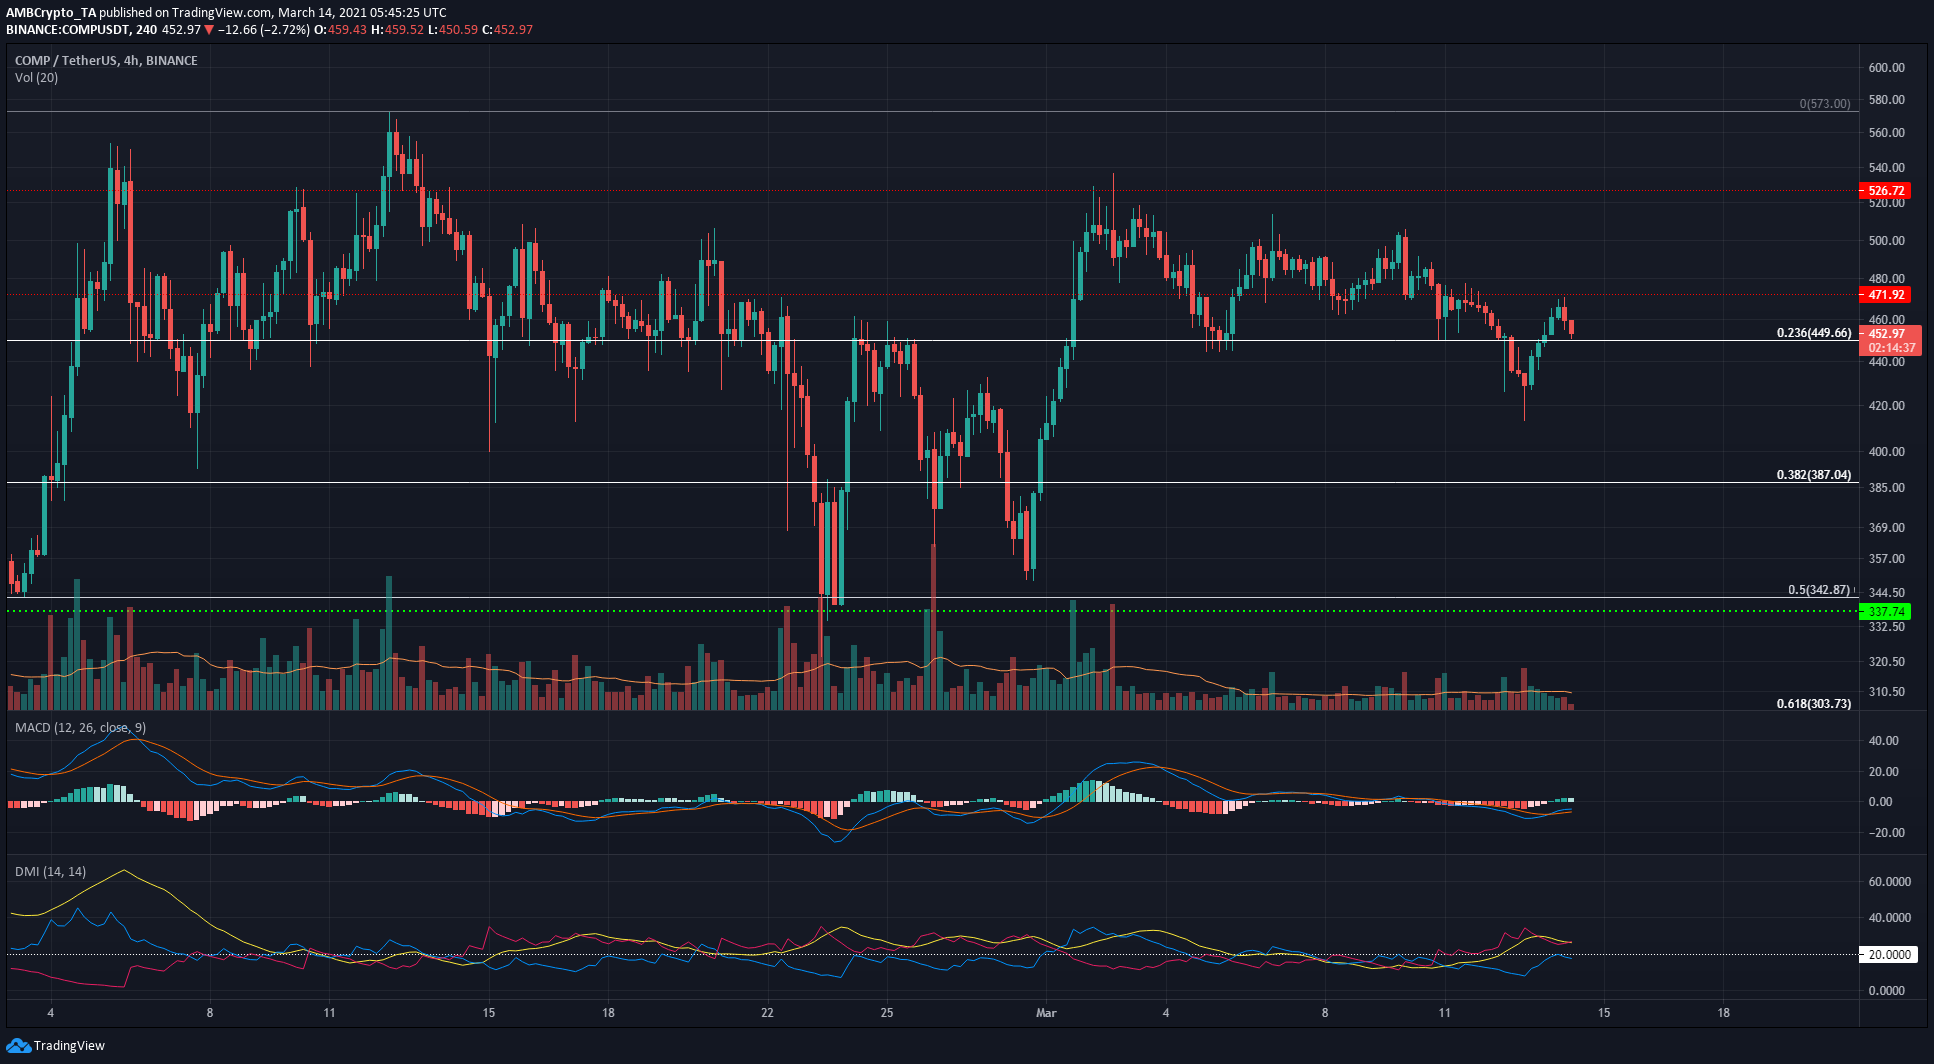
Last week, COMP climbed above the $470 mark and the bulls tried to defend it as support but were overwhelmed. The loss of this level as support sparked a short-term downtrend to $430, where a strong bounce was seen to retest $470 as resistance.
At the time of writing, the DMI showed a bearish trend in progress, with the ADX and -DI both soaring above 20. The MACD was below the neutral line and could form a bearish crossover if COMP drops below $449.


