Uniswap, Polkadot, Bitcoin Price Analysis: 01 June

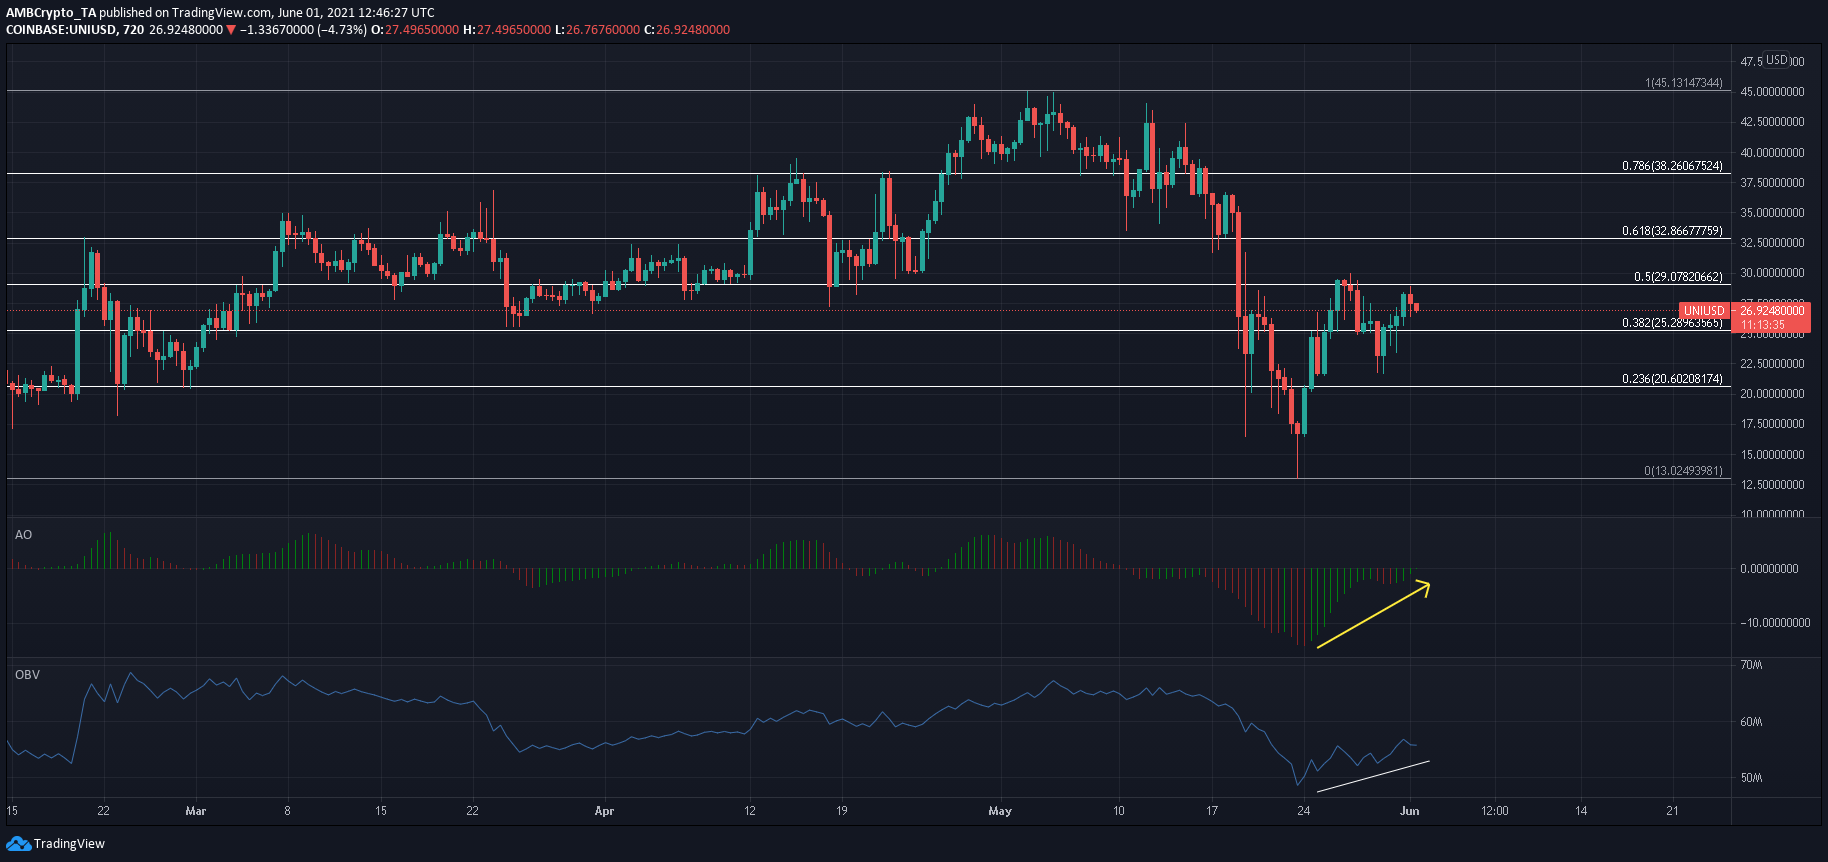
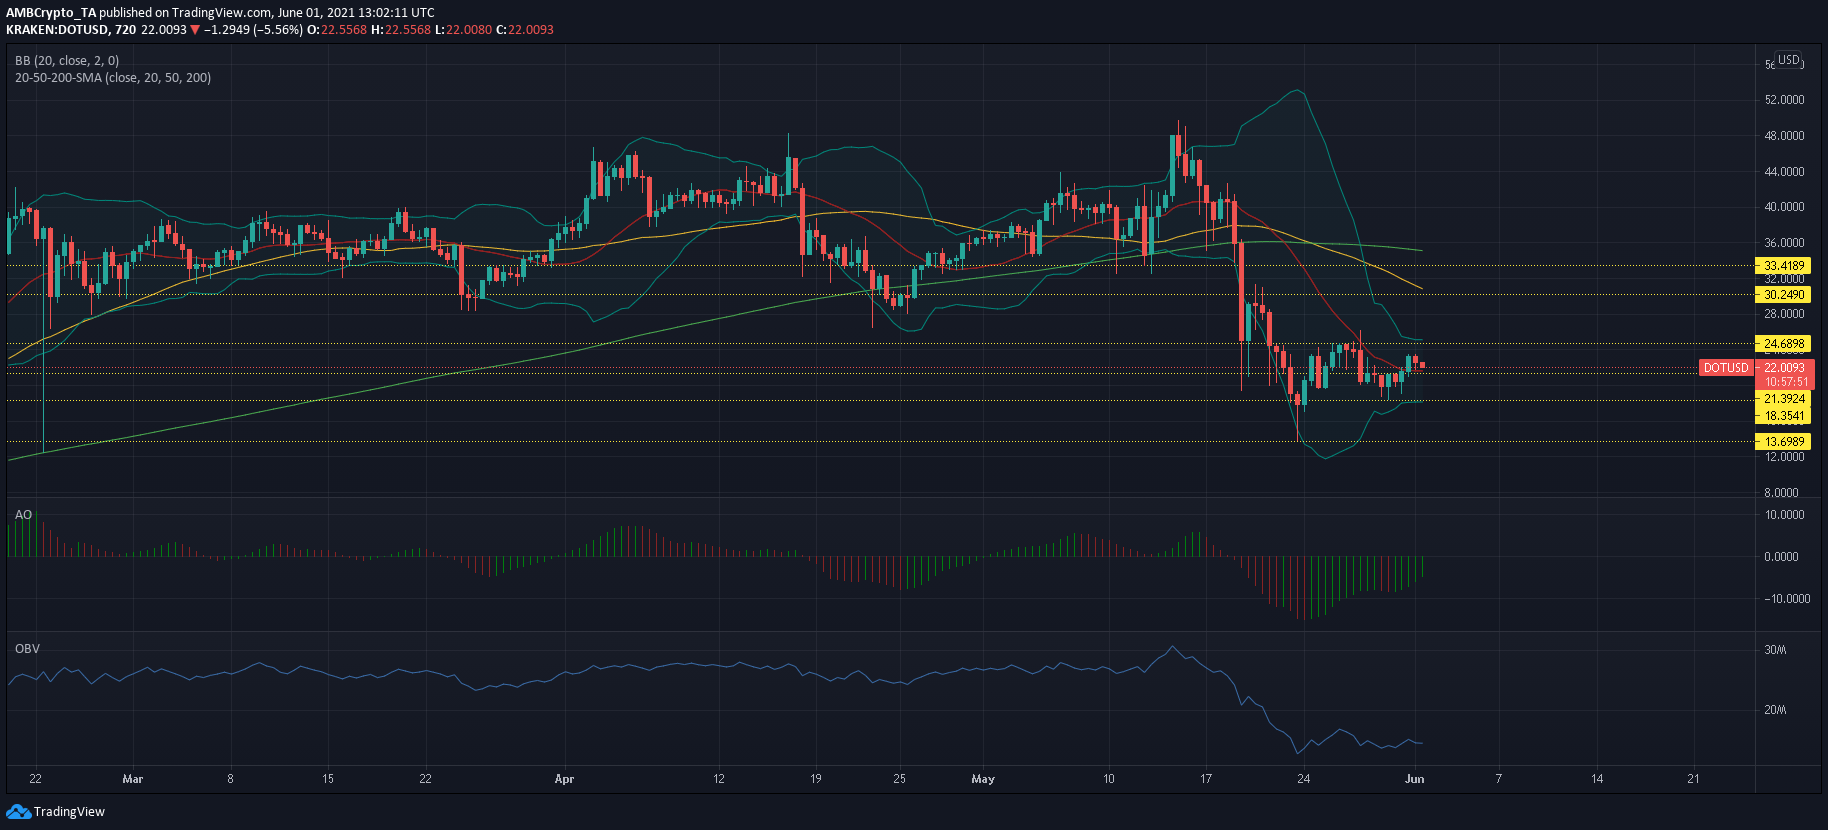
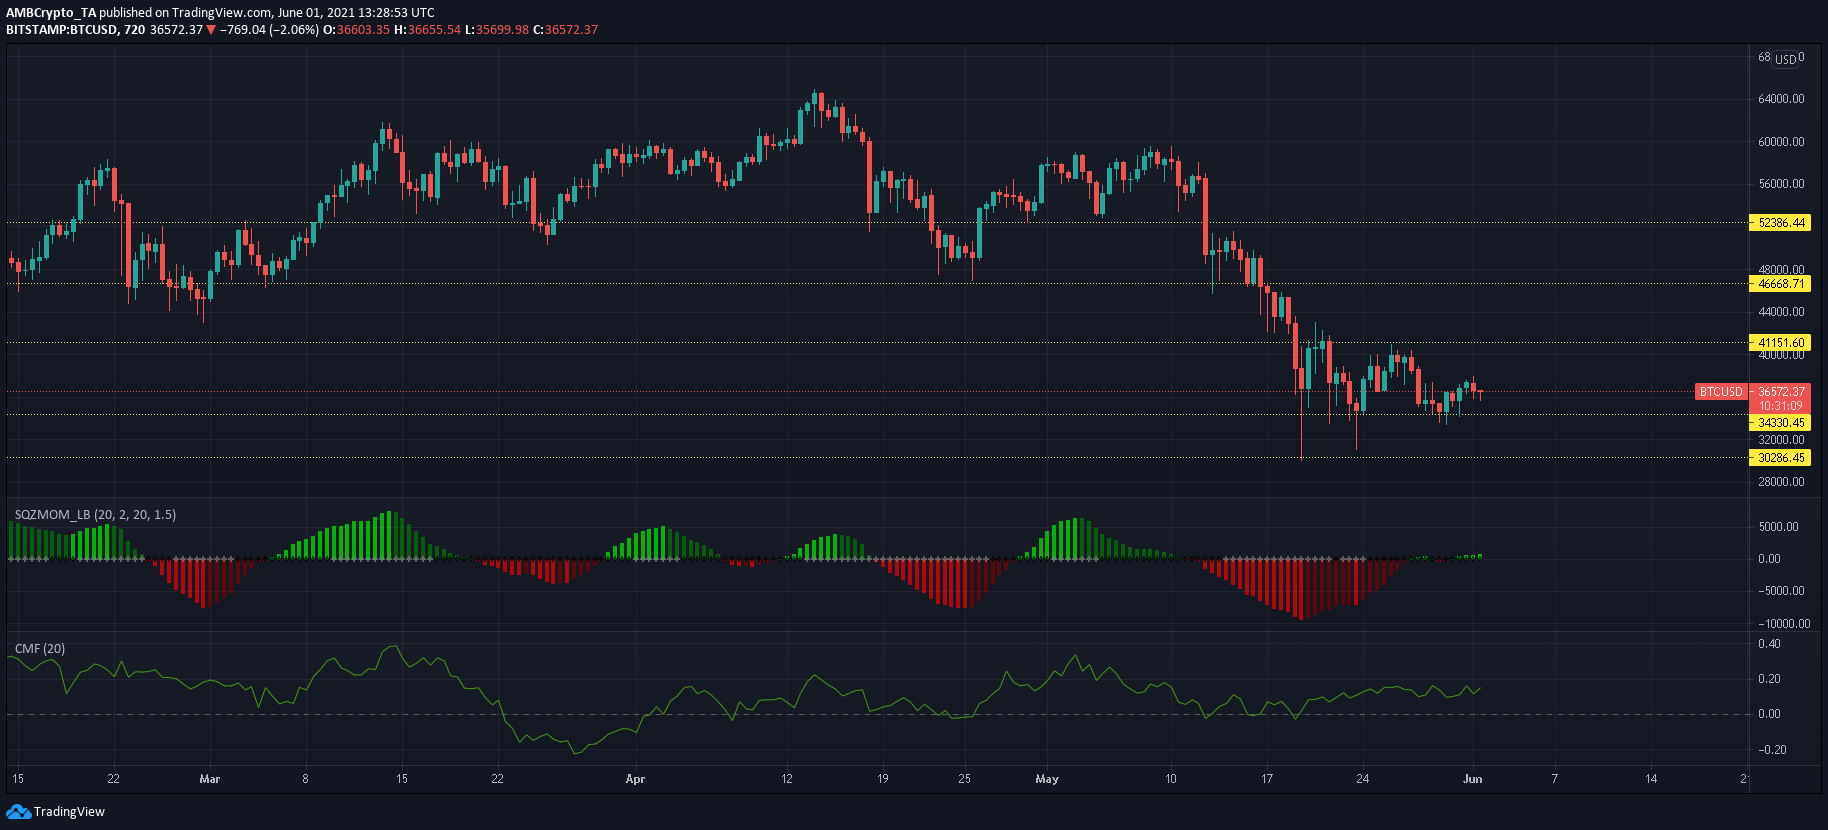
Uniswap was denied a breakout above 50% Fibonacci level ($29) yet again. Polkadot lacked volatility for a major price swing. Finally, Bitcoin could see a retracement towards $31,000 if it fails to break above $37,500.
Uniswap [UNI]

Source: UNI/USD, TradingView
Uniswap met with some selling pressure as 50% Fibonacci level ($29) denied a breakout once again. However, maintaining losses above 38.2% Fibonacci level ($25.5) could allow for a breakout over the short-mid term. Buying pressure has been on the rise over the past week according to Awesome Oscillator. A rise above half-line on strong volumes would signal an incoming price swing for UNI.
A steady recovery in OBV highlighted that buying volumes have outpaced selling volume- another healthy sign with regard to UNI’s short-mid term path. However, bearish broader market cues would likely trump such signals.
Polkadot [DOT]

Source: DOT/USD, TradingView
Polkadot maintained a tight channel of $24.7 and $18.3 over the past few days. This was hardly a surprise considering low volatility in the market – something highlighted by the constrained Bollinger Bands. Selling pressure seemed to have also settled as OBV showed flat-like movement over the past week.
However, consolidation was likely to continue over the coming sessions before volatility picks up once again. When a breakout does occur, sellers might return between $30 and $33- an area bolstered by 50-SMA (yellow) and 200-SMA (green). While DOT’s short-term movement may be under the pump, it has constantly been working on its ecosystem– something that could benefit its long-term trajectory.
Bitcoin [BTC]

Source: BTC/USD, TradingView
An important few days lay ahead for the king coin. A breakout above $37,500 has been denied by the sellers over the past few days and this came after BTC’s failed breakout attempt above $42,000. The supply zone seems to keep extending for BTC- a warning sign for its short-mid trajectory.
If BTC fails to clear $37,500 over the coming days, its next pullback might take place all the way to $30,000-31,000. However, the presence of a demand zone within this region could counteract an extended sell-off. Conversely, if BTC manages to retake $37,500 and sustain higher levels, a breakout above $42,000 can be expected moving forward.
Weak momentum was present across the BTC market according to Squeeze Momentum Indicator. This also highlighted that BTC was in a sensitive position and a move in either direction was possible. On the plus side, the flow of capital remained healthy according to Chaikin Money Flow.


