Uniswap, Solana, MATIC Price Analysis: 25 May

Uniswap was predicted to move sideways above $20 before resuming its recovery. Solana needed to retake a critical zone at $34.9-42.5 to completely flip bear market conditions. Finally, MATIC could bounce back from $1.49 but a sharper retracement would emphasize support marks at $1.32 and $1.175.
Uniswap [UNI]
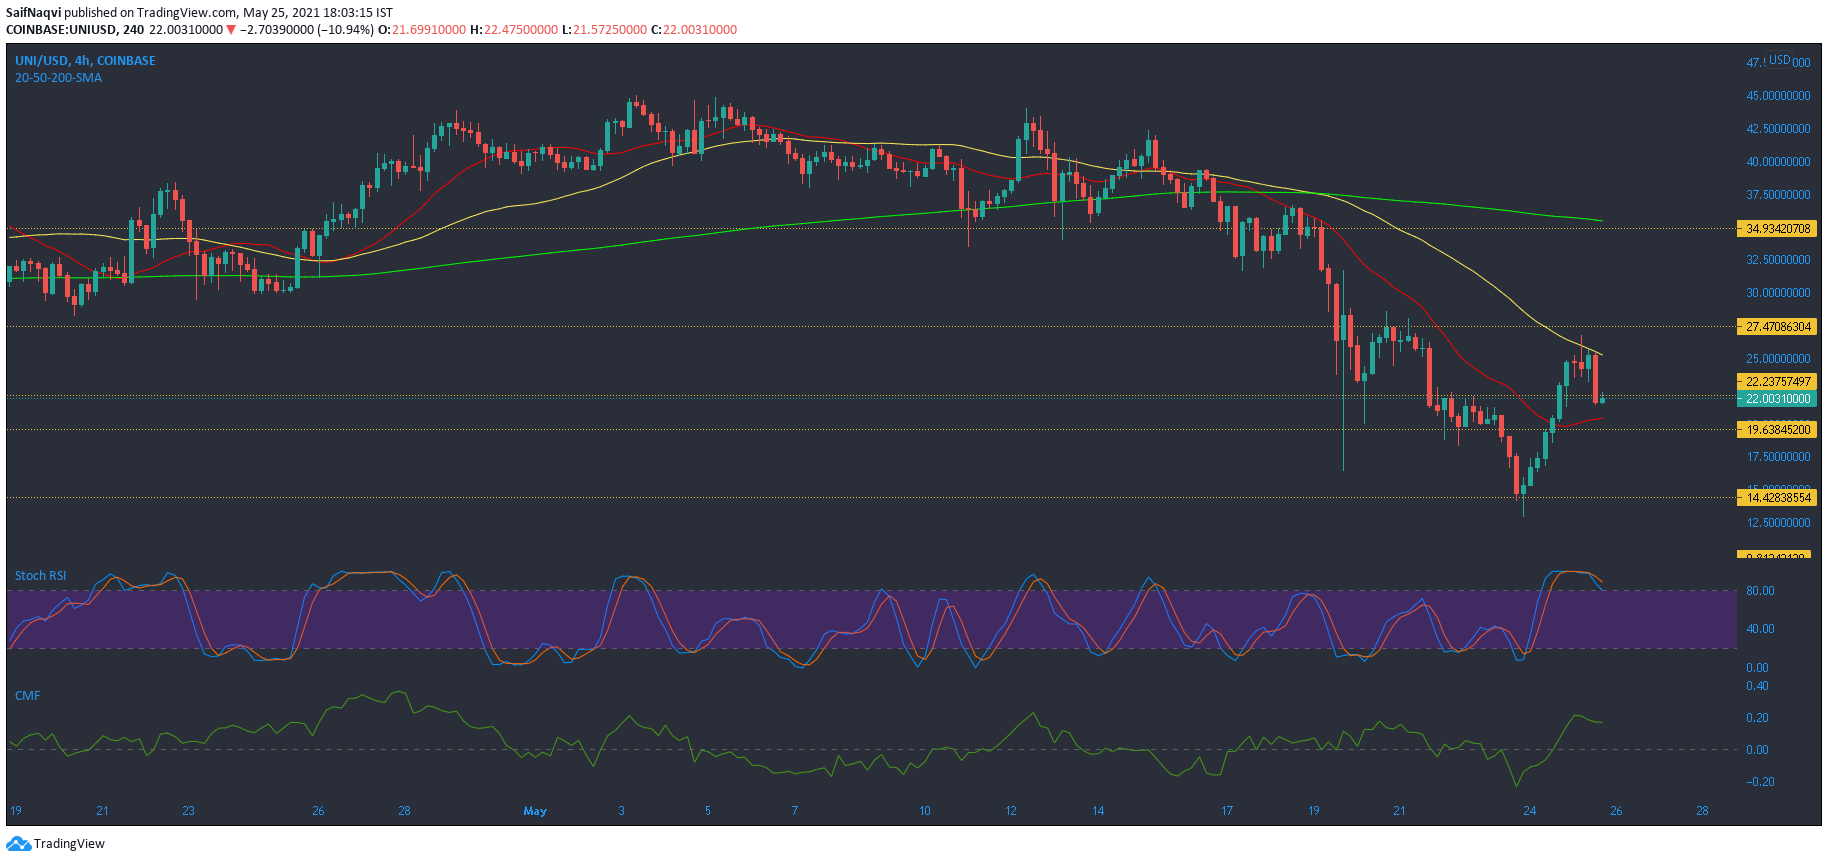
Uniswap was rejected at its 50-SMA (yellow) on the 4-hour chart but this limit was well within expectations according to previous analysis. As reiterated, this presented the possibility of sideways movement, with $19-20 offering some support. In fact, the predicted movement could also be considered bullish over the short term as UNI needed to reset after yesterday’s gains.
Stochastic RSI moved south after highlighting overbought conditions for UNI. Meanwhile, healthy capital inflows according to Chaikin Money Flow could act as a buffer against further price drops.
Solana [SOL]

Solana failed to rise above its EMA Ribbons and selling pressure was observed once again on its 4-hour chart. A strong defensive line rested at $25 and could cushion incoming losses. For a bullish outcome, a crucial area to retake rested between $34.9-42.5. This zone showed a confluence between EMA ribbons, 200-SMA (blue) and a strong resistance mark. A jump above this zone would likely enable a push north of $50-resistance, however, this was more of a mid-long term target.
MACD’s histogram noted some weakening momentum. Overall, expect MACD to remain below half-line on the 4-hour timeframe till the broader market recovers further from recent lows.
MATIC
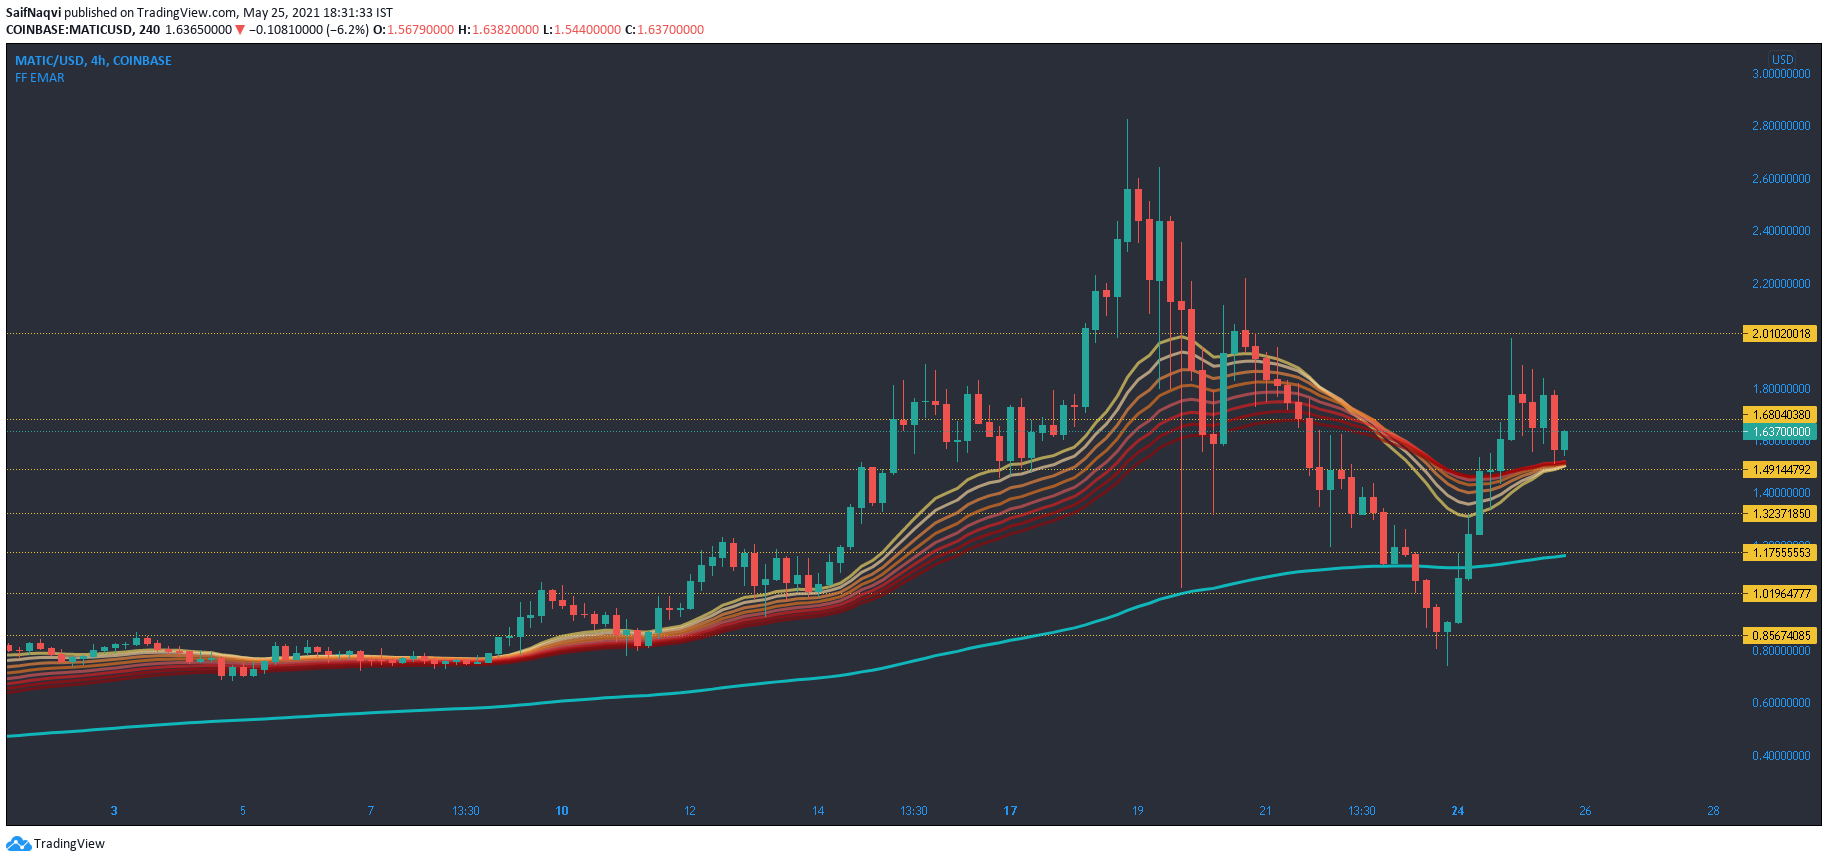
EMA Ribbons were also quite efficient in highlighting minor dips for MATIC’s during its bull run from $0.7 to record highs above $2.8. When used on the 4-hour timeframe, the bands showed a strong buy zone around $1.49. A bounce back from this critical area could fuel a comeback above $2 during the next rally. Conversely, a breakdown would call into action support areas at $1.32 and $1.175 (200-SMA).
RSI did register some southbound movement but remained in bullish territory above 50. A fall below 40 would present the threat of a sharper pullback for MATIC.


