Uniswap’s move beneath recent lows is likely- Here’s why

Disclaimer: The findings of the following analysis are the sole opinions of the writer and should not be considered investment advice.
Uniswap [UNI] has been somewhat volatile recently. The $6 billion market cap asset gained, then lost close to 10% on the price charts within just the past three days.
It appeared to form a range, but the technical indicators on the shorter timeframes did not have a bullish outlook despite a support zone close by. The lack of buying pressure behind UNI can also be attributed to the weakness of Bitcoin in the market.
UNI- 1-Hour Chart
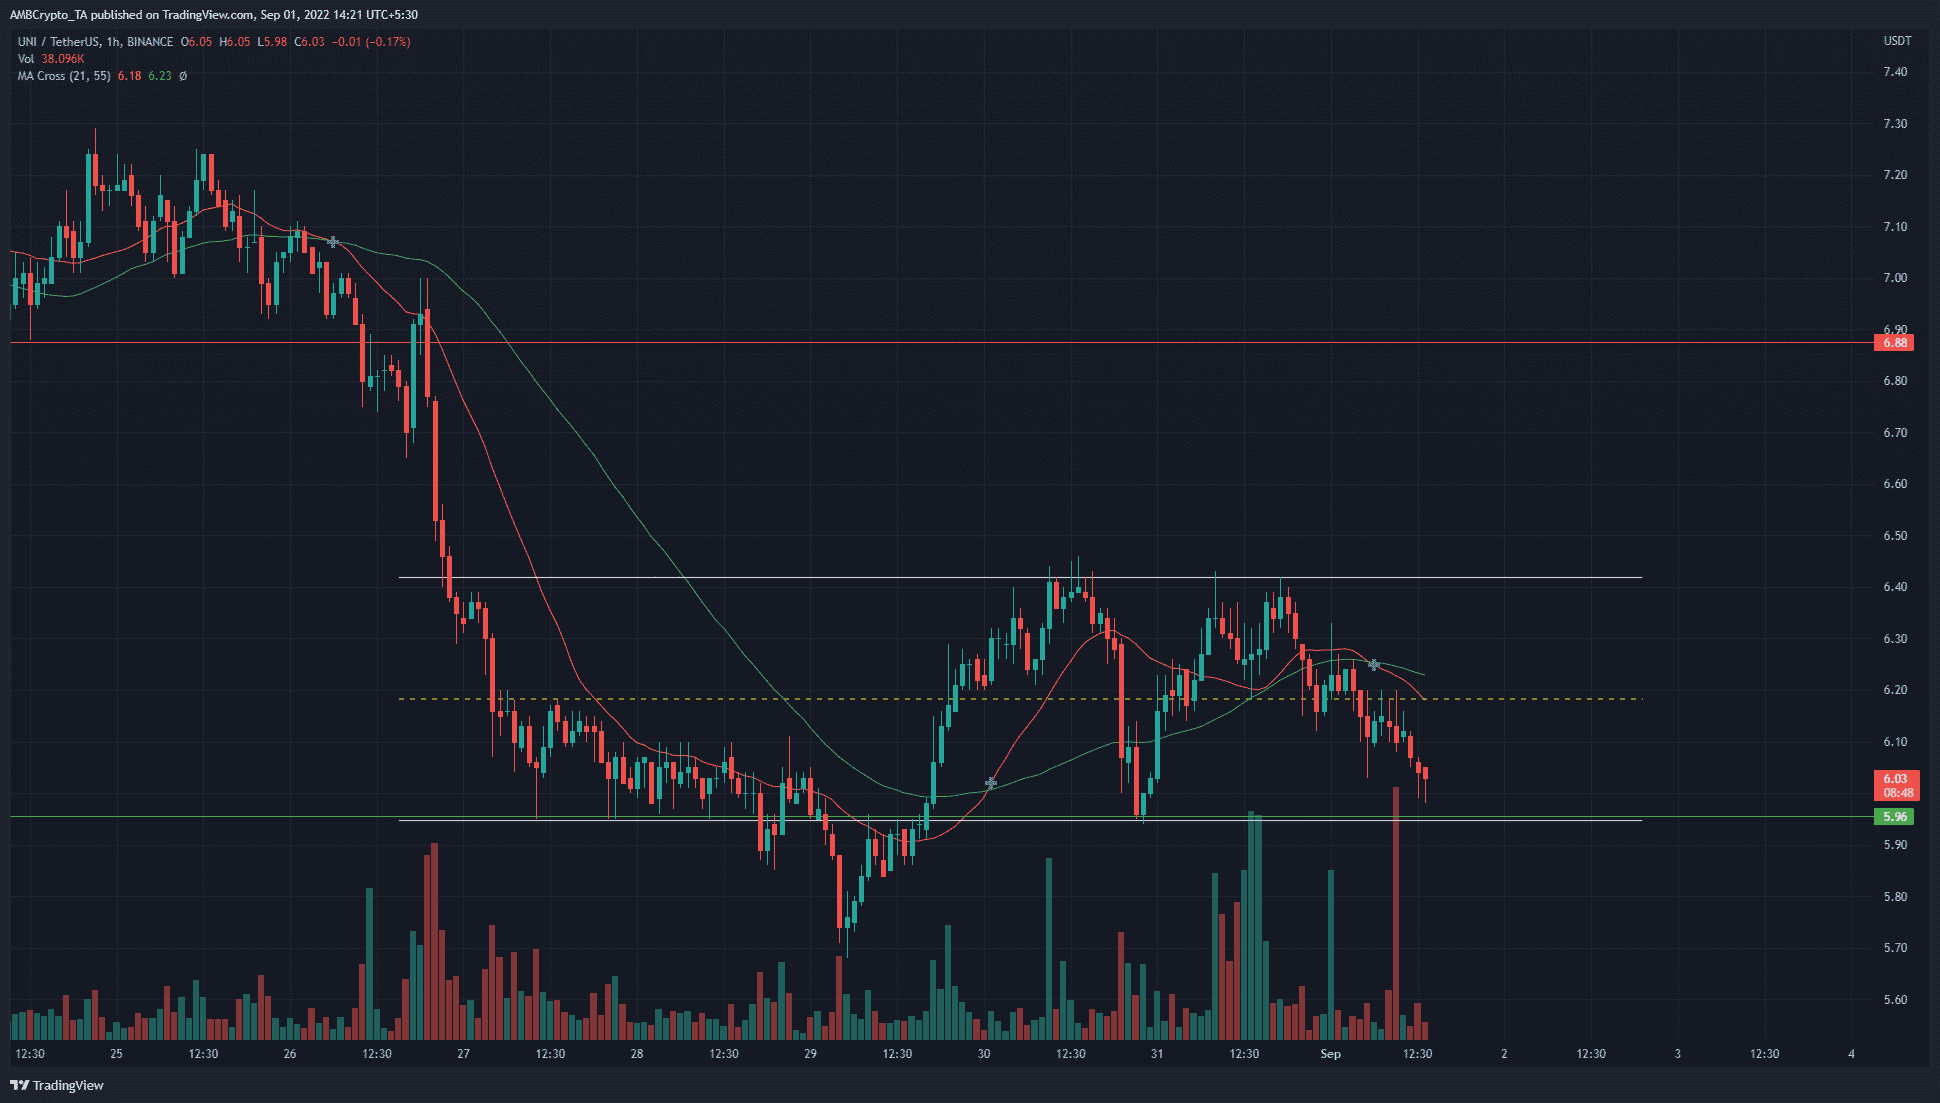
A short-term range was marked in white for Uniswap based on the past few days of trading. The $5.96 support level has been respected, for the most part, over the past week. Yet, there was a sharp deviation to $5.73 followed by a quick bounce to $6.4.
A longer timeframe analysis marked the $5.7-$6 area as a zone of demand for Uniswap. On the shorter timeframes such as the one above, the $6.4 region was observed to be a supply zone. The mid-point of the range lies at $6.18 and has served as support and resistance recently.
This added credibility to the range plotted in white. Traders can look to buy the range lows at $5.95-$6 but would need to set a tight stop-loss if they anticipate a bounce.
However, the 21-period and 55-period moving averages (green and orange respectively) formed a bearish crossover and can act as resistances should the price decide to move higher.
Rationale
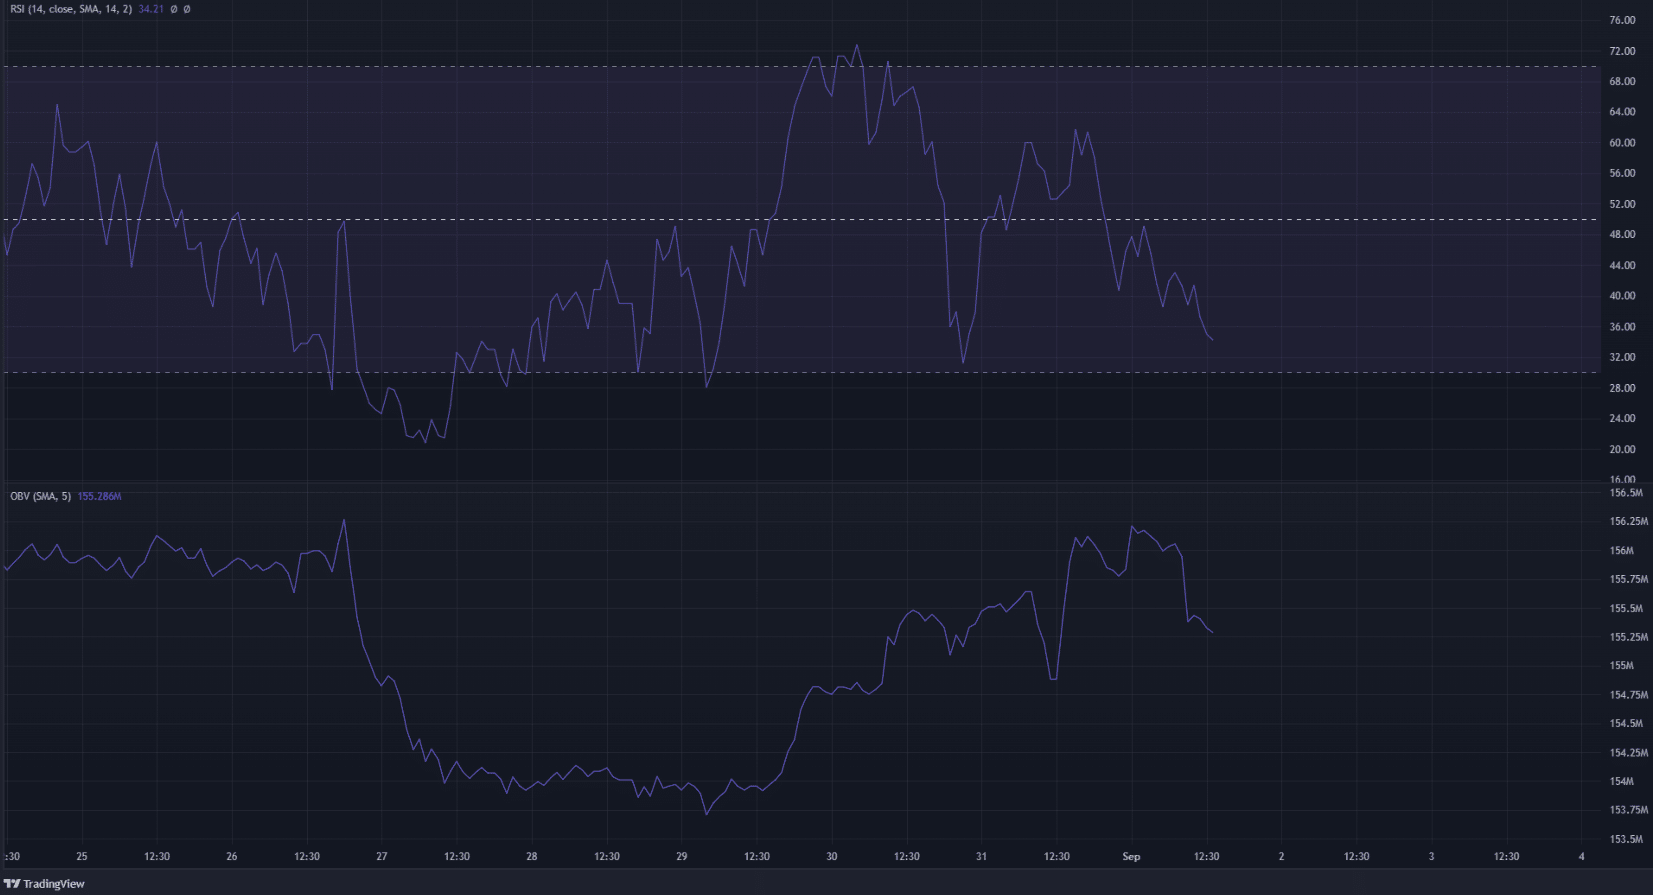
The Relative Strength Index (RSI) fell beneath neutral 50 to show that momentum on the hourly chart has oscillated toward the bearish side. Moreover, the RSI has set a series of lower lows in the past couple of days. This hinted at mounting bearish momentum.
Hence, a move toward $5.95 was likely. Yet, it was unclear whether UNI would drop further.
The On-Balance Volume (OBV) has climbed in the past few days. Unlike the RSI, the OBV set higher lows. This suggested strong buying pressure and a notable lack of selling. Therefore, buying a dip to $5.95-$6 could bring a profit as a move back to $6.4 could materialize on the back of strong demand.
Conclusion
Bitcoin was trading at a significant area of support at press time, and lower timeframe charts were inherently volatile and tricky. Risk-averse traders might want to wait for clearer conditions. More risk-loving traders can look to long the $5.95-$6 area, with a stop-loss just below $5.9.


