Unraveling the implications of still HODLing NEAR

Disclaimer: The findings of the following analysis are the sole opinions of the writer and should not be considered investment advice.
NEAR’s devaluation over the last 10 weeks pulled the alt to find fresher multi-monthly lows on its chart. The bears have kept the alt under the constraints of its 20 EMA (red) ever since.
With an eventual bounce-back from the Point of Control (POC), a sustained revival could test the upper trendline of the falling wedge (white). At press time, NEAR was trading at $3.452, up by 6.76% in the last 24 hours.
NEAR Daily Chart
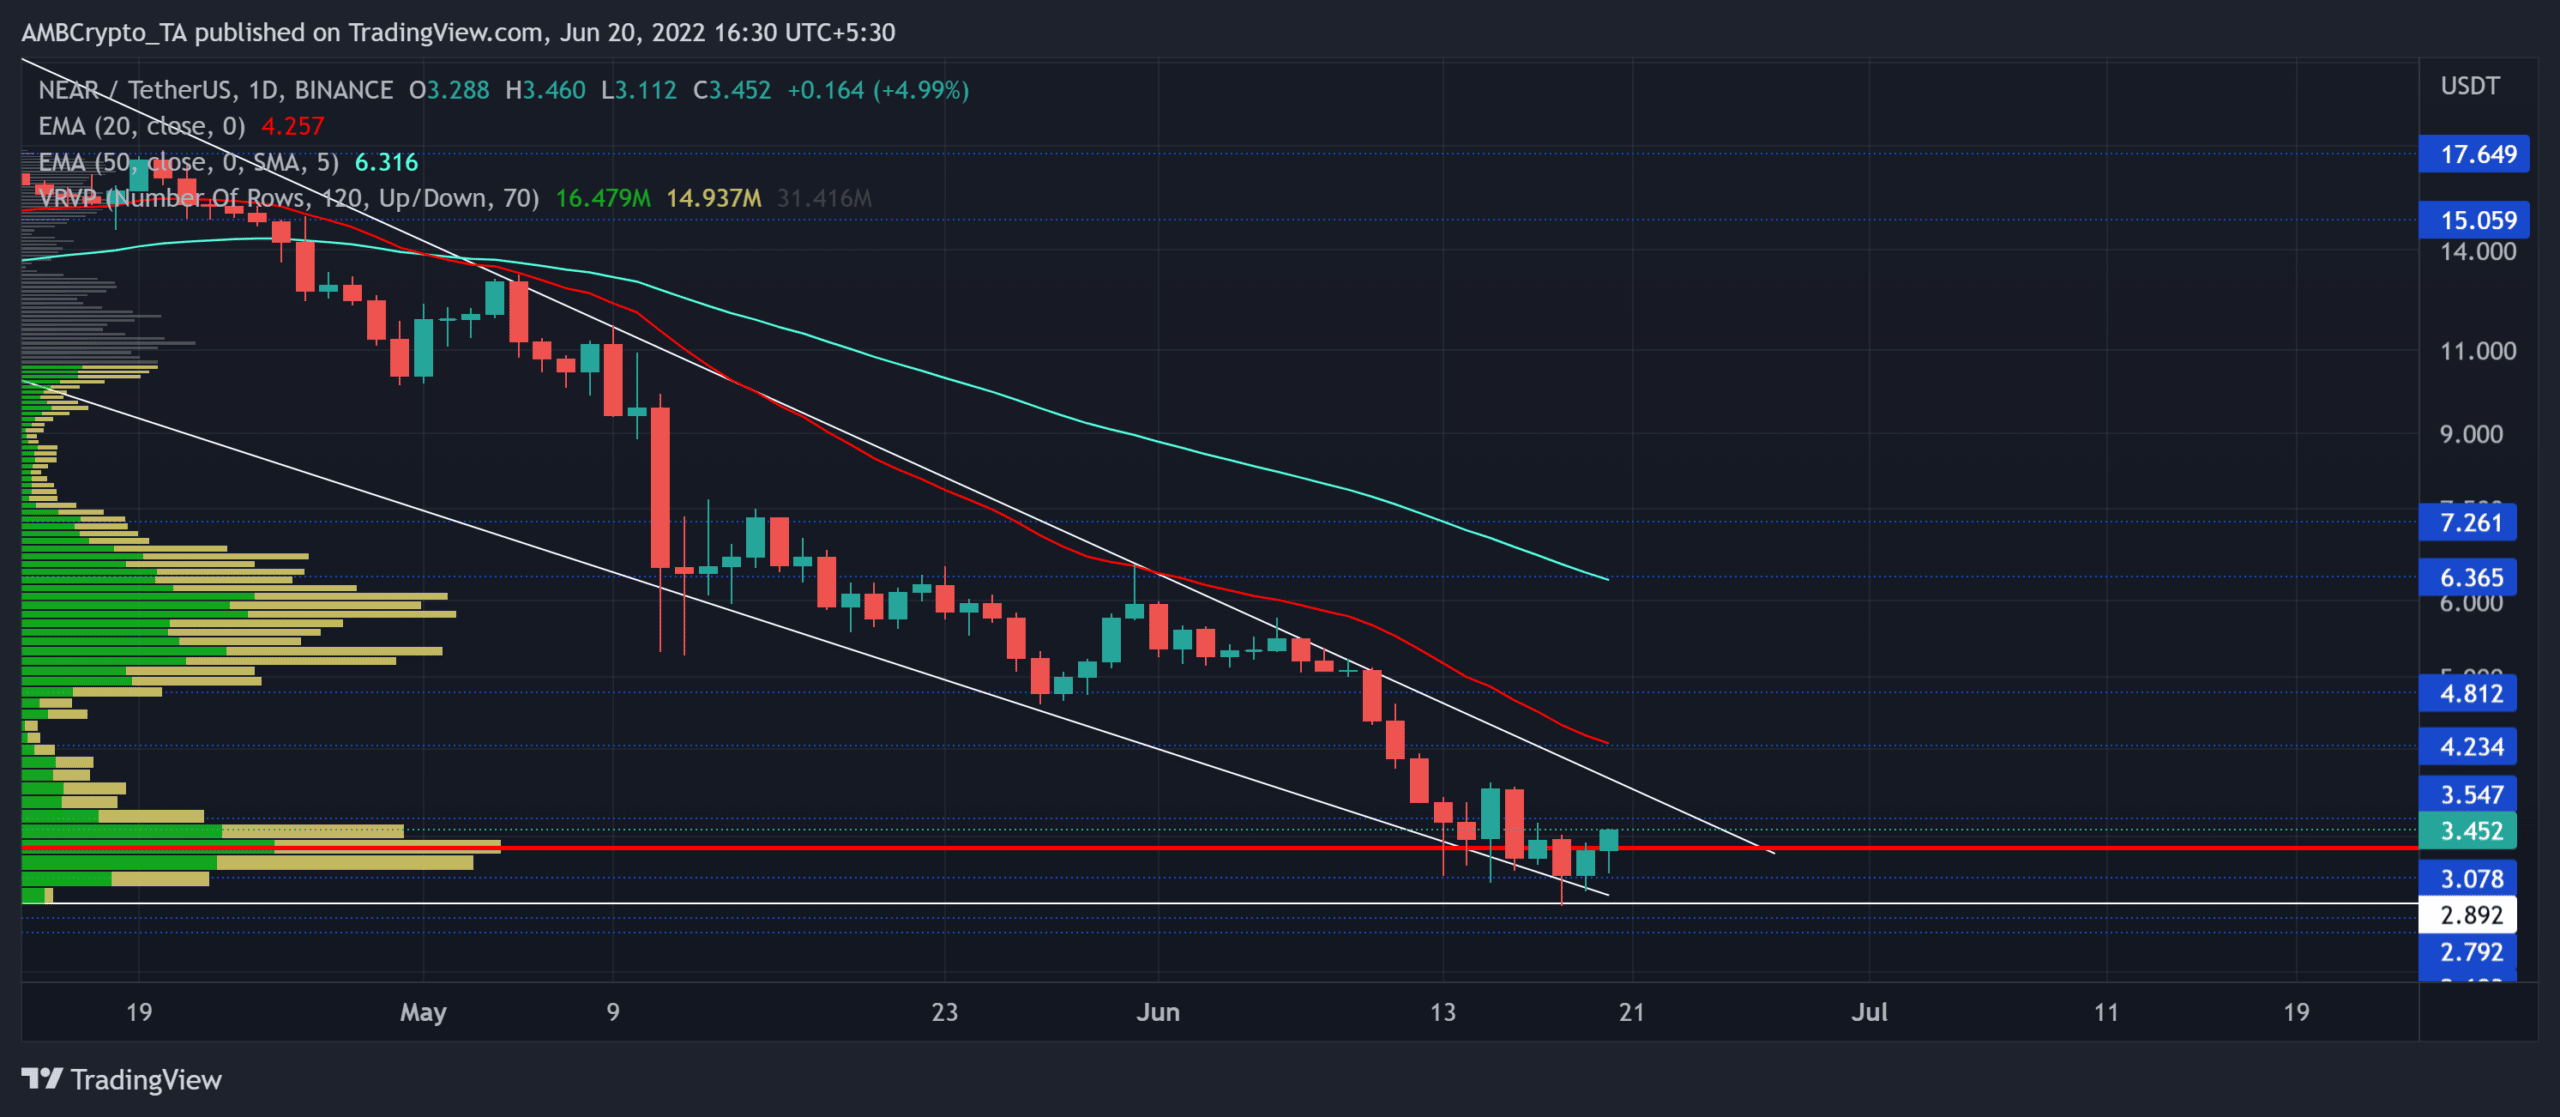
Since losing the $15-mark, the sellers have pulled off a consistent streak of bearish engulfing candlesticks over the last two months.
NEAR lost over 83% of its value from 20 April and plunged towards its ten-month low on 18 June. The bounds of the falling wedge have led NEAR into a squeeze phase towards the POC zone.
With the 20 EMA and the 50 EMA (cyan) still looking south, the sellers undeniably exhibited their edge. However, the gap between these two lines had over-extended. A possible revival may be due in the coming sessions, provided the buyers can ramp up the volumes.
A convincing close beyond the POC would help NEAR test the upper trendline of the wedge near the $3.8-zone. A robust break above the pattern could help buyers test the $4.2-$4.8 range. However, a likely reversal from the upper trendline can extend the tight phase near the POC level.
Rationale
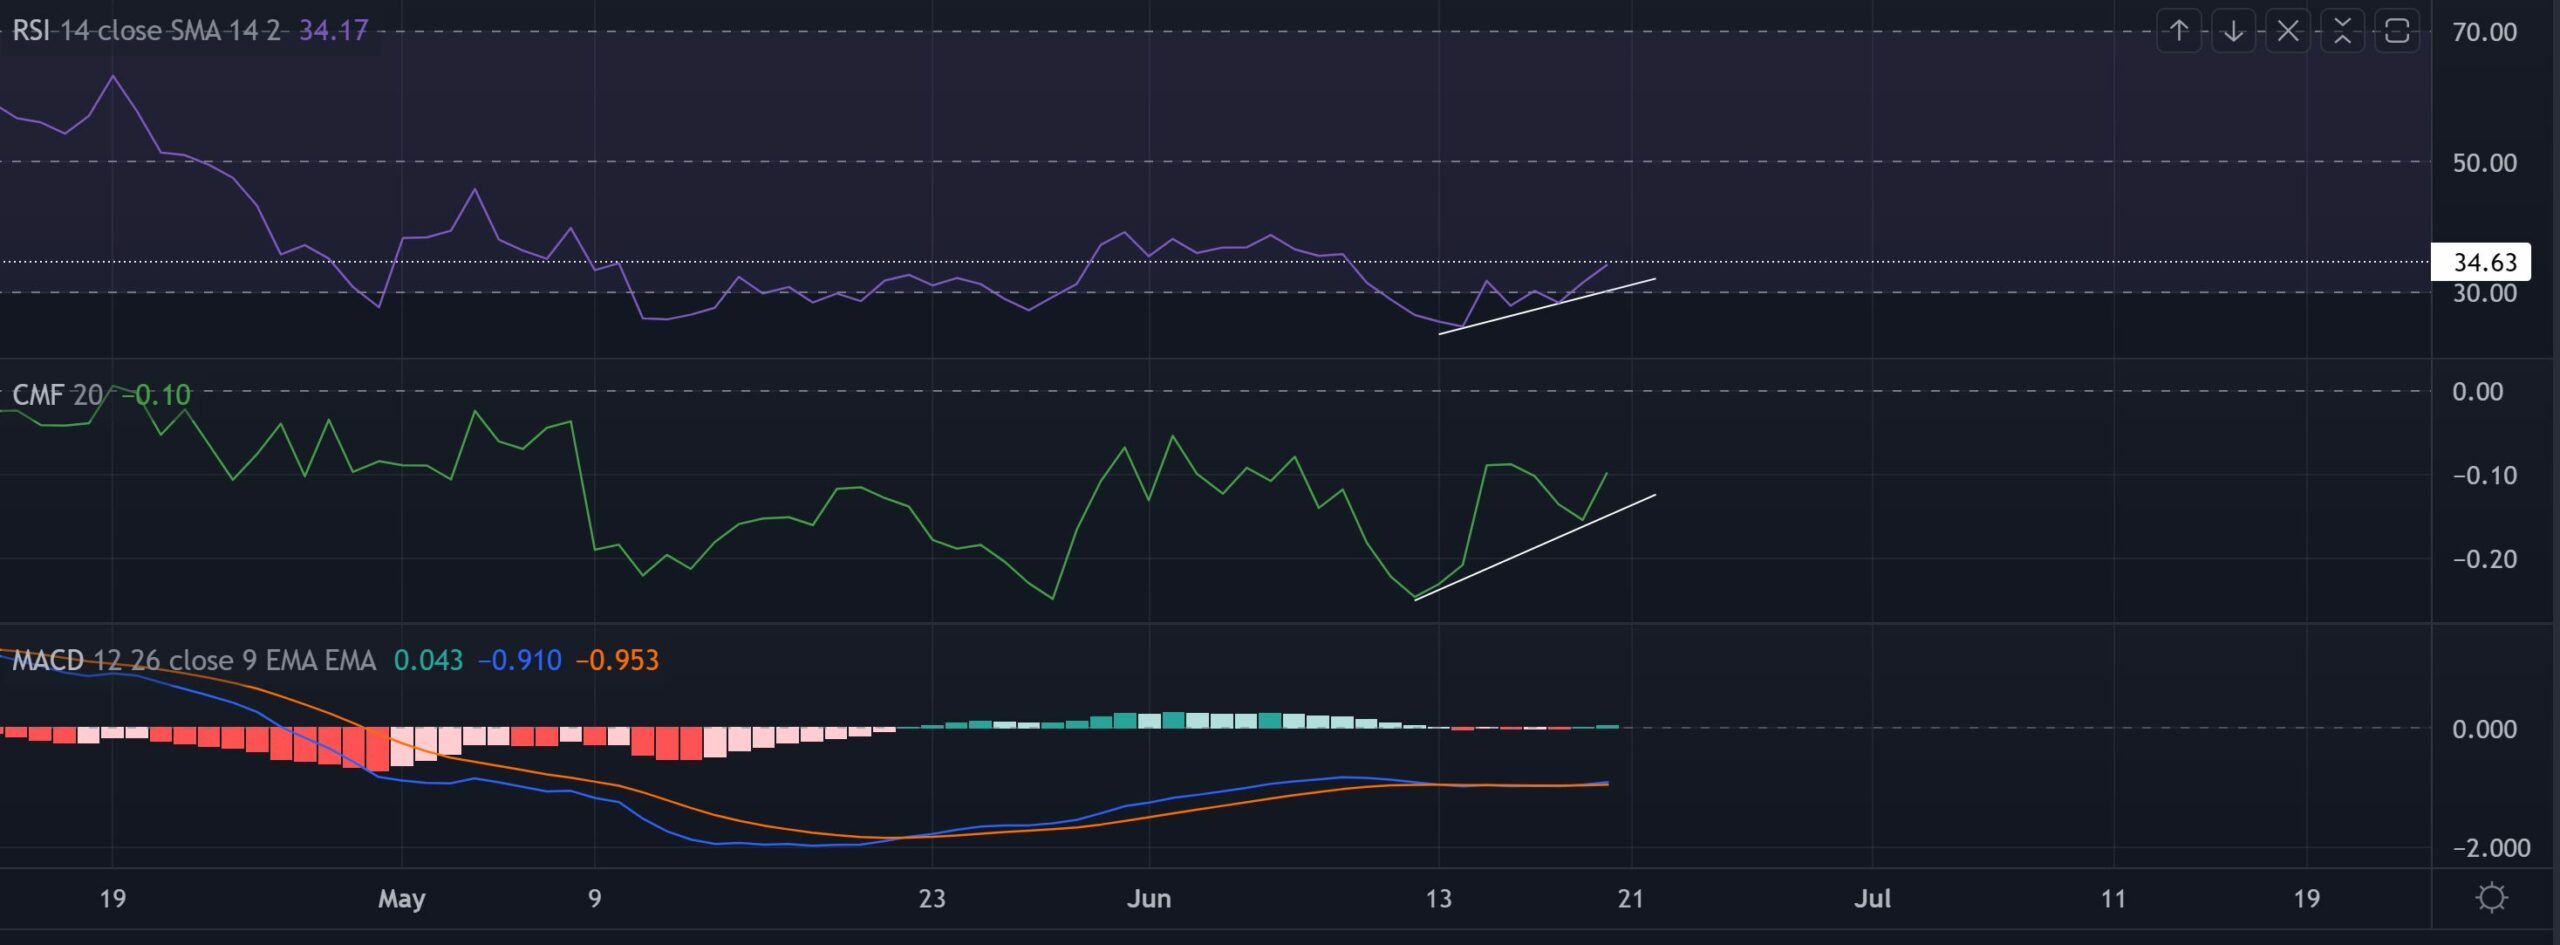
The bearish Relative Strength Index (RSI) saw a slight growth from the oversold region. An eventual break beyond the 34-level would open doorways for further recovery. Also, the recent higher troughs on the index bullishly diverged with the price action.
Similarly, the CMF saw a slight uptick whilst affirming a bullish divergence on its troughs. However, the MACD lines were yet to confirm a bullish edge while they still swayed below the zero-mark.
Conclusion
In view of the bullish divergence on the RSI and CMF, NEAR would aim to test the sturdiness of the upper trendline of the wedge in the $3.8-zone. Any close above the pattern would help the buyers test the 20 EMA before a likely reversal.
Finally, investors/traders must keep a close eye on Bitcoin’s movement affecting market dynamics to make a profitable move.


