Up by >160% in a day, can Zilliqa go higher in search of liquidity

Disclaimer: The findings of the following analysis are the sole opinions of the writer and should not be considered investment advice
For over nine months, Zilliqa (ZIL) has faced resistance at the $0.12-mark whilst dropping down towards the $0.03-level in late February. Its latest rally saw staggering gains as it jumped above its 20/50/200 EMA.
Now, a close below the $0.1-mark could lead ZIL to test its demand zone before finding a testing point near its 20 EMA (red). After the most recent bearish divergence with its RSI, further retracements could see a setback towards the $0.09-zone should the bulls fail to defend the immediate support.
At press time, ZIL was trading at $0.10358, up by 19.62% in the last 24 hours.
ZIL 4-hour Chart
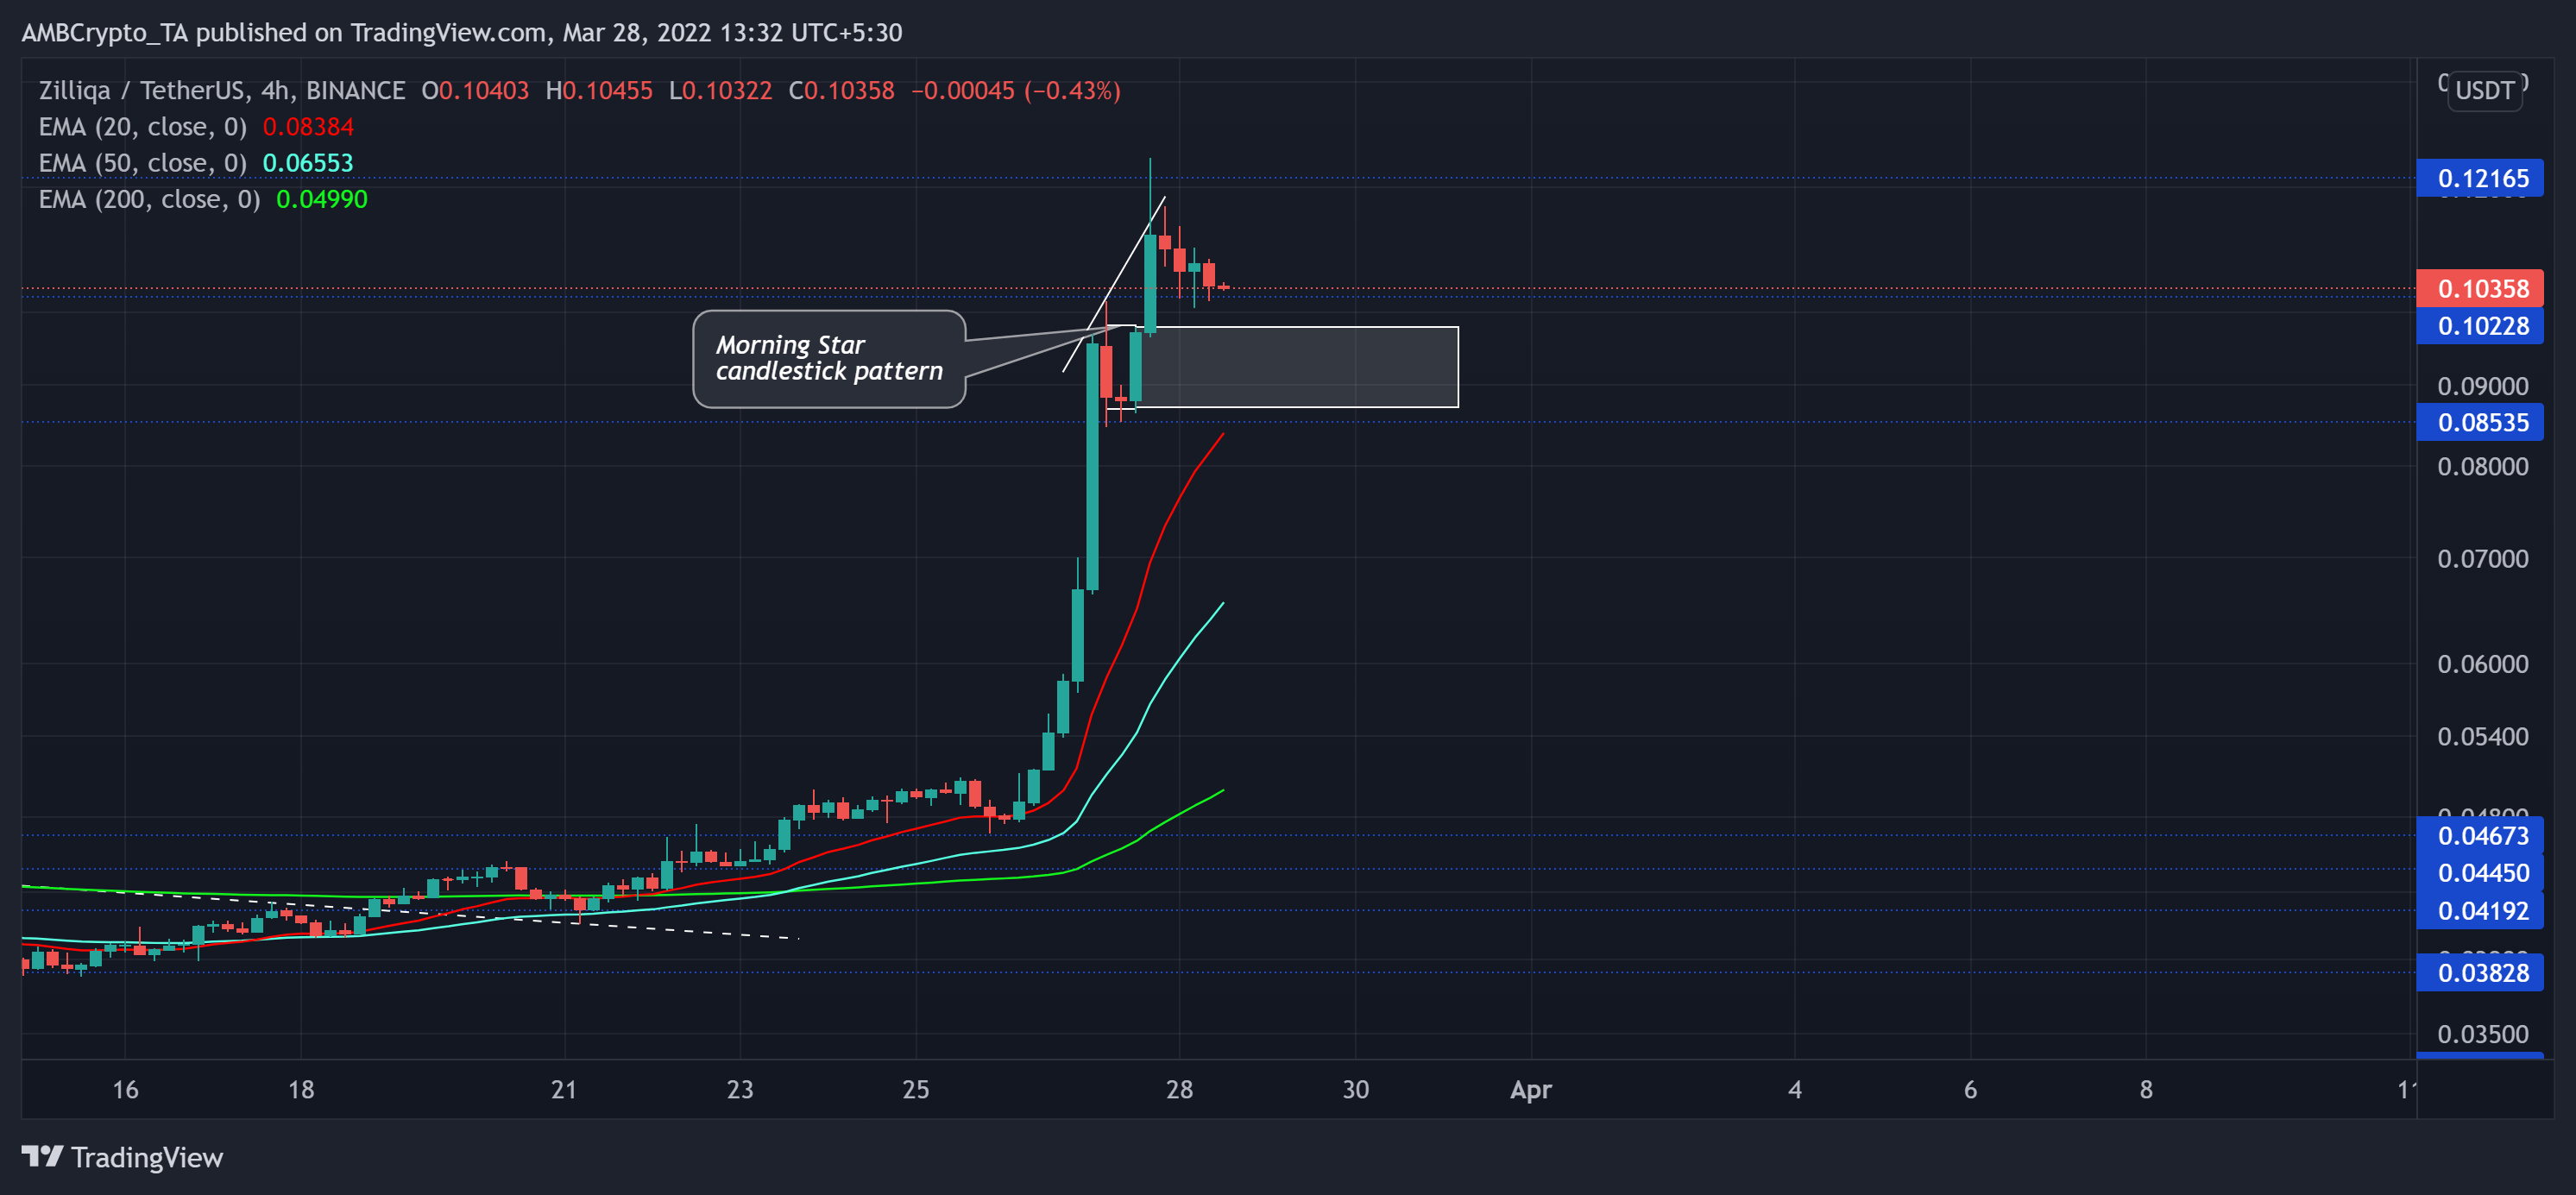
Since the beginning of the year, the altcoin had been on a steep descent. One that marked a trendline resistance (white, dashed). ZIL lost over 60% of its value (from 27 December) and plunged towards its 14-month low on 24 February.
With its newly announced Metaverse project, the alt saw unrestrained recovery over the last 24 hours. As a result, it registered a whopping 162.8% ROI between 26 and 27 March. While jumping above its EMAs, ZIL formed a morning star candlestick pattern. The bullish engulfing candlestick also fueled a demand zone in the $0.08-$0.09 range.
From here on, if the sellers fail to counter the buying spree, bulls will continue to ensure the $0.1-level. Any fall below this level would open up chances to test the $0.08-mark or the 20 EMA. Following this, the bulls could take advantage of the overall sentiment and continue their endeavour to snap the $0.12 long-term resistance.
Rationale
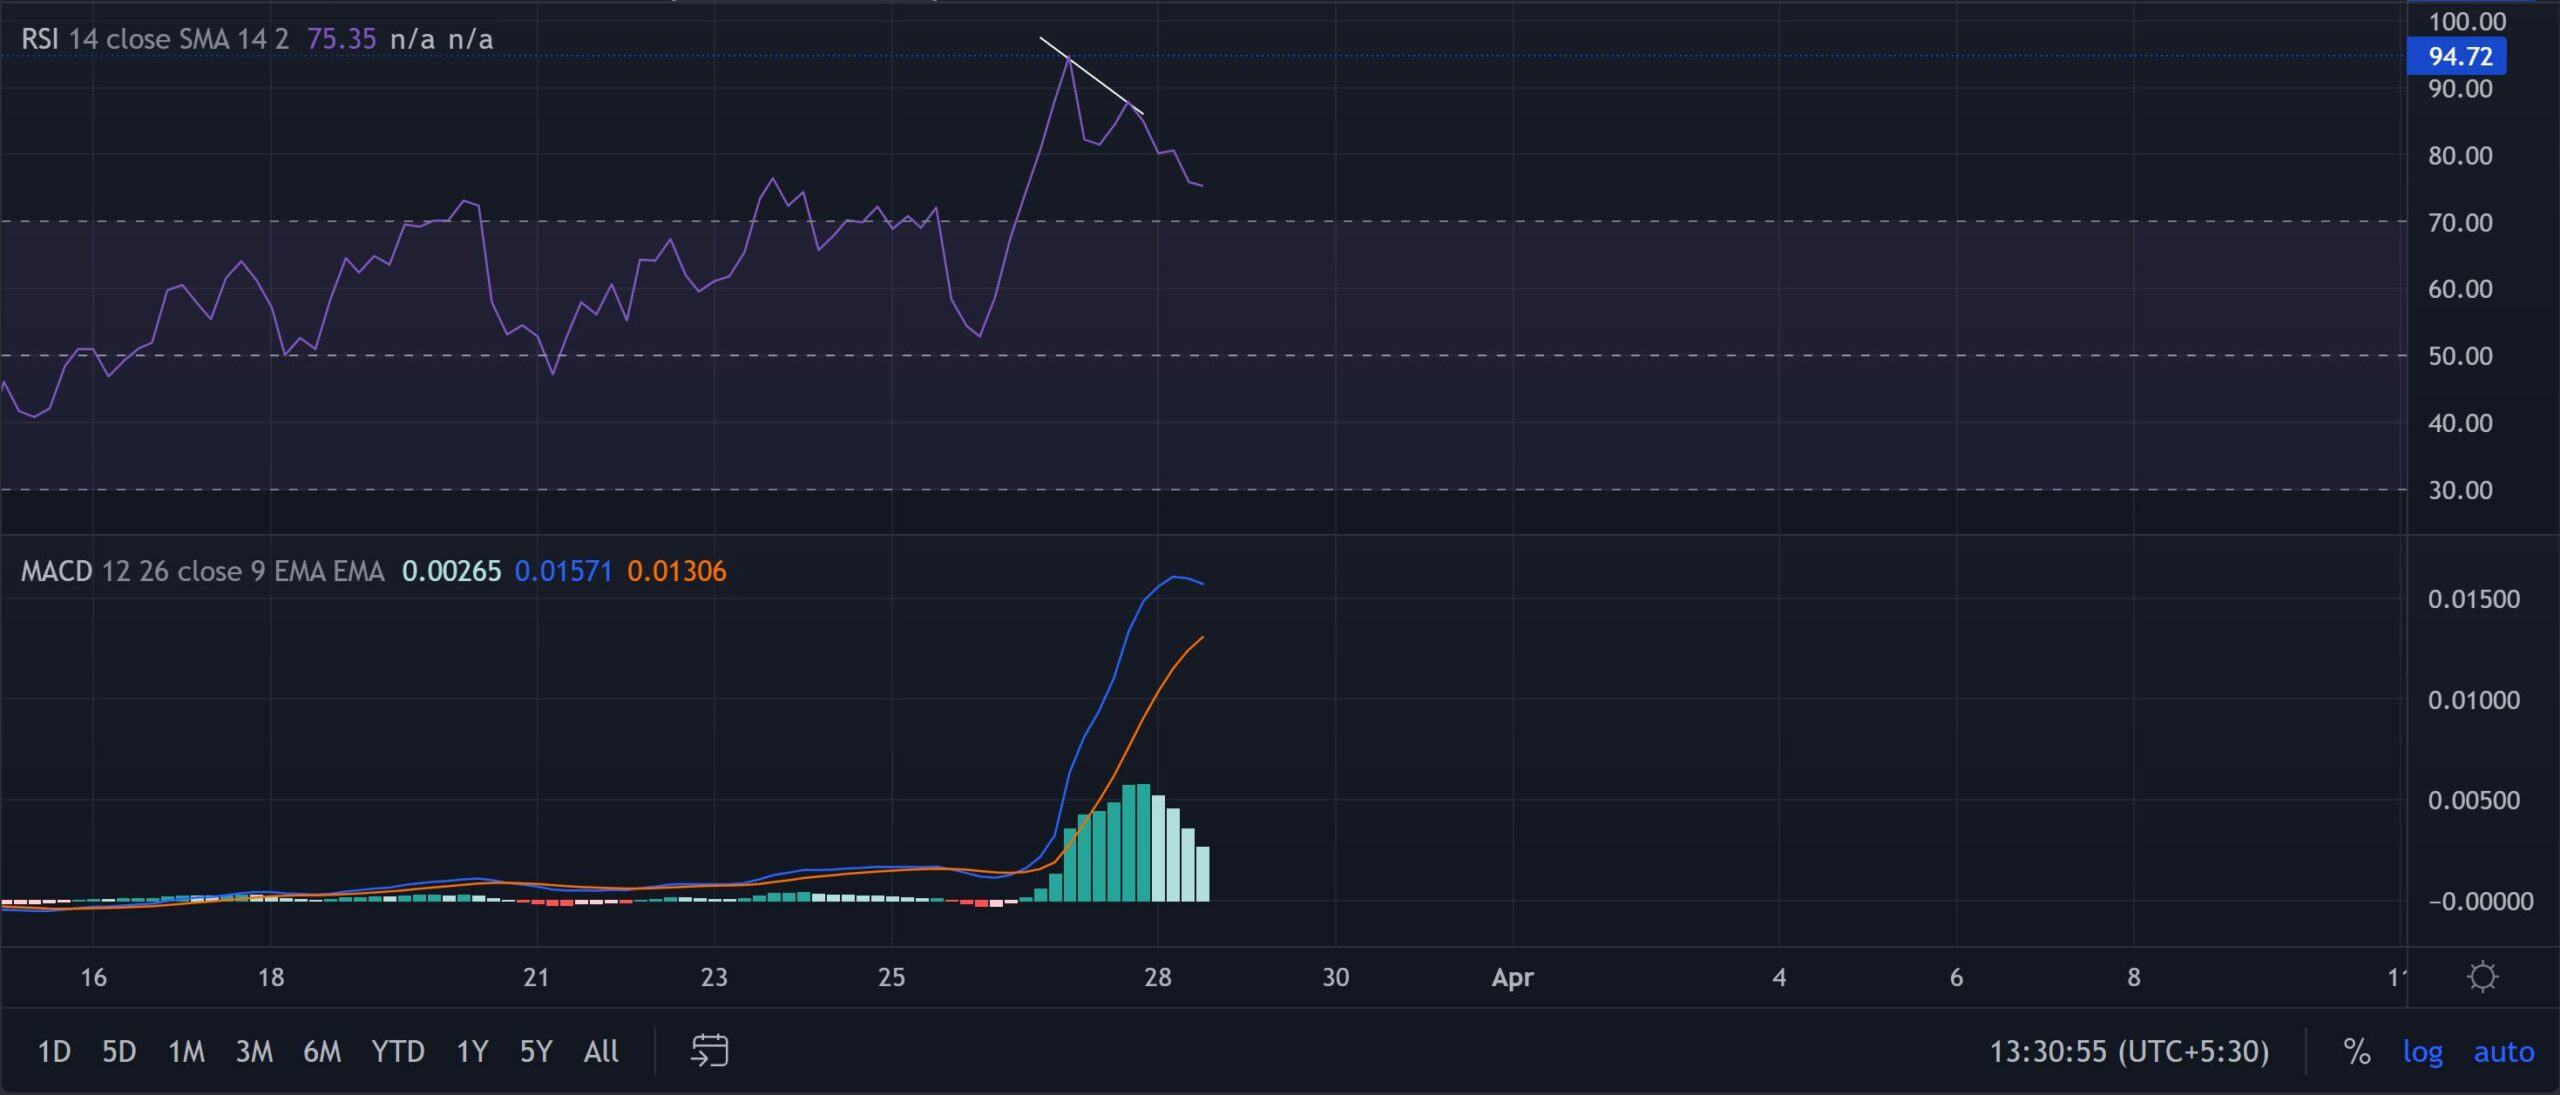
The RSI touched its record high at the 94-mark as ZIL entered a substantially overbought position on 27 March. Since then, it has seen an expected downturn while observing lower peaks. After a recent bearish divergence with the price, it could see a further pullback towards the 70-mark.
The overstretched gap between the MACD lines favoured the bulls and could justify the bullish movements in the near term. Going forward, a potential tight phase could slow down the bullish momentum.
Conclusion
Considering the sizeable overbought position on its RSI and MACD, ZIL could see a near-term setback towards its demand zone. Should the bulls continue to capitalize on the sentiment, the 20 EMA would assume support for its sustained upturn in the coming days.
Besides, investors/traders must keep a close watch on Bitcoin’s movement affecting the overall perception of the market.