VeChain, Ethereum Classic, MATIC Price Analysis: 22 May

VeChain targeted a rise above $0.015 to flip bear market conditions. A number of factors contributed to Ethereum Classic’s 77% loss in value in just two weeks. Finally, MATIC’s bull run could depend on a rise above $1.77-resistance.
VeChain [VET]
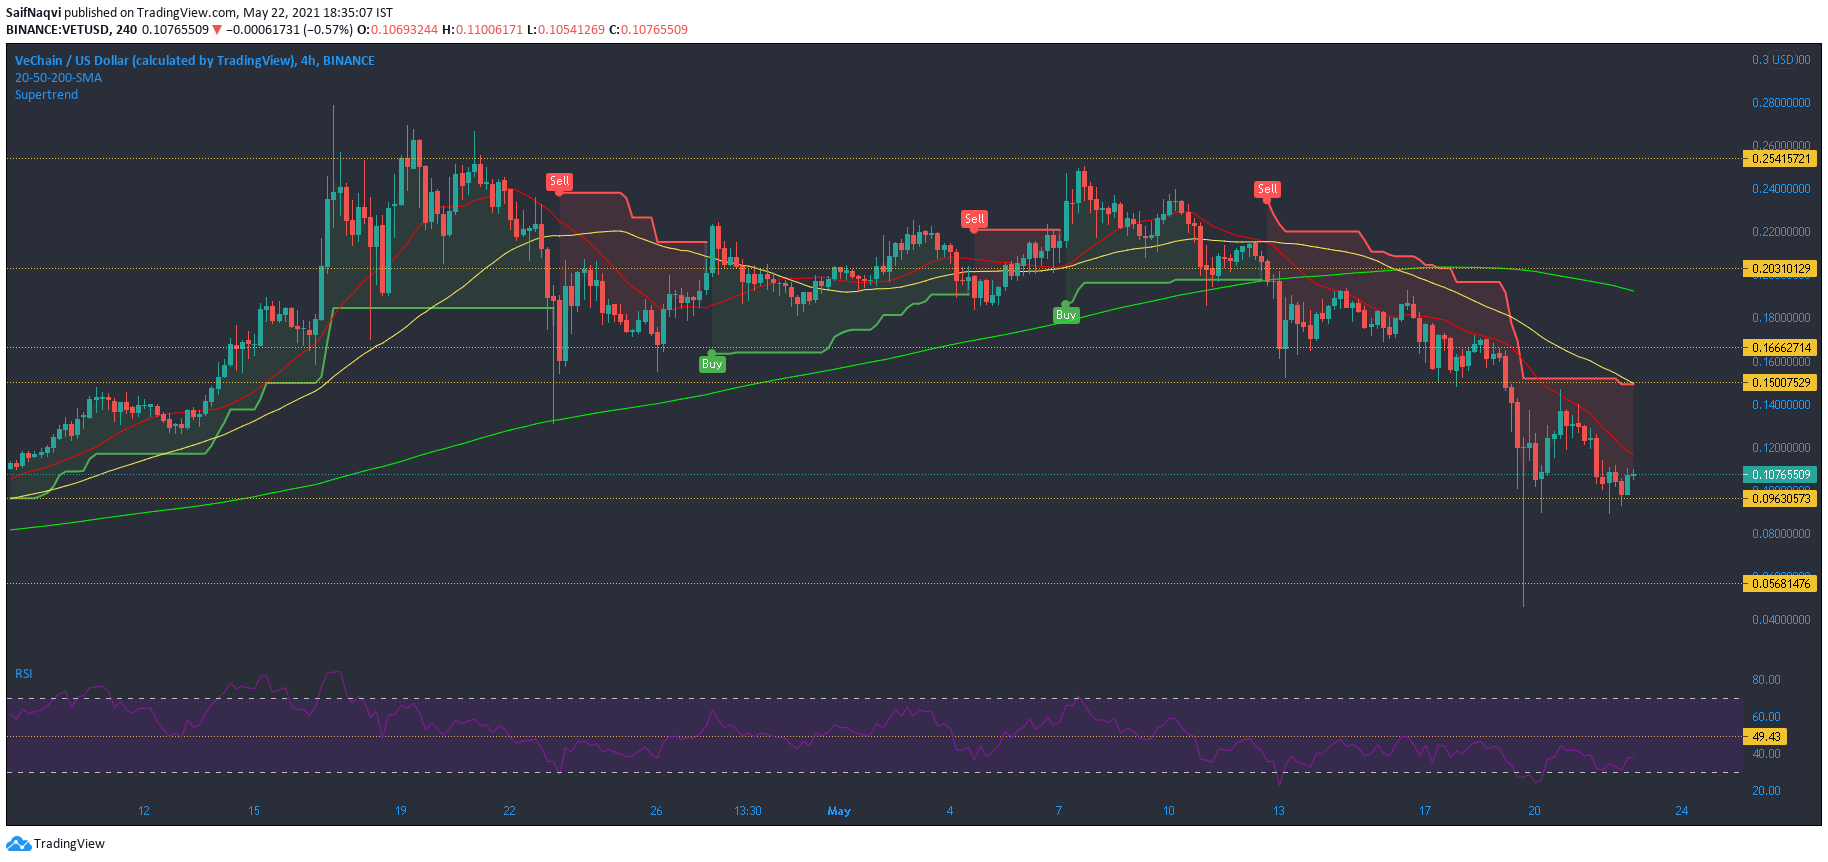
VeChain saw a 31% price hike during the rapid buy phase on May 20 but retraced back to $0.096 after investors locked in their profits. On the 4-hour chart, VET traded below its 20-SMA (red) which acted as a resistance line. Even in case of a breakout, gains would likely be limited to $0.015 and 50-SMA (yellow). The Supertrend Indicator also placed a buy signal at this mark.
However, market dynamics would shift in favor of bulls in case of a break above $0.015. This would open the doors for a 26% rally towards the 200-SMA at $0.19. On RSI, traders should be on the lookout for a break above 49-50 as this could trigger a bullish reversal.
Ethereum Classic [ETC]
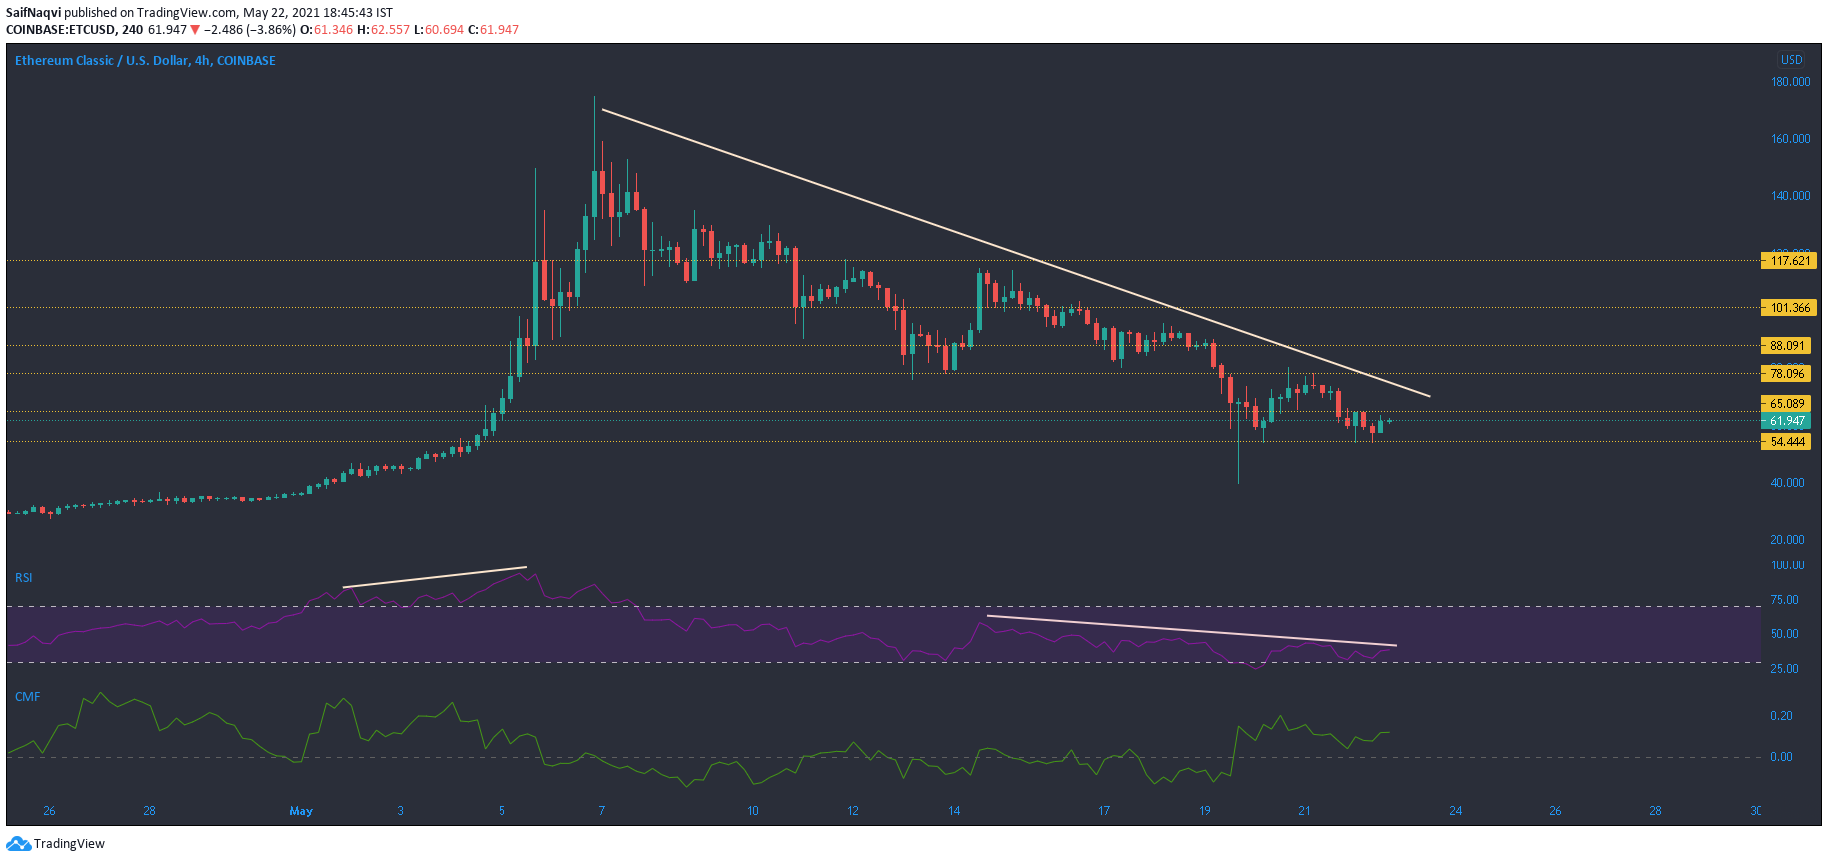
Ethereum Classic’s high of $175 to a low of $39.62 represented losses of 77.6% in just about two weeks. Several developments led to this downwards spiral. Bearish divergence on ETC’s previous bull indicated weakening, while a descending triangle breakdown (not shown) resulted in a sharp sell-off. The recent crypto-dump only accentuated losses over the last couple of days. A region of support was found at $54.4 but a breakout above $65 seemed unlikely over the short term.
RSI traded in bearish territory but a rise above the upper sloping trendline could trigger a swift bounce back. However, strong capital inflows according to CMF could be the key to avoid another dip.
MATIC
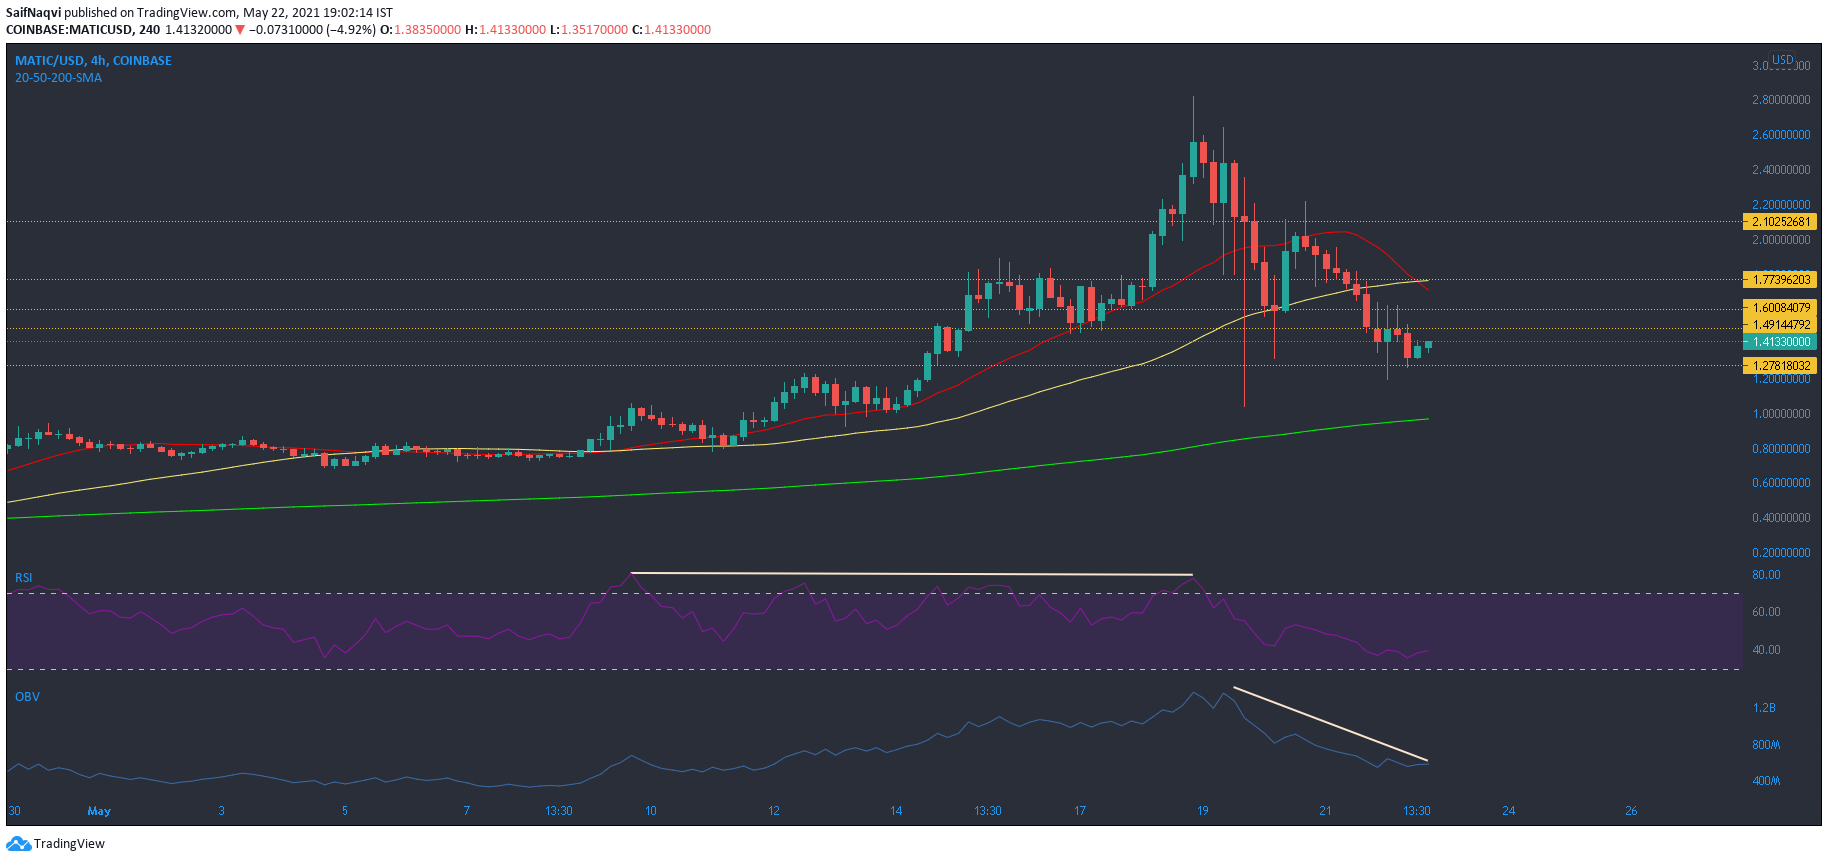
Since MATIC was one of the premier alts during the rapid buy phase on May 20, its retracement over the last 24 hours was quite a surprise. This period saw MATIC drop from a high of $2.2 to a low of $1.26. Losses were finally cushioned around this level and some buying was noted on the 4-hour chart.
A key area lay above $1.77 and a breakout could trigger another price hike. Coincidently, this zone also clashed with the 20-SMA (red) and 50-SMA (yellow). Prior to the recent crypto sell-off, MATIC’s RSI touched overbought zone multiple times and a correction was overdue. OBV’s downtrend suggested profit taking after steady buying between April 26-May 18.


