VeChain, Tezos, EOS Price Analysis: 23 January

While the latest market crash shed off over $400 billion in just two days, VeChain, Tezos, and EOS hit their multi-month lows on 22 January.
Over the past few hours, these cryptos have recovered somewhat from their long-term supports. However, to propel sustained recovery, the bulls still need more volumes and money inflows.
VeChain (VET)
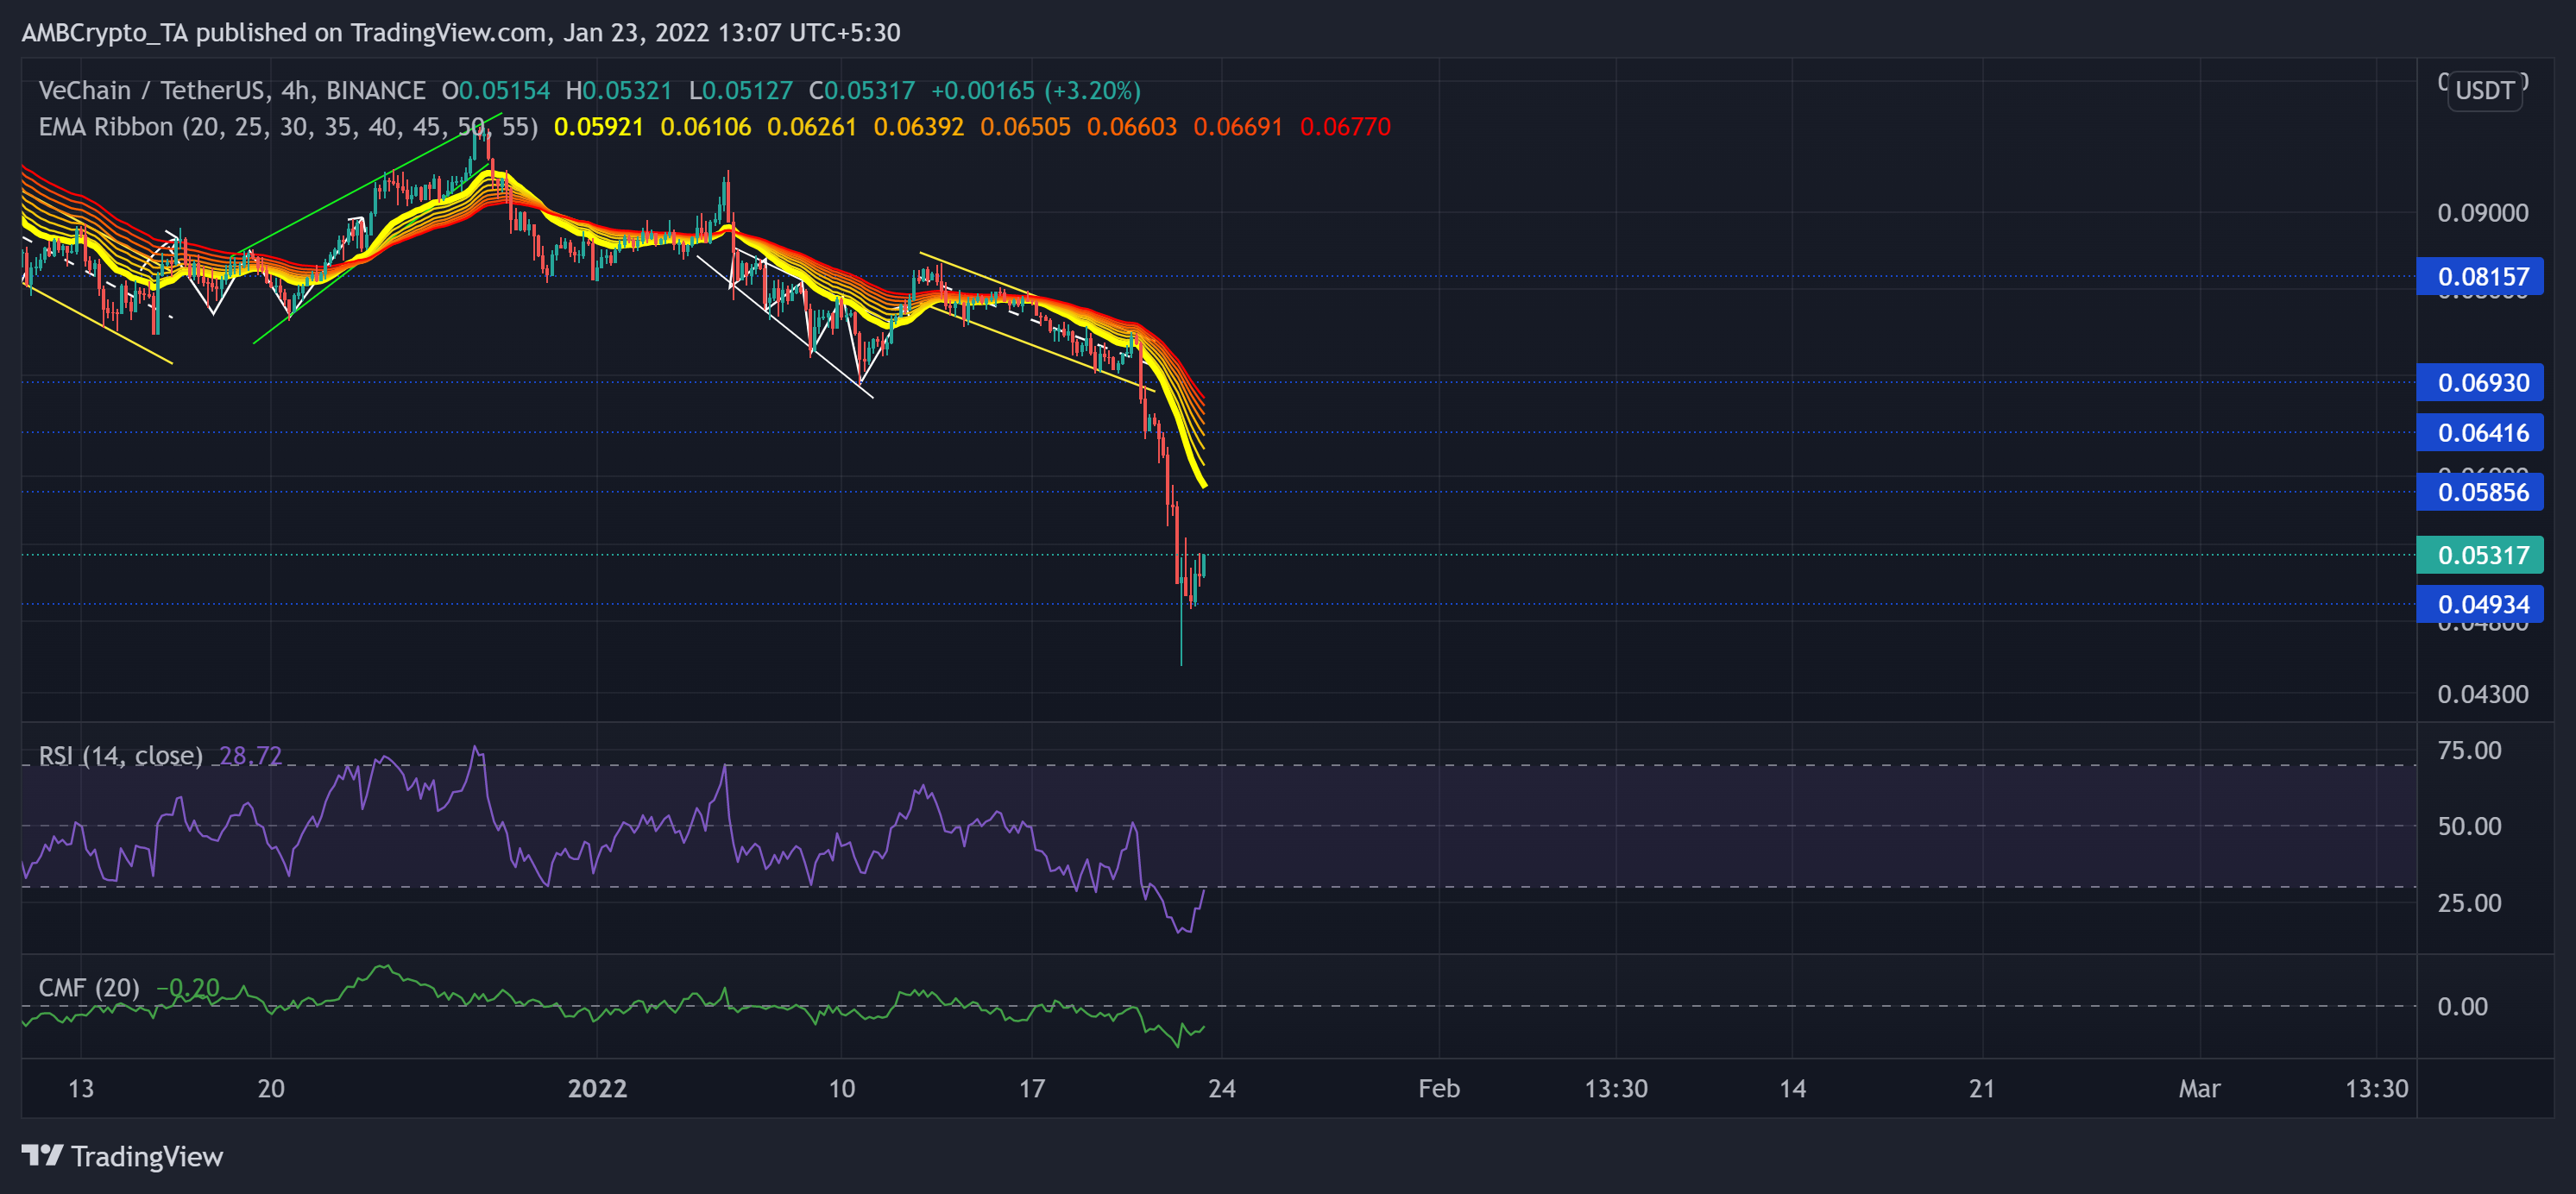
While the $0.08 resistance stood as a tough hurdle, VET oscillated in a down-channel (yellow). Following the same, the broader sell-off led to a further breakdown. The alt lost 41.23% of its value (from 20 January) and hit its 46-week low on 22 January.
The bulls even failed to defend the $0.05856-mark resistance (previous support). As a result, the price fell below all its EMA ribbons. As the gap between the ribbons widened, the selling power undeniably prevailed. Now, the testing point for the bulls stood at the $0.05856-level that coincided with the 20-EMA.
At press time, VET was at $0.05317. The bearish RSI needed to find a close above the oversold region to make way for a recovery. The CMF skewed in favor of the sellers but displayed improvement signs over the past day.
Tezos (XTZ)
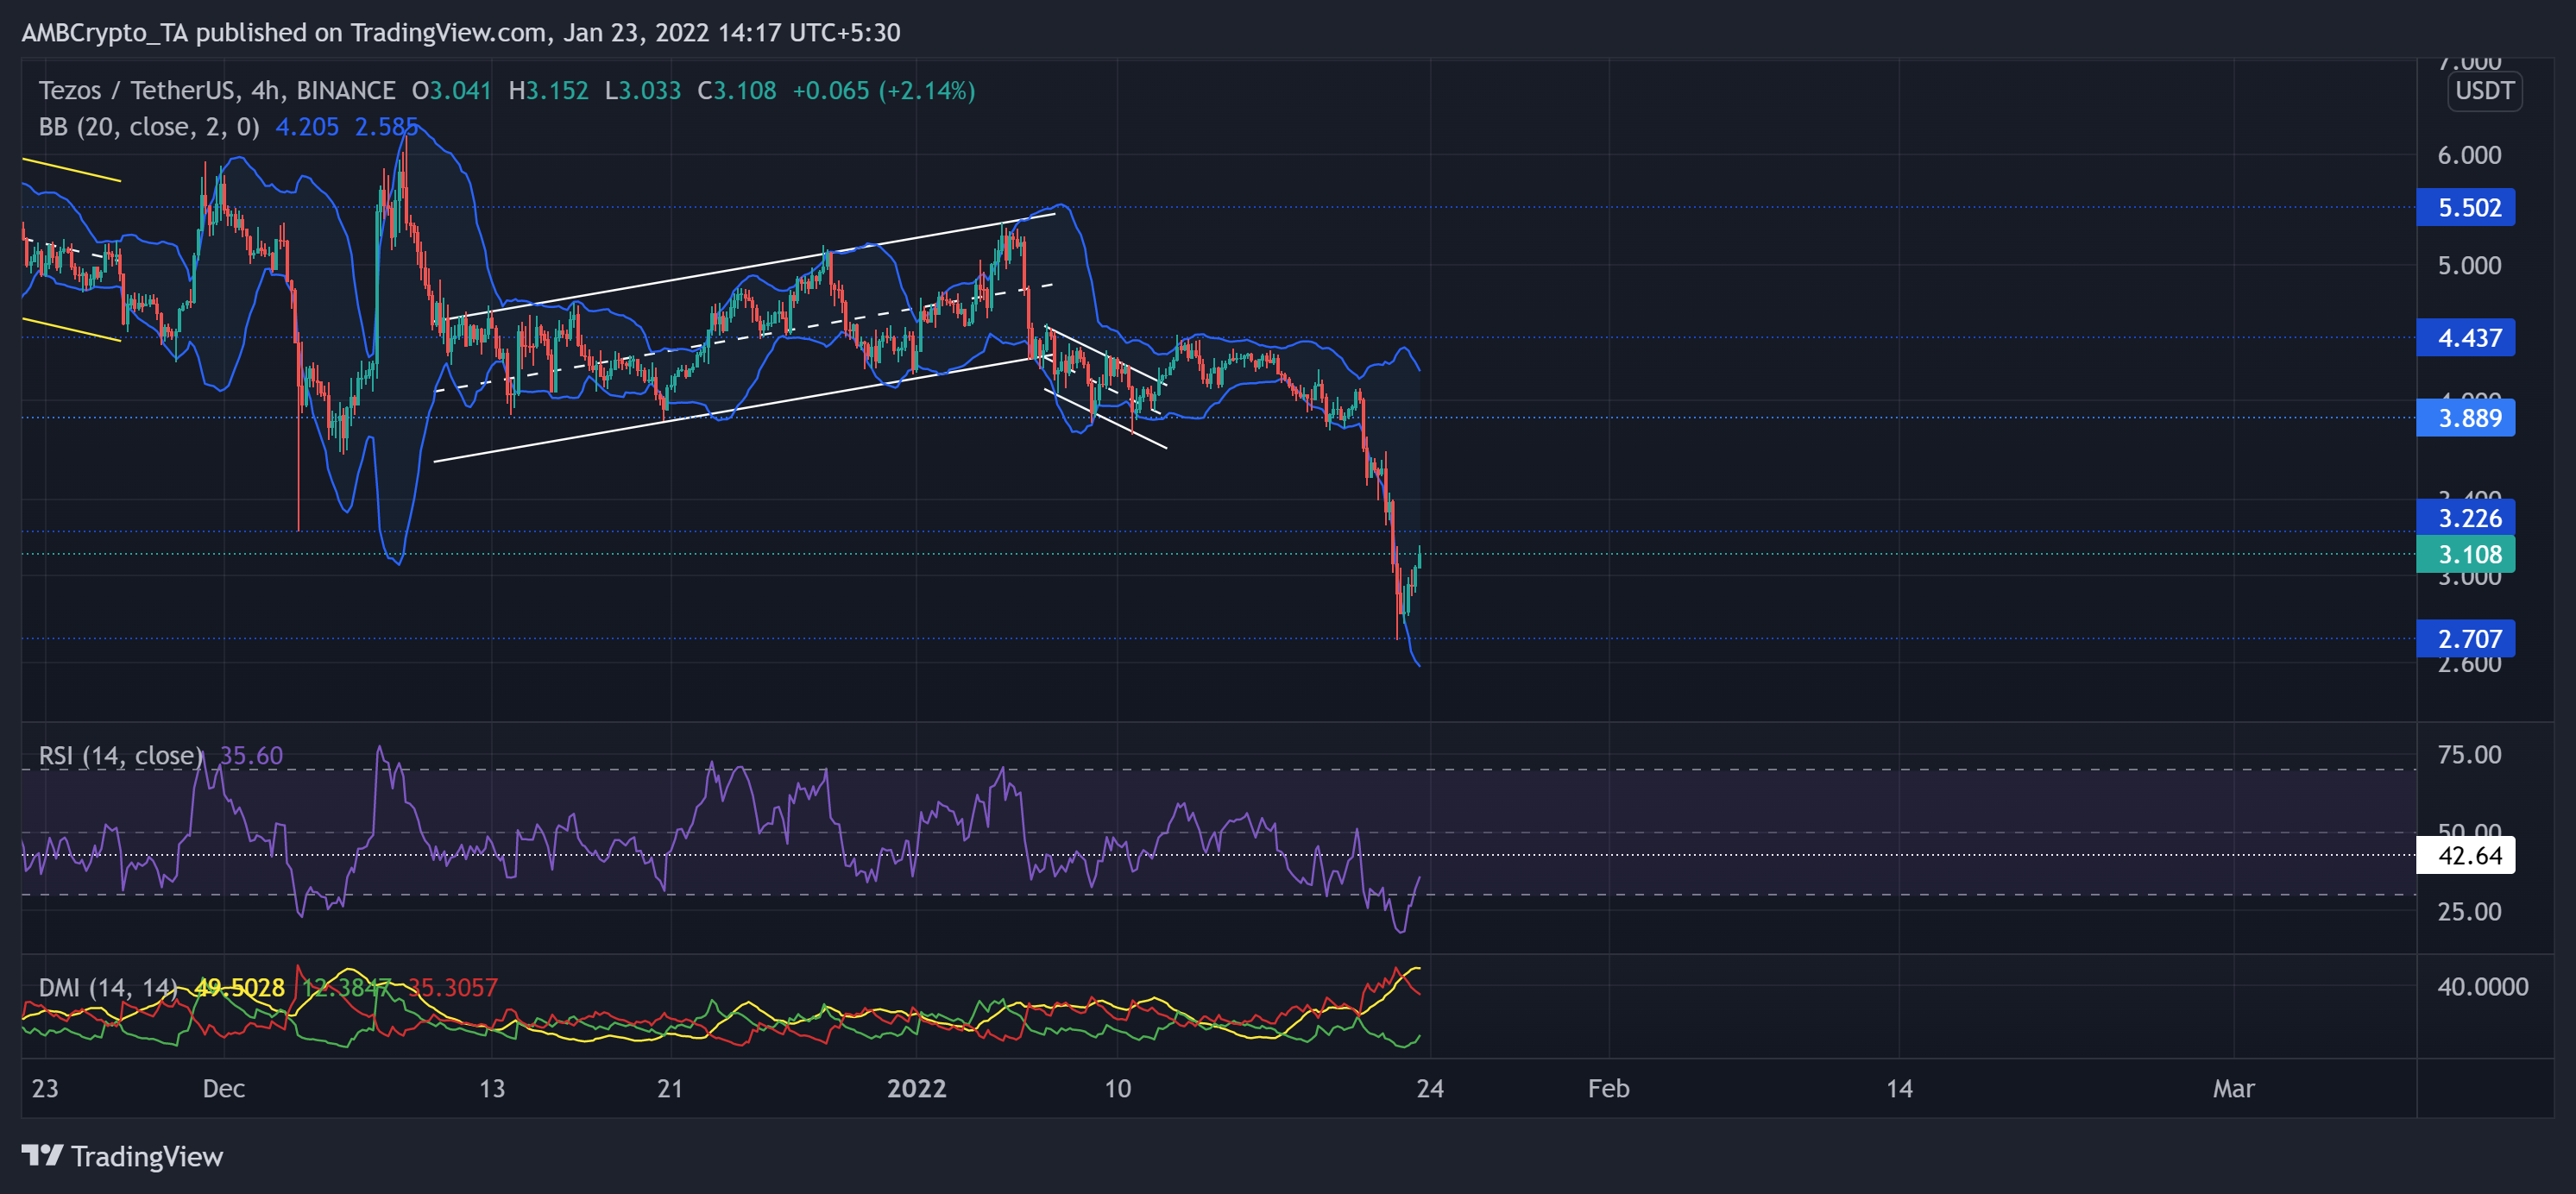
XTZ recovered from its previous support and marked an up-channel (white). However, after the recent fall, the bulls failed to uphold the $3.8-mark, which they maintained for over five months.
The alt registered a 49.67% decline (from 5 January) and touched its six-month low on 22 January after witnessing two substantial sell-offs. Then, after falling towards the $2.7-mark, it showed strong revival signs from the lower band of the Bollinger Bands. Now, the immediate resistance stood at $3.226-level.
At press time, the altcoin was trading at $3.108. After hitting its record low on 22 January, the RSI saw a 20 point revival in the last 24 hours. Its northbound trajectory could find a testing point at the 42-mark resistance. Also, the DMI lines affirmed the bearish vigor. However, their decreasing distance keeps the revival hopes alive.
EOS
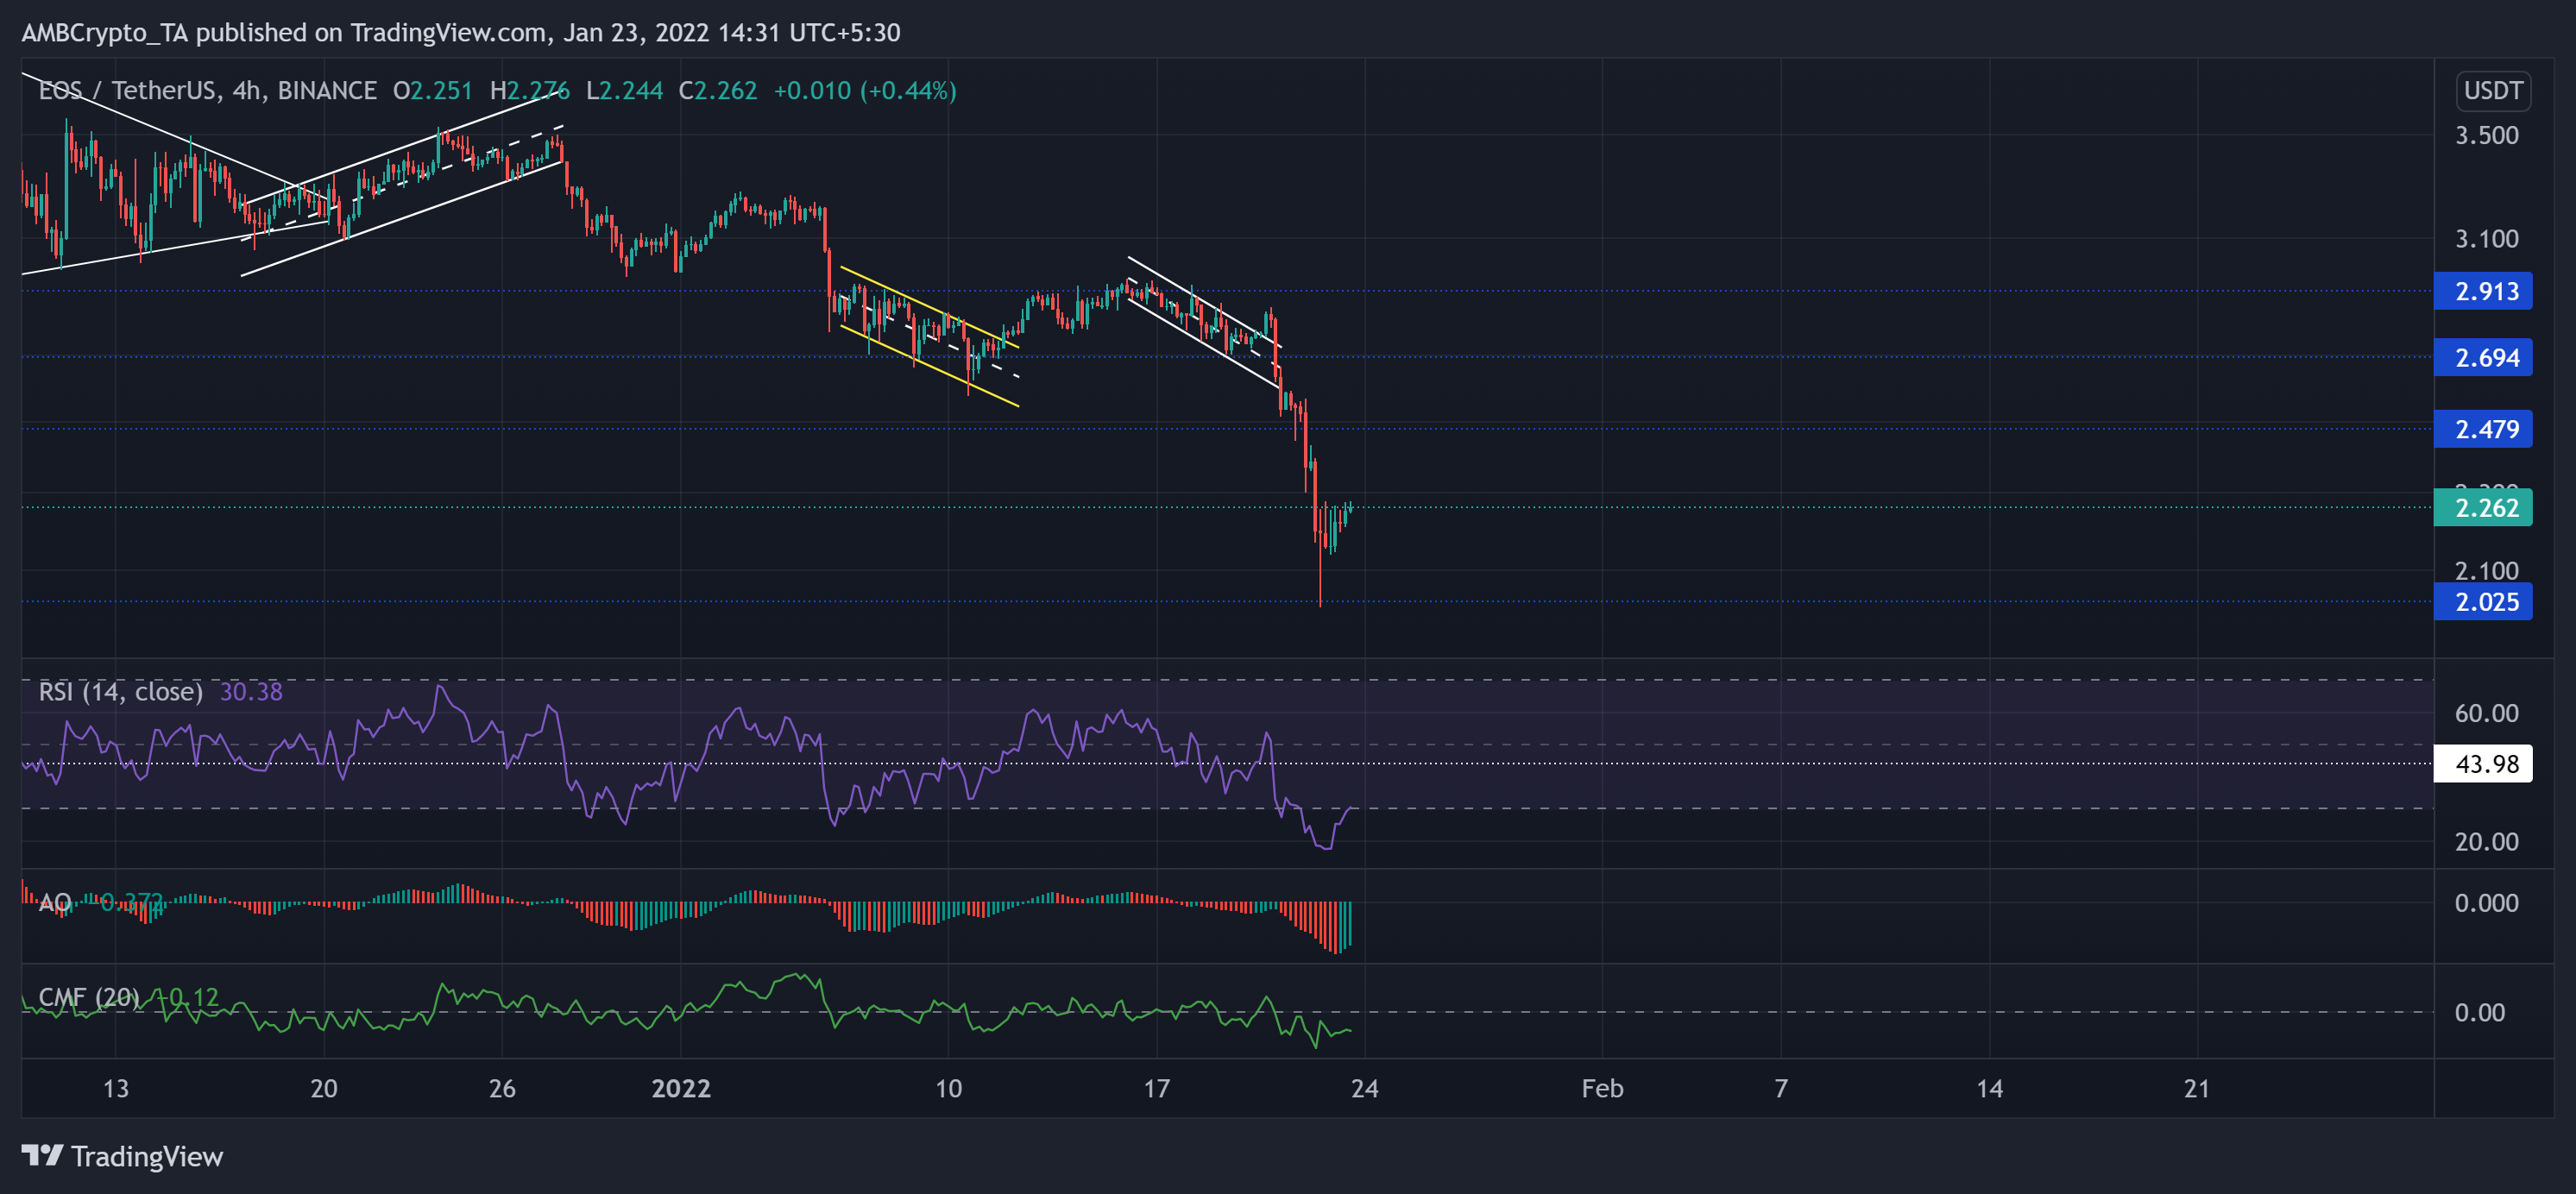
After breaching its five-week low on 10 January, EOS marked an over 14.7% recovery after breaking out of the previous descending channel (yellow).
As the sellers stepped in at the $2.9-zone, EOS plunged into a down-channel (white). Then, its breakout was short-lived with the broader fallout as EOS marked a 29.5% decline and touched its 13-month low on 22 January. Now, the immediate testing point for the bulls stood at the $2.4-mark
At press time, EOS was trading at $2.262. The RSI undeniably chose the bears but slightly improved as it endeavoured to rise from the oversold region. Further, the AO asserted a bearish bias, but it flashed green bars, pointing at the decreasing selling power. However, CMF still needed to close above the zero-line to confirm a strong recovery.