Waves: $5.9 level flipped to resistance, traders going short can…

Disclaimer: The information presented does not constitute financial, investment, trading, or other types of advice and is solely the opinion of the writer.
A week ago, Waves saw a near 50% surge from the $4.5 lows to reach $7.15. Yet, this dramatic surge did not see follow-through from the bulls. A retest of the $5.9 zone saw a weak bounce in price, and a lower high set at $6.5. In the past couple of days, the price has slipped below the $6 demand zone as well.
Can the selling pressure undo more of the gains from a week ago, and force Waves further southward to $5?
WAVES- 4-Hour Chart
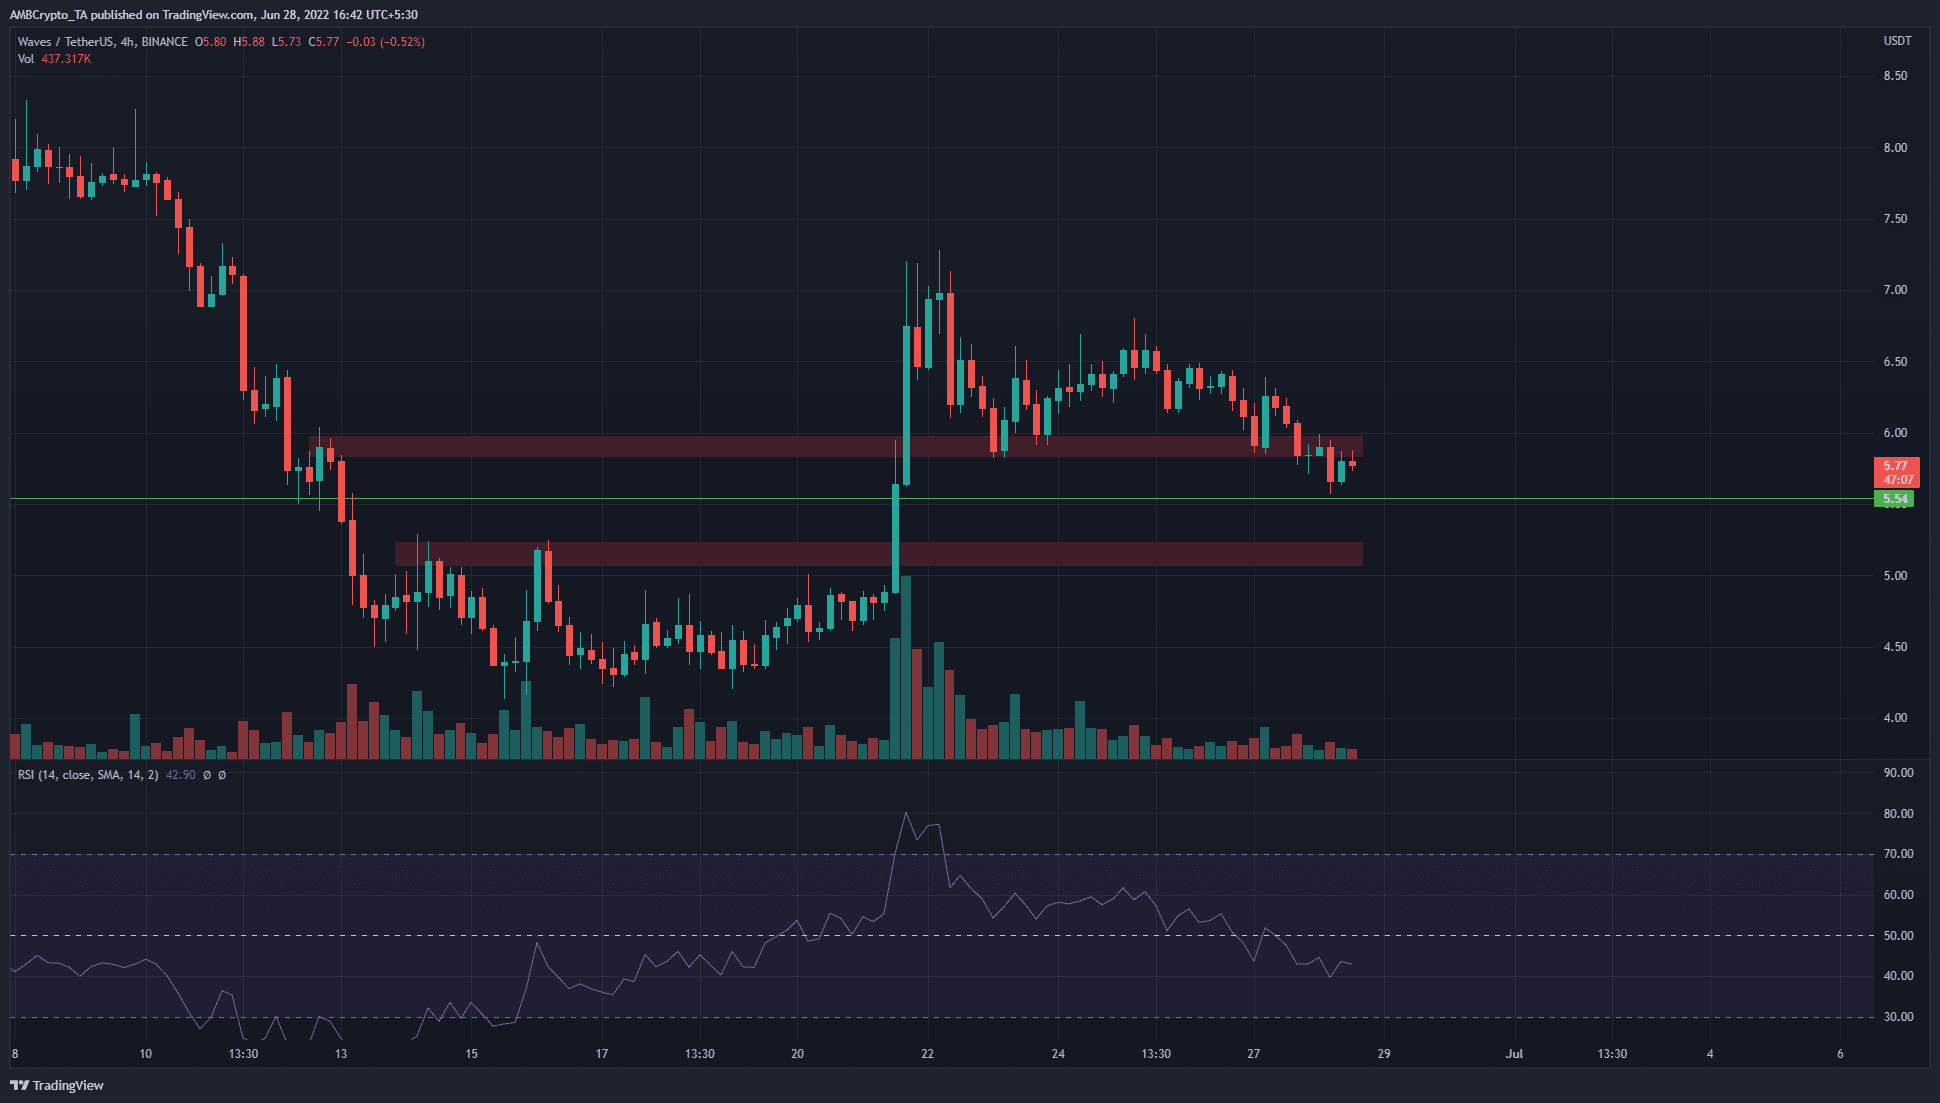
The four-hour chart showed that in the first two weeks of June, the price was in a strong downtrend. The $7.3, $6.5, and $5.9 were a series of lower highs in the downtrend on the chart. In mid-June, the $5.1 area served as resistance and another lower high, but the buyers were able to prevent a move beneath $4.3. Instead, WAVES began to grind its way higher.
In a sudden surge within a matter of hours, the price shot from the $4.5 area to $7 and retraced to $5.9. But, as mentioned before, the price was unable to sustain the strong rally.
The RSI slipped beneath neutral 50 at around the same time the price slipped beneath the $6 area of former demand. This suggested a flip in momentum from bullish to bearish.
WAVES- 1 Hour Chart
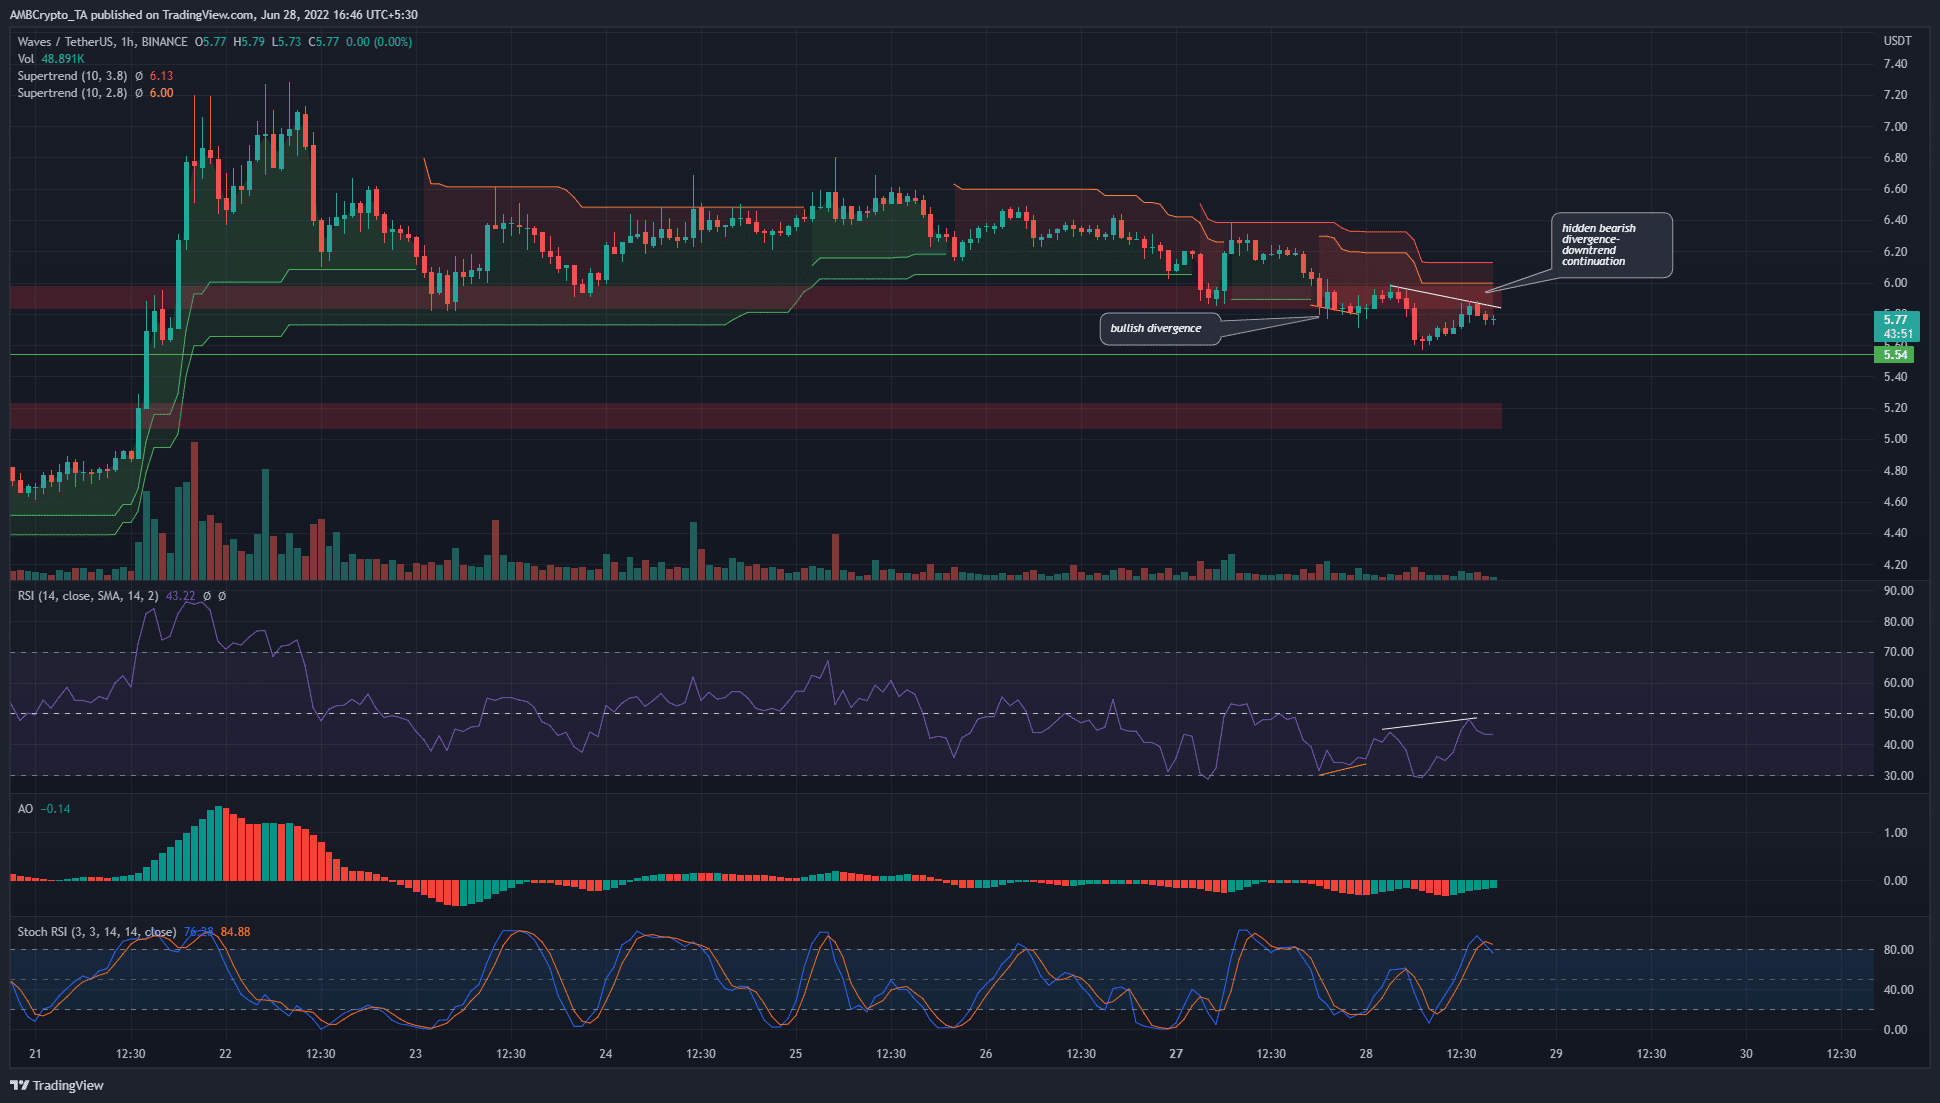
On the one-hour chart, the multiple retests of the $5.9 level can be more clearly seen. In the past few hours, the price was eventually forced to close a session beneath $5.9 and continue lower, nearly as low as the $5.5 support.
Recently, a bullish divergence (orange) was seen. This saw the price bounce very weakly from $5.8 to $5.94, before a strong drop to $5.6.
More recently, a hidden bearish divergence has developed as well (white). Hidden divergences signal a continuation of the trend. On lower timeframes such as the hourly, the trend has been bearish for a few days now. Therefore, a move downward movement was witnessed. The two Supertrends also gave a sell signal while the Stochastic RSI formed a bearish crossover above the 80 mark.
Conclusion
The indicators showed bearish momentum could continue and gave a sell signal. The price action also suggested that the $5.9 level has been flipped to resistance, and a move toward $5.5 and $5.15 could commence. Selling pressure behind Bitcoin [BTC] could give Waves the bearish push it needed for a leg down on the charts.