Waves offers a good buying opportunity here, but only if…

Disclaimer: The information presented does not constitute financial, investment, trading, or other types of advice and is solely the writer’s opinion.
Waves [WAVES] formed a break in market structure and took a turn toward the bullish side over the past week as the bulls managed to drive prices past a crucial resistance.
This move upward showed the possibility of further gains in the days to come. Can buyers hold their nerve and defend the $4.57-$4.7 support zone?
WAVES- 4-Hour Chart
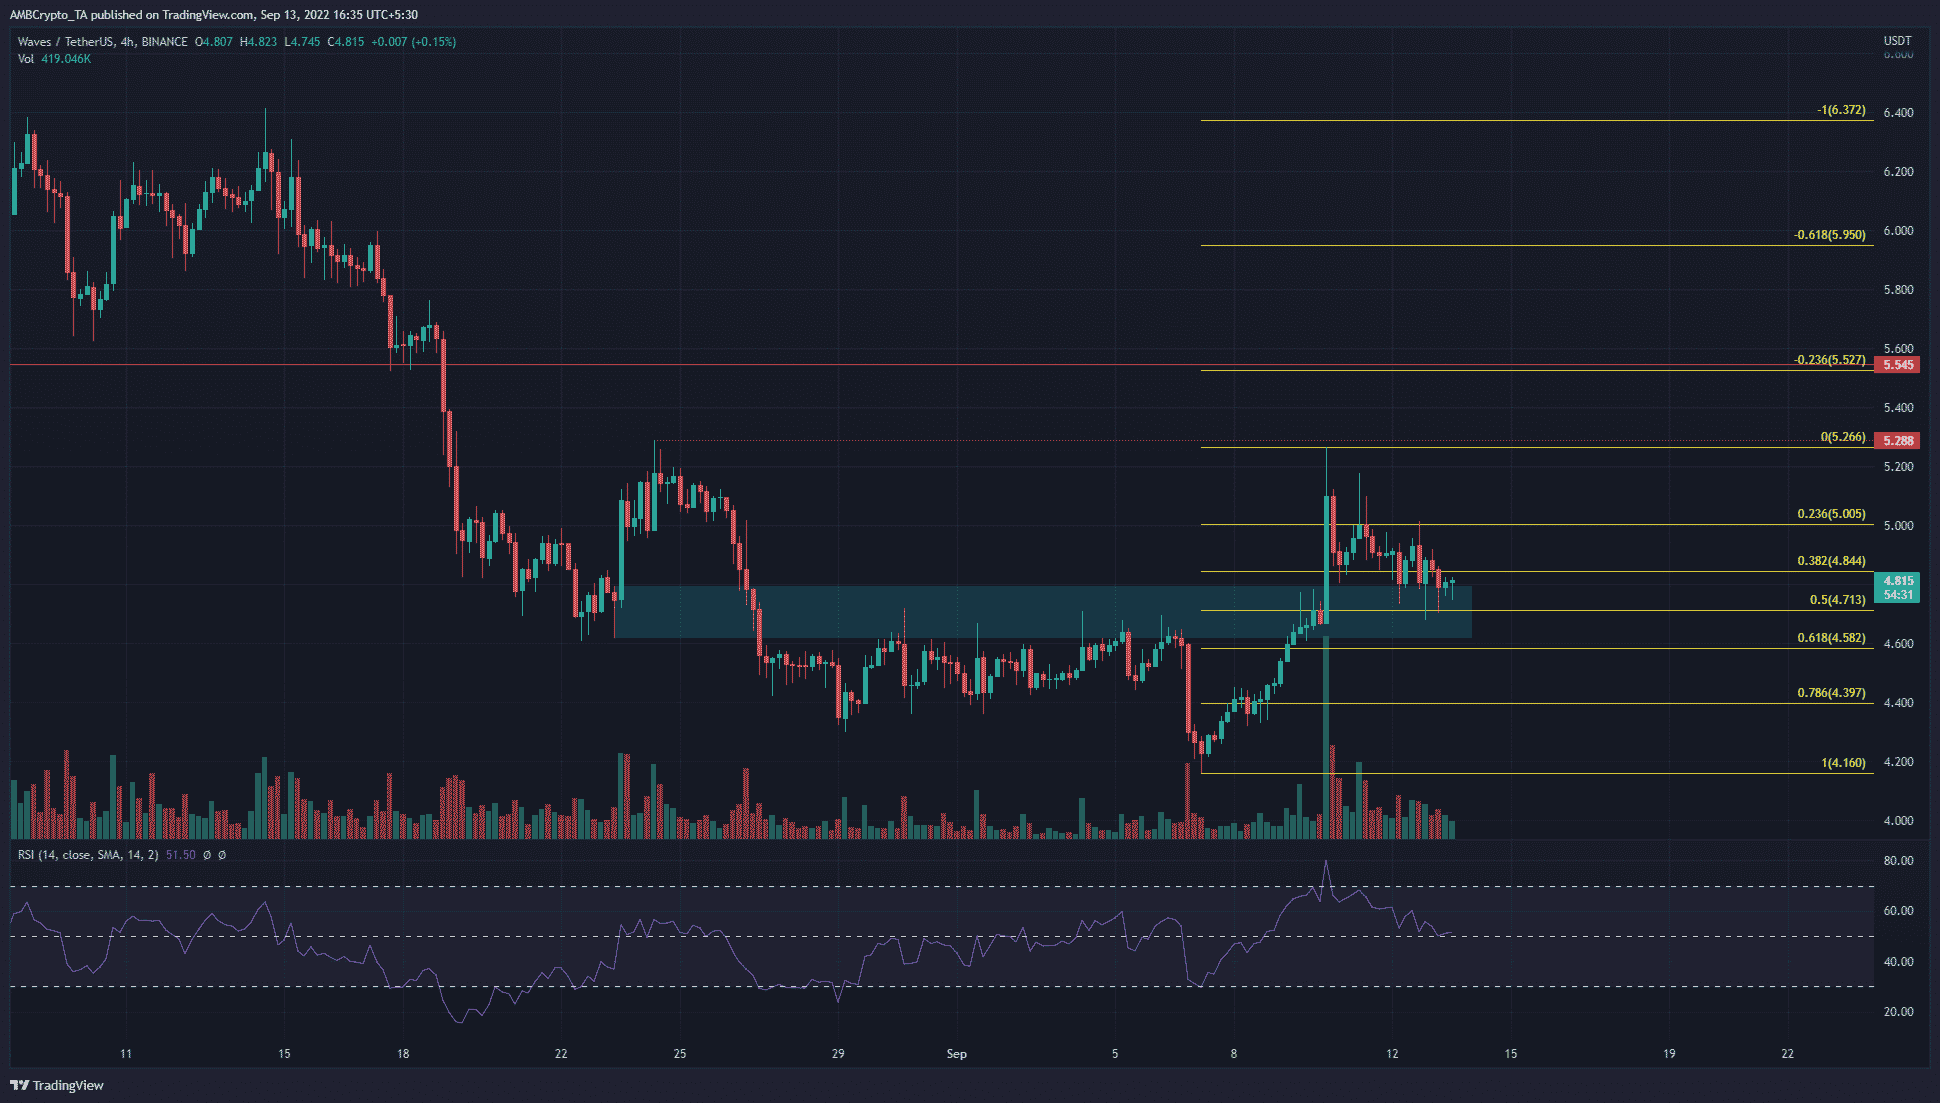
In August, the trend had been strongly downward. On the way south, the price had found some support at $5.5 and $4.7. Therefore, based on the past month of price action, some important levels were clear for WAVES.
The first was the $4.7 zone, marked in cyan. It saw a bounce to $5.28 in August but gave way without much of a fight a week later. This marked the area as an important zone of supply and a bearish order block.
In September, WAVES tested this belt of resistance multiple times. The bulls were finally met with some success. The past week saw a huge surge northward, to the $5.26 mark. This was quite close to the $5.28 resistance from earlier.
At the time of writing, it looked likely that WAVES would continue to swell upward from the nearby support zone. To the north, $5.28 was an area that bulls can look to take profit at.
The 23.6% Fibonacci extension level (yellow) sat at $5.52 and had good confluence with a significant horizontal support level. The RSI was above neutral 50 and no divergences were present.
WAVES- 1-Hour Chart

The one-hour chart highlighted the pullback of the past few days. The On-Balance Volume (OBV) saw a decline in recent days, which suggested some selling pressure on the dip from $5.2.
The Bollinger Bands (blue) tightened on the price chart, which indicated a period of consolidation. The BB width indicator also appeared to take a dip in recent hours.
It has already been demonstrated that the $4.7 zone was a significant zone to watch out for. If the bulls can defend this area, a move upward could follow.
Conclusion
The price charts showed the possibility of a buying opportunity at $4.7, with a stop-loss nearby at $4.57. However, this plan of action would depend heavily on Bitcoin, and if the bulls can stay above the $22k mark.