What Cardano, Polkadot’s opposing price actions mean going forward

With Bitcoin gaining momentum as it closed in on its ATH, several altcoins seemed to shy away from gains. On the contrary, Polkadot recorded a rally of almost 15% in less than three days. The same came on the heels of the parachain auction launch announcement by Founder Gavin Wood.
Now, a previous article had highlighted how ahead of highly-anticipated upgrades, altcoins tend to see rallies fueled by highly positive social sentiments. Ethereum and Cardano’s trajectories noted something similar too. However, as anticipation died down, the prices consolidated and waited for more hype to pump the tokens.
Notably, DOT too had lost much of its momentum at press time.
However, that wasn’t the only thing that both DOT and ADA had in common. In fact, their price trajectories revealed another perplexing trend.
Opposite trajectories
Since August, both Cardano and Polkadot have seen opposing price trajectories. Until early August, before ADA started pumping ahead of its smart contracts launch, the two alts moved almost hand in hand on the charts.
Since then, however, both ADA and DOT’s price actions have gone their opposite ways.
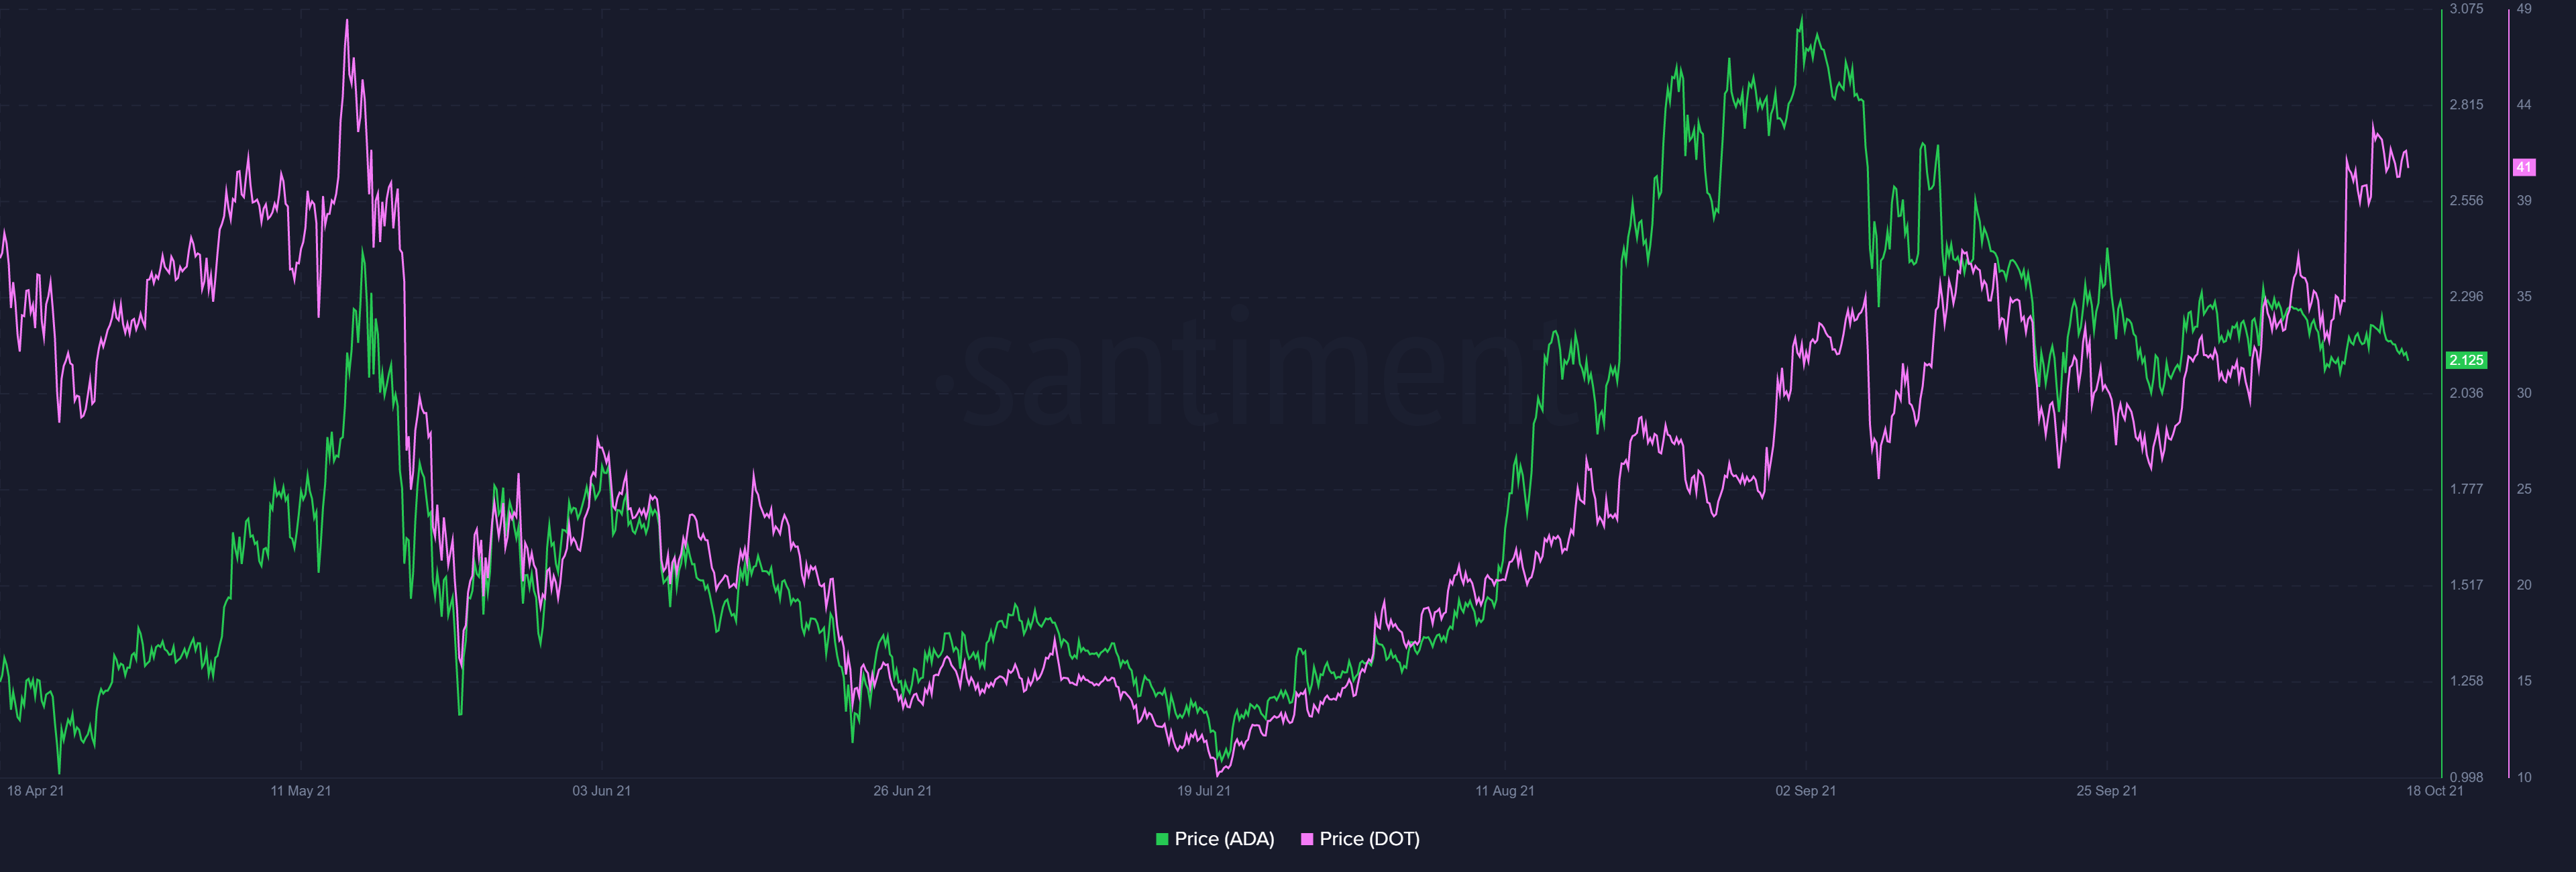
While Cardano had a more market-independent pump, DOT’s price momentum was comparatively similar to BTC’s. Notably, on 20 August, when ADA saw a pump, DOT fell on the charts. Likewise, on 10 September, when DOT saw a price hike, ADA’s price slumped.
While DOT’s price was consolidating at the time of writing, Polkadot still managed to be in the news after Huobi Global made an announcement that it will support the Polkadot Parachain slot auction.
Additionally, Sharpe ratios for the two cryptos highlighted how Cardano had become riskier than DOT.
ADA’s Sharpe ratio had a reading of -1.38 while DOT’s was 2.72, at the time of writing. The Sharpe ratio analyses the market risk associated with assets by assessing the performance of the asset compared to a “risk-free” asset over a window of time.
Even though both the altcoins saw a considerable fall in their Sharpe ratios over the last month, DOT’s held better than ADA’s.
Stark similarities
With DOT consolidating and ADA stuck in a closed channel, 28.44% below its ATH, the two ETH-killers’ near-term future seems shaky. However, there is one trend that seemed to be strikingly similar for both alts – Their whale movement.
The percent of stablecoin total supply held by whales with more than 5 million USD for both the altcoins was 52.
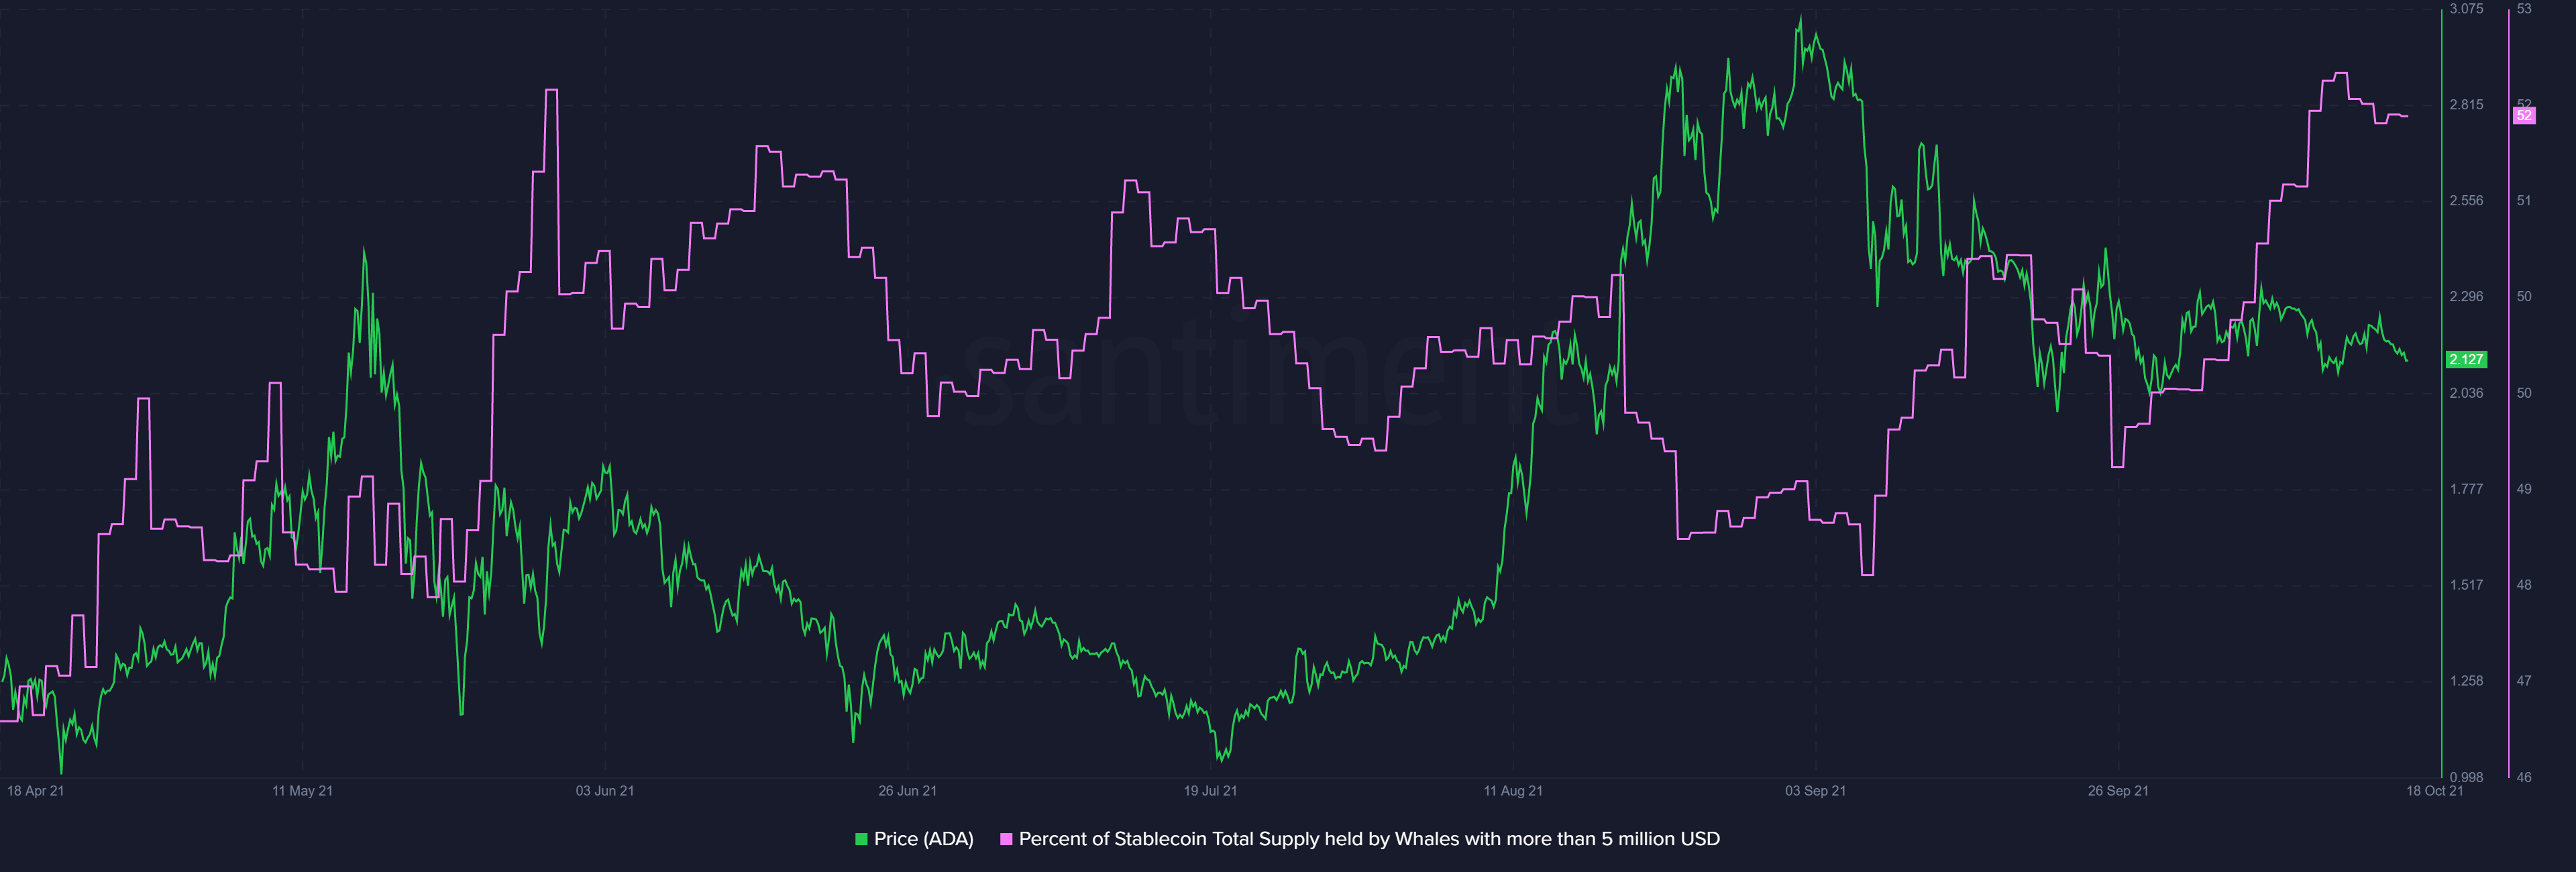
While price-wise there seemed to be differences in their trajectories, DOT and ADA whales were behaving in the same way, seemingly maintaining positions at constant levels.

As of now, however, ADA is suffering tremendously, especially when looked at against BTC. The ADA/BTC chart set a new two-month-low of 3620 SAT this week.
On the contrary, analysts believe that DOT appears to be “programmed” to rise above $100 in the current market cycle.
With Bitcoin still consolidating near $62k, both altcoins seemed to be mimicking BTC’s price action at press time. A hike in BTC’s price could trigger DOT’s price on the charts. As for ADA, the fourth-ranked alt might be waiting for another hype-induced rally.


