What equal lows on SAND’s daily actually mean for its price trend

Disclaimer: The findings of the following analysis are the sole opinions of the writer and should not be considered investment advice
The Sandbox has been on a downtrend on the price charts since early December. One of the largest metaverse coins, SAND, the native token of The Sandbox, had a market capitalization of $1.459 billion at press time. Over the past few days, the USDT dominance has dropped from 5.1% to stand at 4.15%.
In the past, this chart has topped near the 5.5% area to mark a local bottom. The decreasing value indicated money flow into cryptocurrencies. Bitcoin’s move above $42k could see a positive impact on SAND in the weeks to come.
SAND- 1 day chart

The long-term market structure was bearish as SAND formed a series of lower highs. However, over the past month, the bulls have been able to hold on to the $2.7-level where the price formed its previous lower lows.
This opened up a possible scenario for SAND, one where the price established a range and an accumulation phase with $2.7 as the range low. Alternatively, the bulls might also succeed in breaking above $4.13 if sufficient demand steps in.
That demand was yet to be seen, at the time of writing. Ergo, the outlook for the coin remains bearish.
Rationale
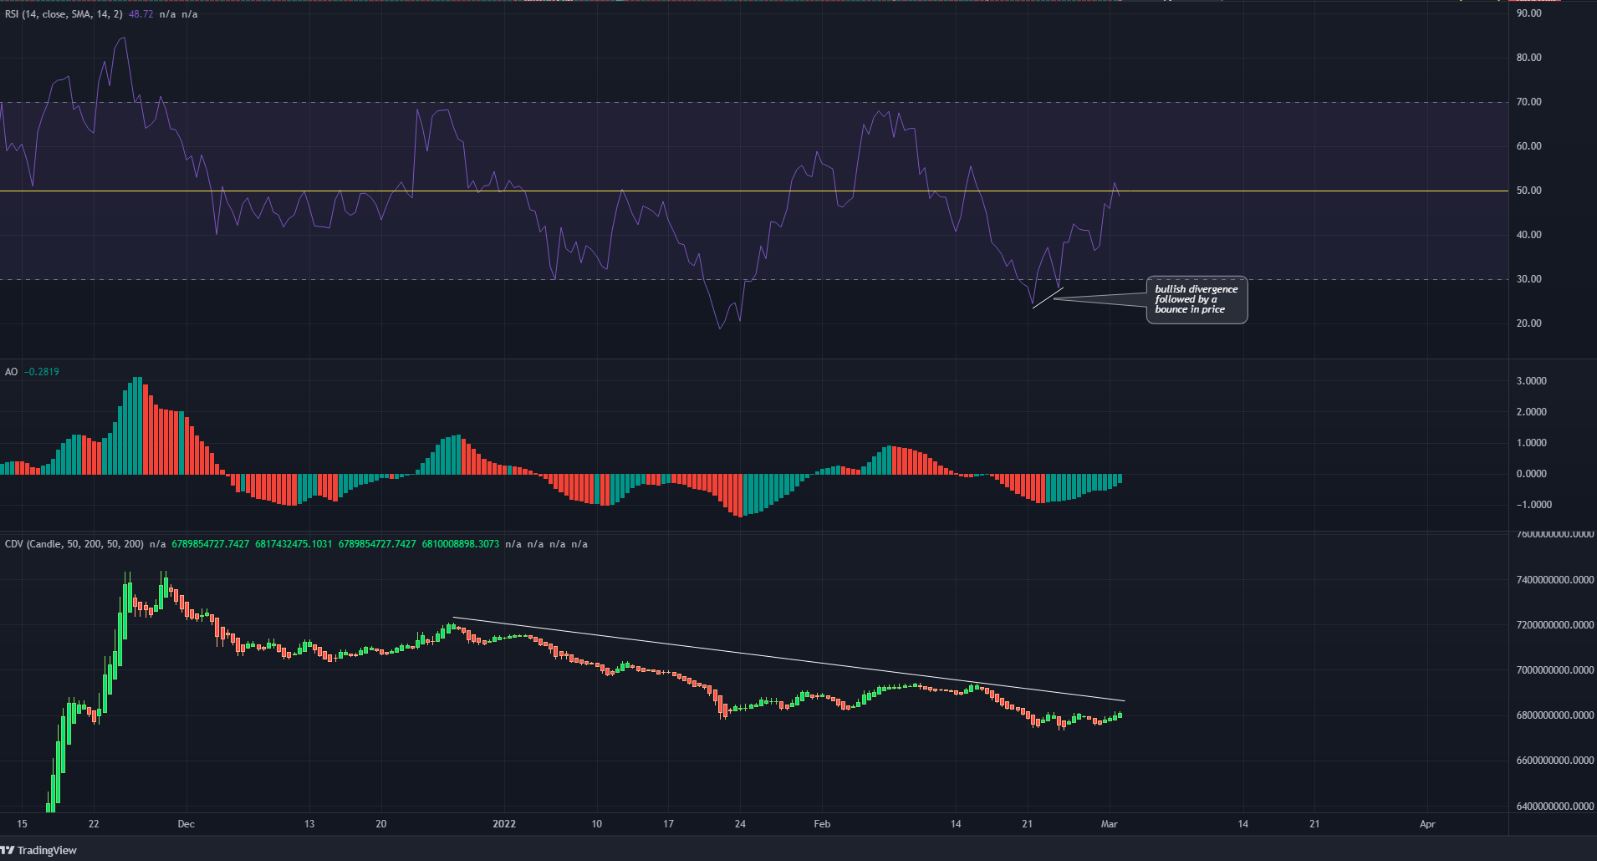
The RSI on the daily flashed a bullish divergence a couple of weeks ago. Subsequently, the price bounced from the $2.7-lows to test the $3.27-resistance level, later flipping this level to support. At the time of writing, the RSI stood at the neutral 50-level.
The Awesome Oscillator registered green bars on its histogram to signal weakening bearish momentum. However, it was still under the zero line. This hinted that a local bottom could have been reached. Even so, the bullish impetus hasn’t been seen yet.
The OBV has been trending southbound over the past couple of months to signify the fact that selling volume has outweighed buying volume. This lack of demand could see SAND drop lower on the charts.
The 21 and 55 period moving averages formed a bearish crossover.
Conclusion
While the price charts indicated a possible bullish scenario, the leaning was still bearish. The market structure pointed to further downside if SAND faces rejection at or before $4.13. Even a break of the descending trendline cannot conclusively indicate the end of the downtrend.