What investors should look for from ‘sluggish’ Ethereum

Ethereum’s price rallied after 21 July. In fact, when its price breached the $3300-mark on 13 August, the market’s largest alt was trading at its three-month high. However, the trend has slowly begun changing. Consider this – At the time of writing, ETH’s price had dropped below $3k and was trading at $2950. Will the altcoin see some respite anytime soon?
Current conditions do not favor a price rise
A week ago, it was observed that the intensity of the bearishness on Ethereum’s Price DAA Divergence model had been reducing. However, the aforementioned trend reversed itself on 17 August and exhibited a highly bearish signal, at the time of writing.
The Price Daily Active Addresses Divergence is a relationship model between the coin’s performance and the number of daily active addresses that interact with it. Whenever the degree of bearishness has fallen on this model, ETH’s price has appreciated. Hence, a reversal at this stage does no good.

The aforementioned bearish narrative was further supported by the long-short liquidations. At press time, long contracts worth $53.326 million had forcefully been liquidated while only $12.9 million short contracts had been closed. By and large, this suggests that the market is more favorable to those traders who are advocating that ETH’s price will fall.
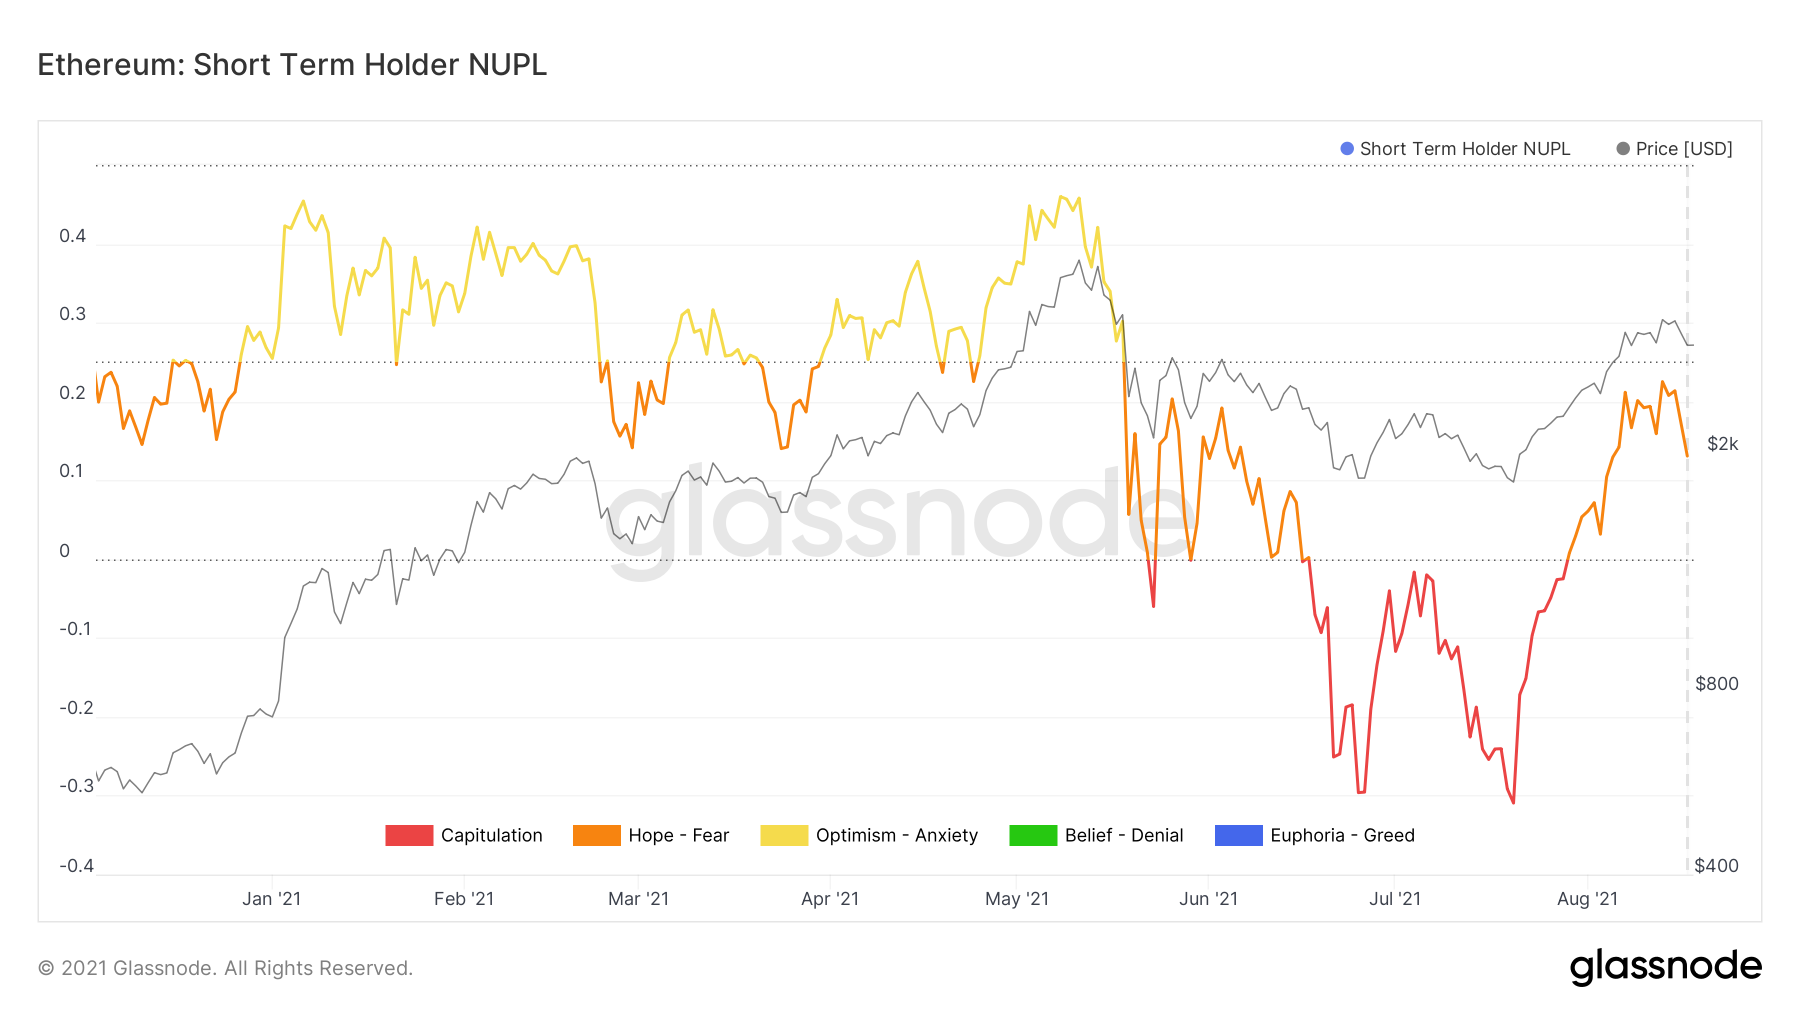
The STH-NUPL (Short Term Holder Net Unrealized Profit and Loss) also pointed to the same trend. This indicator is used to assess the behavior of short-term investors. Whenever the curve hovers in the upper zone, it implies that unrealized profits are quite large. This indicator had been inching north since the end of July, but it set out on a downtrend after 13 August.
If the reading of the STH NUPL falls back below zero from the current level (0.13), it would mean that these HODLers have surrendered. Whenever this has happened in the past, ETH’s price has depreciated most of the time.
Additionally, Ethereum shared a high correlation (+0.96) with Bitcoin. The latter’s price has not been able to break above the crucial $48k level and has been consolidating in the lower $40k bracket for more than a week.
Ergo, for ETH’s price to continue its rally, BTC’s environment, parallelly, has to become more favorable.
What next?
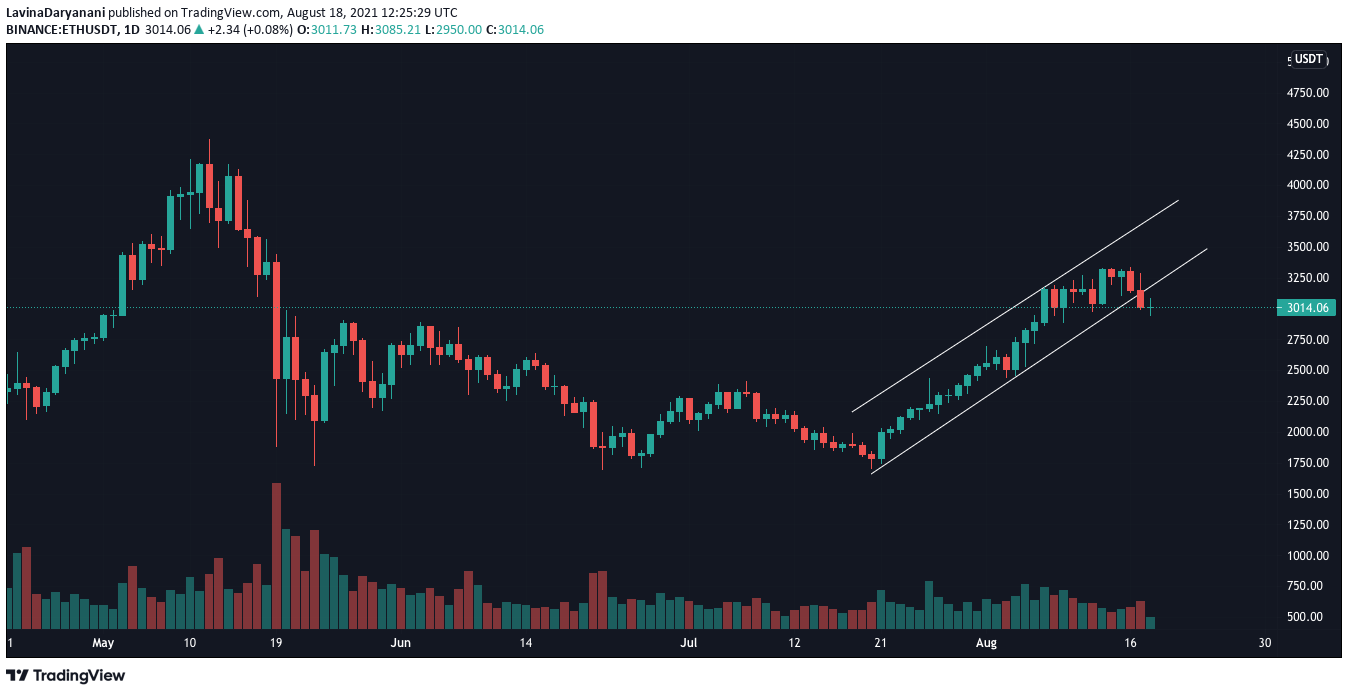
Well, Ethereum’s price chart did not look promising either. As can be seen from the chart, ETH broke below its ascending channel on 17 August. In fact, the latest candle was fairly below the lower trendline of the same channel.
This breakdown seemed to reaffirm the weakening state of ETH’s uptrend. However, if the price manages to climb above $3200 within the next few hours, it would end up re-entering the ascending channel. Traders can then expect the bearish momentum to be wiped off. Nonetheless, if the downtrend continues, ETH’s price would find itself in the $2800 range again.