What to expect next after Axie Infinity trades over a strong demand area

Disclaimer: The findings of the following analysis are the sole opinions of the writer and should not be considered investment advice
On a short-term basis, Axie Infinity has seen some demand step in around the $68-$70 area. This is an important demand zone, stretching all the way south to $64. It is not yet clear whether the recent move up for Axie Infinity is a mere bounce on a longer-term downtrend, or whether AXS has found an area at which it could consolidate and gather steam for its next move.
Apart from the charts, the community noted in a recently released newsletter that they are gearing up for a flurry of catalysts and launches in 2022. These developments could turn out to be bullish for AXS provided the rest of the market’s sentiment does veer too steeply bearish.

On the hourly chart, the price formed an ascending channel (white). As it has already been noted, the whole area from $70 to $64 has been a pocket of liquidity for AXS. This meant that it was an area the price stagnated at while bulls and bears skirmished for control.
At the time of writing, the bulls managed to coerce a bounce from this area over the past week, something that was encouraging.
However, the $75.2-level has been steady support, and combined with the channel confluence, added significance in the coming hours. The price is expected to bounce sharply from this level’s vicinity. A session close below the $74-mark could see AXS tumble back toward $70 once again.
Rationale
The Visible Range Volume Profile showed that the Point of Control (PoC) lay at $73, which meant it was a strong support level. The $74, $78, and $80 levels have also been high volume nodes recently, which means the price could see support or resistance at these levels once it reaches them.
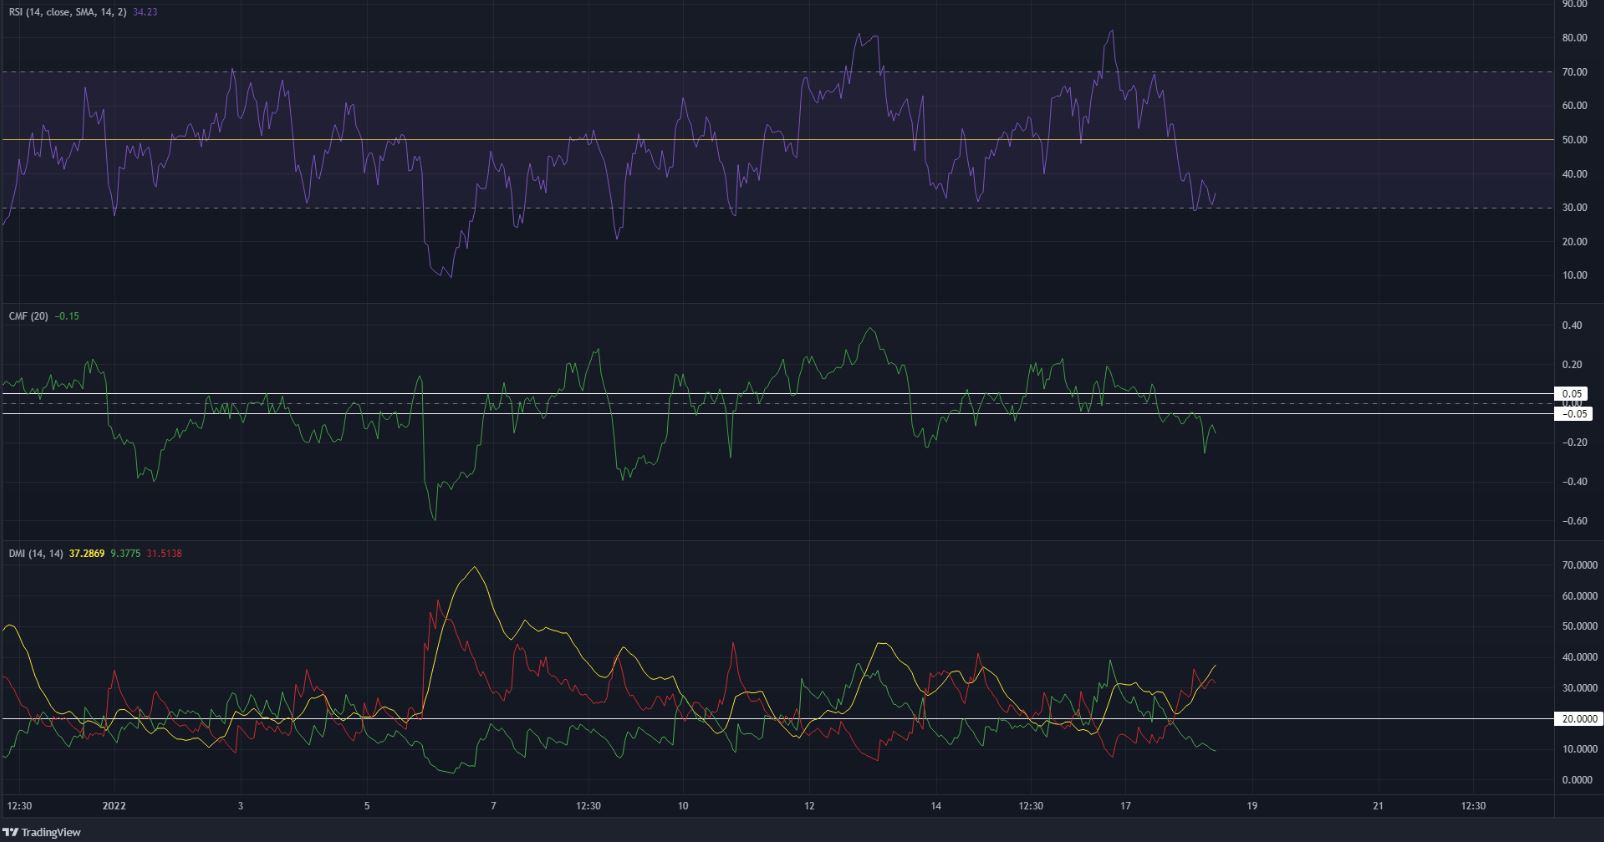
The RSI was well below neutral 50 after AXS pulled back sharply from the channel highs at $83. The CMF was also below -0.05 and it showed significant capital flows out of the markets. The Directional Movement Index indicated a strong bearish trend in progress, as both the ADX (yellow) and the -DI (red) were above 20.
Conclusion
The indicators pictured strong bearish momentum for AXS, and this could see the price drop to $73, the PoC. A close beneath the channel generally sees the price drop back toward the base of the pattern, which in this case lay at $68.
A dip this far might or might not occur, hence any buys in the $74-$68 area have to be carefully managed. A bounce from the $75.19-level would present take-profit levels near $80 and $84.8.


