What traders should and shouldn’t do when mapping MATIC’s short-term price

Disclaimer: The findings of the following analysis are the sole opinions of the writer and should not be taken as investment advice
A symmetrical triangle breakdown was in effect in the MATIC market and an important support zone had to share the responsibility of triggering a reversal. While losses can be moderated, an external catalyst is needed to push MATIC back towards the baseline of its descending triangle around $1.55.
At the time of writing, MATIC was trading at $1.448, down by a massive 10% over the last 24 hours.
MATIC Hourly Chart
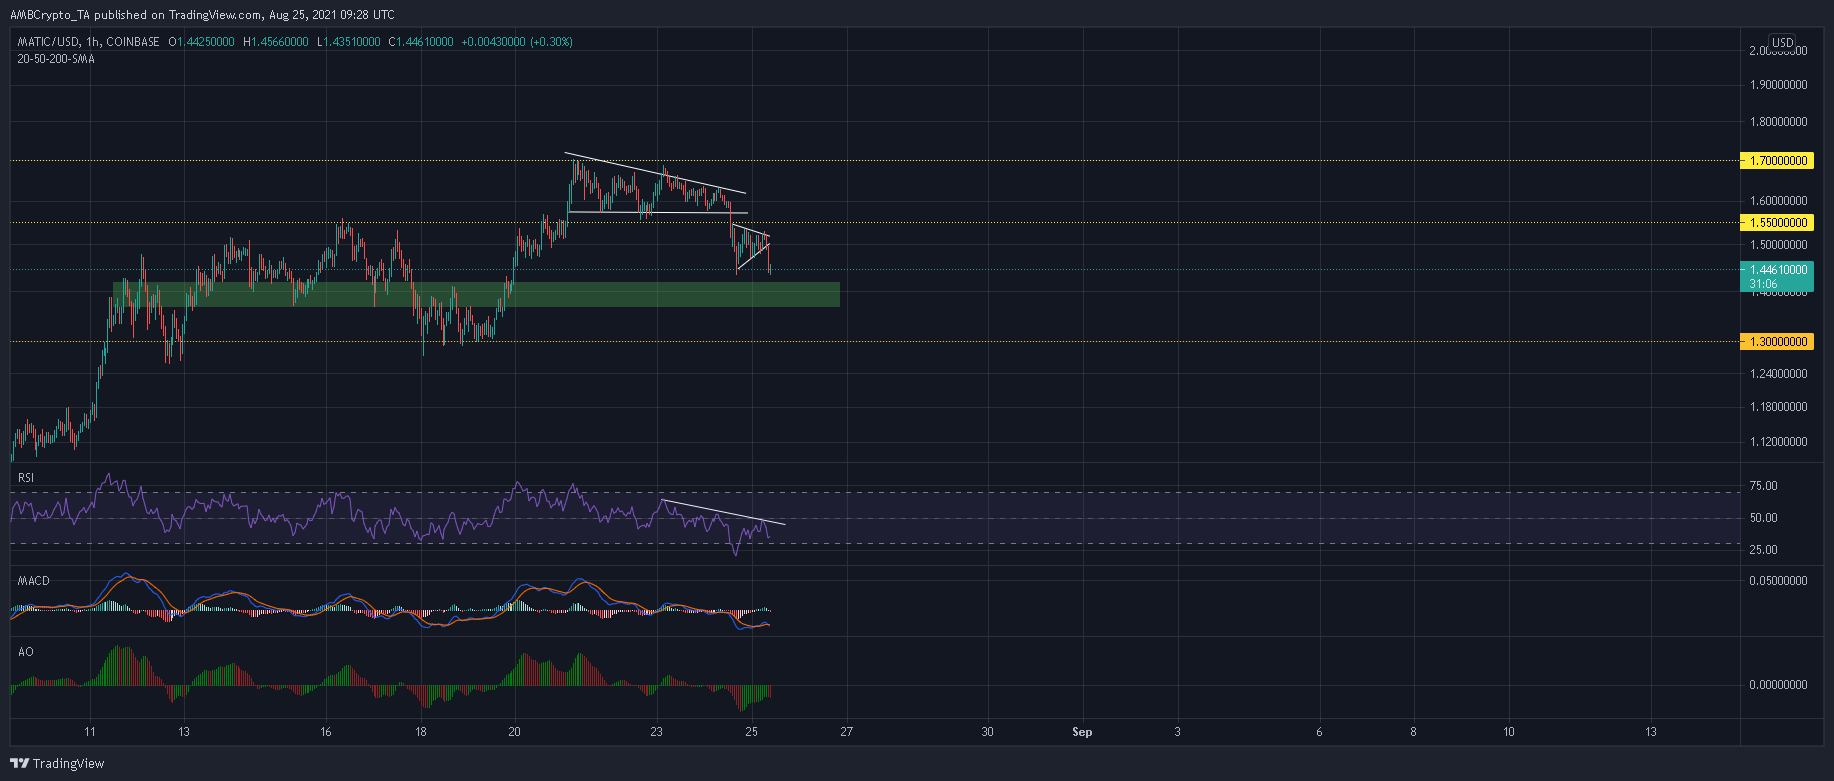
Since touching a local high of $1.70, MATIC has been under the pump. Lower highs were observed on the hourly timeframe as a descending triangle eventually triggered a 10% retracement. From that point, an emerging symmetrical triangle functioned as a continuation pattern. This led to more losses of 5.8% on the charts.
Spotlight seemed to fall on the support zone of $1.37-$1.42 from where a few scenarios seemed possible. Stopping losses within this region would lead to a reversal and a comeback above $1.48 would be the best-case outcome. However, this would require an external boost from the broader market.
On the other hand, short sellers could initiate further drawdowns in case MATIC closes below $1.37.
Reasoning
The Relative Strength Index was well within a downtrend on both the hourly and 4-hour timeframes. Since the oversold zone was yet to be breached, MATIC can expect some additional losses before buyers enforce a reversal.
The hourly MACD also dipped below the half-line – A development that often functions as a sell signal. The Awesome Oscillator also lined up favorably for sellers and dipped below its equilibrium for the first time in five days.
Conclusion
While the aforementioned signals presented chances of an extended sell-off, bulls do have a window between $1.37-$1.42 to regain some market control. A best-case outcome would result in a comeback above $1.55, one from where more rallies can be expected.
On the other hand, failing to contain losses above $1.37 could lead to bleeding all the way up to $1.30. Meanwhile, traders should avoid entering a position unless MATIC presents a clear trend confirmation over the next few sessions.


