‘Where, how’ of TRX bulls leveraging this pattern’s breakout potential

Over the last six weeks, Tron’s [TRX] fluctuation was range bound in the $0.66-$0.07 zone. The decline from the $0.07 ceiling has affirmed a bullish continuation pattern in the 4-hour timeframe.
The recent decline reinforced the near-term bearish efforts in pulling TRX toward its 200 EMA support (green).
Furthermore, with the immediate support in the $0.067 zone yet to be tested multiple times, the bulls could aim for a patterned breakout in the coming sessions. A jump above the 20 EMA could hint at a continued near-term recovery. At press time, TRX was trading at $0.06843.
TRX 4-hour Chart
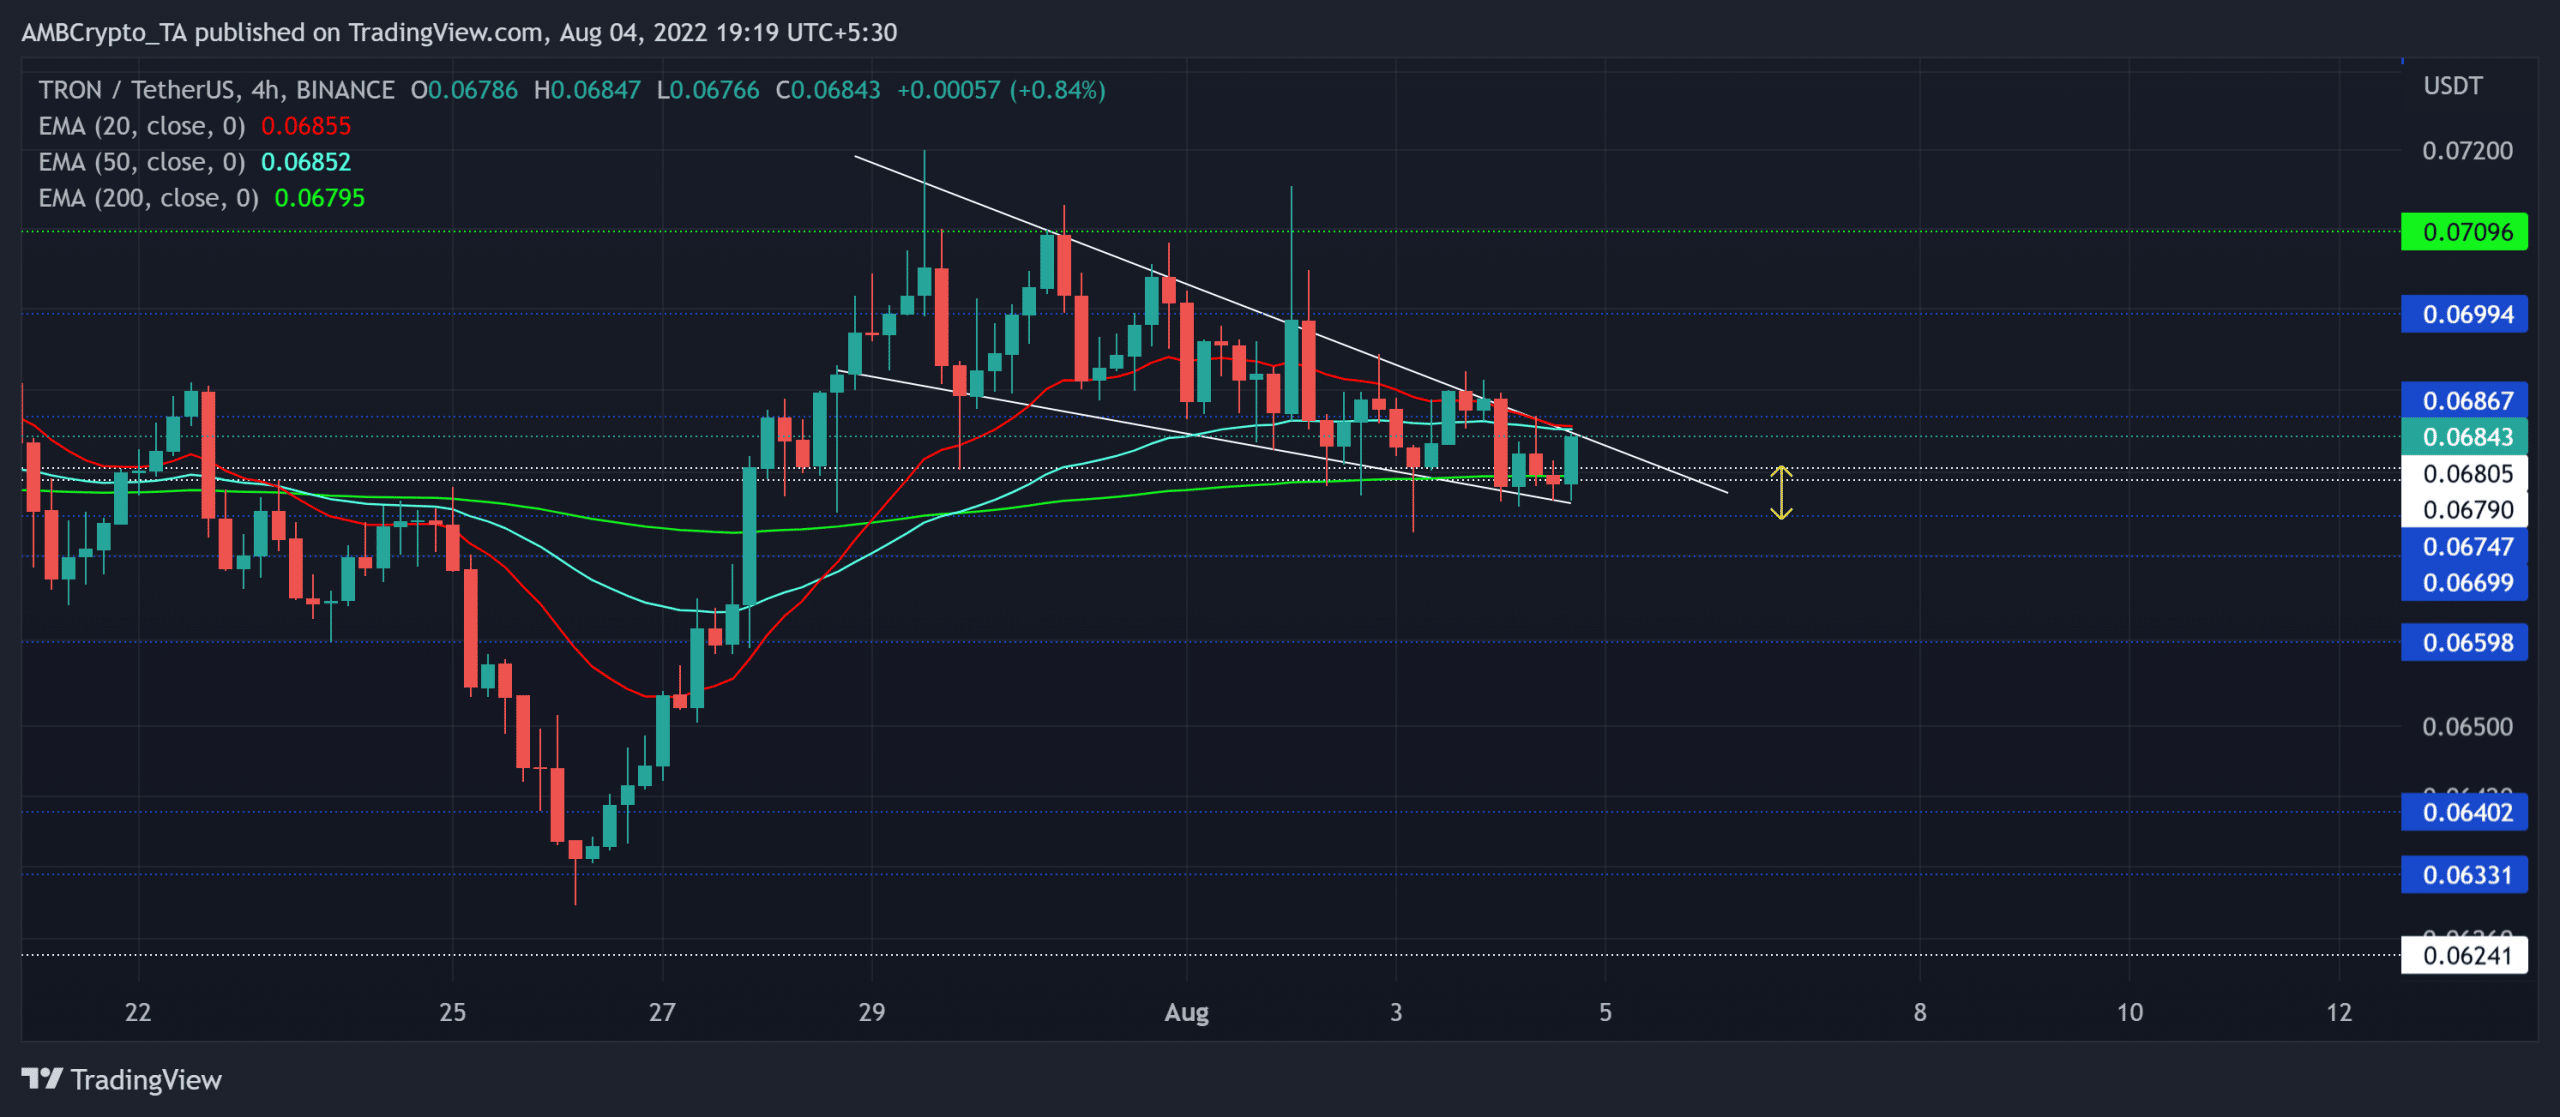
TRX registered a solid growth after rebounding from the $0.063 baseline. The recovery from its long-term support entailed a classic bullish pennant on the chart.
However, the sellers revealed their near-term edge, especially with the price action falling near the 20/50 EMA. But with the 200 EMA coinciding with the $0.067 support, the altcoin has brighter chances of propelling a recovery.
An added bullish impetus can help TRX break above the current pattern. In this case, the $0.0709-mark can cap the buying efforts. The traders/investors should look for rebounding signals from this region.
In case of a death cross on the EMAs, the alt could see a short-term decline. Here the potential targets rested in the $0.065-$0.066 range.
Rationale

The Relative Strength Index (RSI) struggled to cross the midline while depicting a rather neutral stance. The buyers needed to snap the 50-mark resistance to heighten the chances of a bullish break on the chart.
Further, the On-Balance-Volume (OBV) maintained its immediate support despite the price action’s lower troughs. Thus, revealing a slight bullish edge.
Also, the Accumulation/Distribution saw higher troughs as it bullishly diverged with the price. Nevertheless, the ADX displayed a substantially weak directional trend for TRX.
Conclusion
Given the bullish pennant structure approaching the 200 EMA support, TRX could see a bounce-back before facing stiff resistance. The targets would remain the same as above.
However, investors/traders should consider Bitcoin’s movement and its impact on broader market perception to make a profitable move. An analysis of this would aid traders in anticipating the possibility of any bullish invalidations.