Altcoin

Why Cosmos investors shouldn’t ‘risk it all’ as ATOM hits highest point since May
Posted:
editors

Cosmos [ATOM] has hit the highest point in price since it traded at $15.70 on 8 May. Dubbed as the ‘economy of the future”, ATOM had kept its investors wondering if they had any bright hope as it was far from its All-Time High (ATH) of $44.45. However, the recent situation seems to have calmed the storm.
At press time, ATOM had increased 24.12% over the last 24 hours while trading at $15.79. Interestingly, there has also been an increase in volume of the Cosmos ecosystem. Per CoinMarketCap, there was an 87% rise from the previous day. But the concern is if ATOM is actually rallying independently or following the latest crypto market recovery led by Bitcoin [BTC].
Watch out
Taking a look at the on-chain metrics, it was observed that the positive and negative ATOM sentiment was almost at the same level. In fact, there was only a slight difference of 0.182 as the positive sentiment was at 9.519.
As for the negative sentiment, it stood at 9.409 according to Santiment.

Source: Santiment
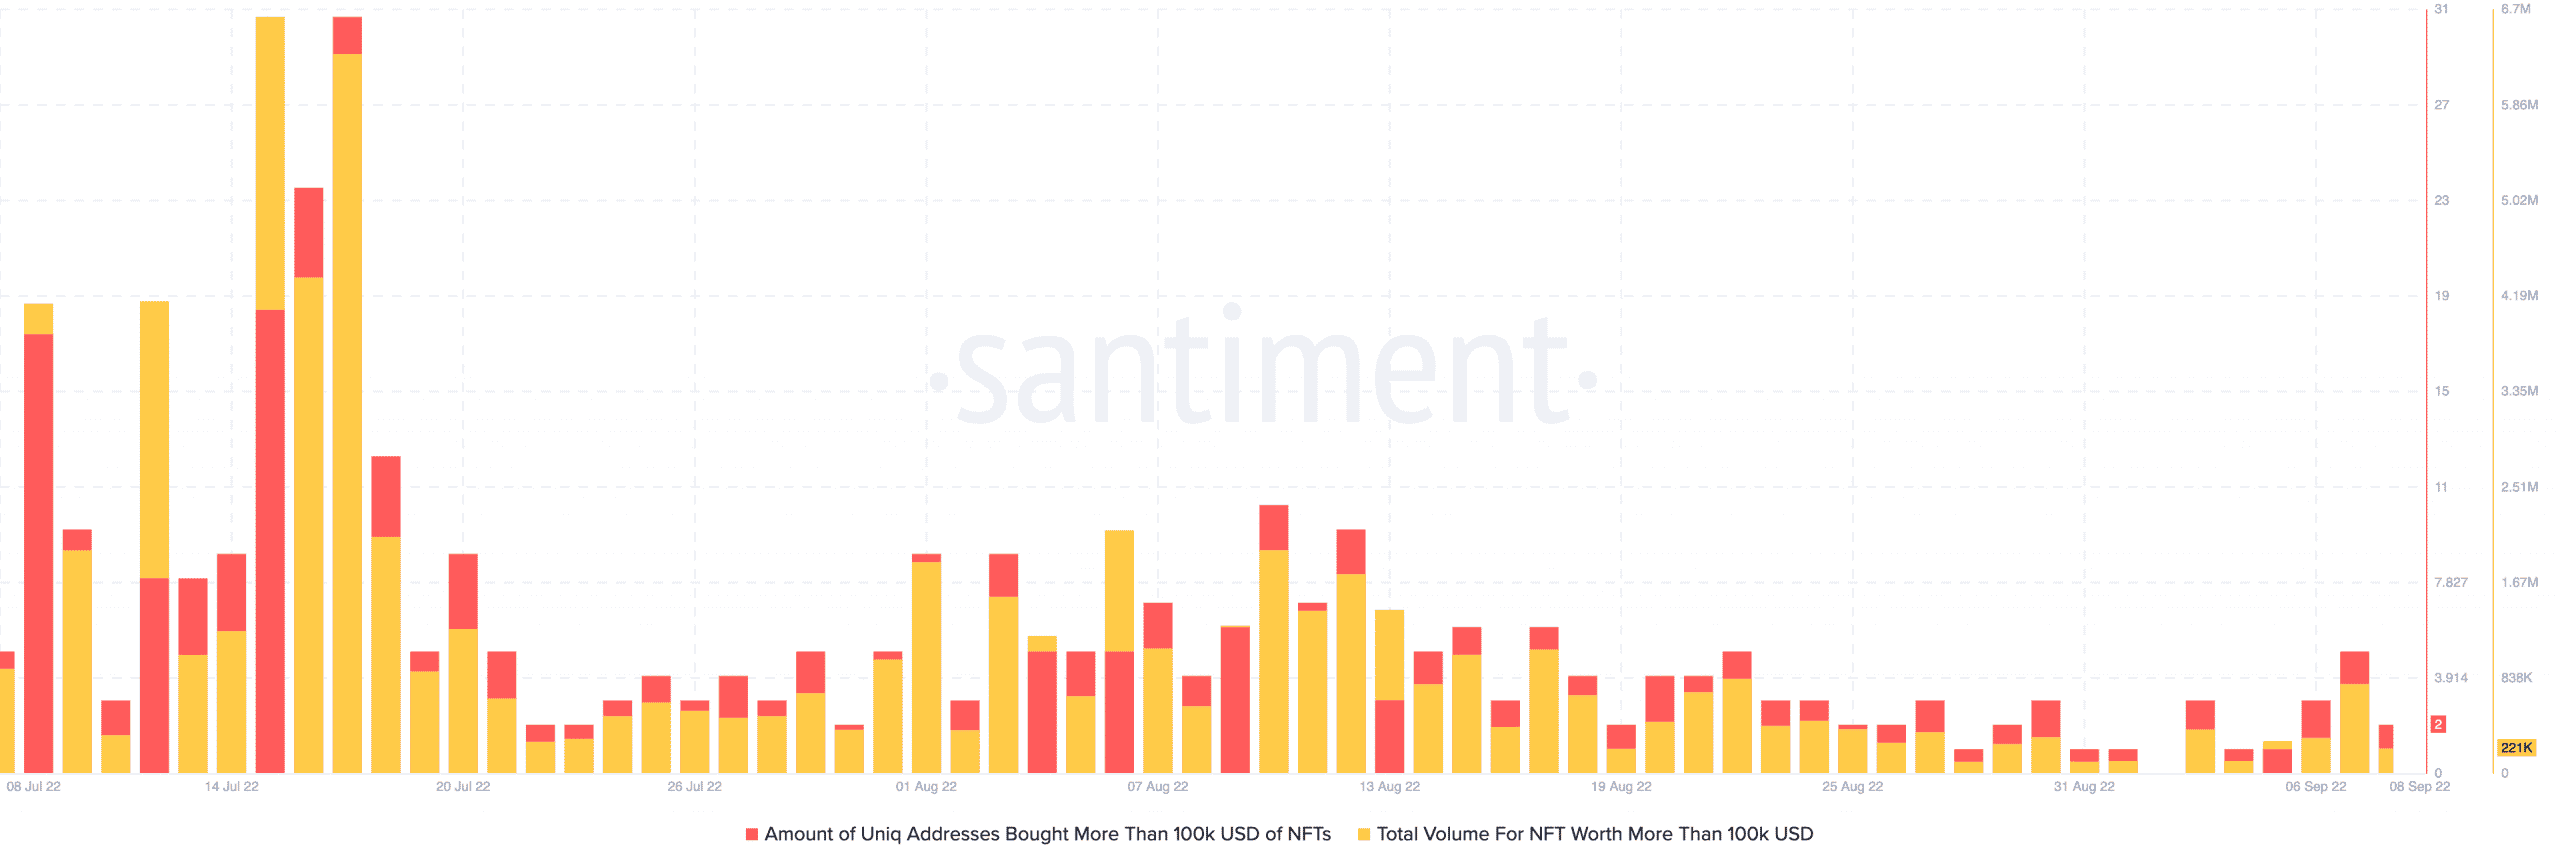
Additionally, not much has been happening across its NFT ecosystem too. However, there has been a noticeable increase lately. Santiment revealed that the total NFT volume within Cosmos picked up to $774,000 on 7 September.
The unique addresses that bought these NFTs also surged to five. However, the surprising part is that both metrics had declined in the wake of the ATOM rally. While the total NFT volume dropped to $221,000, the unique addresses at press time were only two.
Source: Santiment
Per its development activity, ATOM has been the subject of increasing numbers following the proposal to update its blockchain. But will this recent rally be unstoppable for a while or it’s a fluke?
Turn down for what?
According to the ATOM/USDT four-hour chart, the crypto may be able to sustain the green in the short term. This assertion was shown by the Exponential Moving Average (EMA). The 20 EMA (blue) was up above the 50 EMA (red). Despite the uptick, the 50 EMA seemed to be in pursuit.
As for the long term projection, the 200 EMA (cyan) revealed that ATOM could drop back to new lows in the forthcoming months as it was nowhere near the short term indicators. Besides, ATOM investors may need to watch out for the volatility.
Based on the reflection from the Bollinger Bands (BB), the ATOM price increase has been followed by extremely high volatility. So, expecting a downturn in no time may be an option if investors were to play it safe.
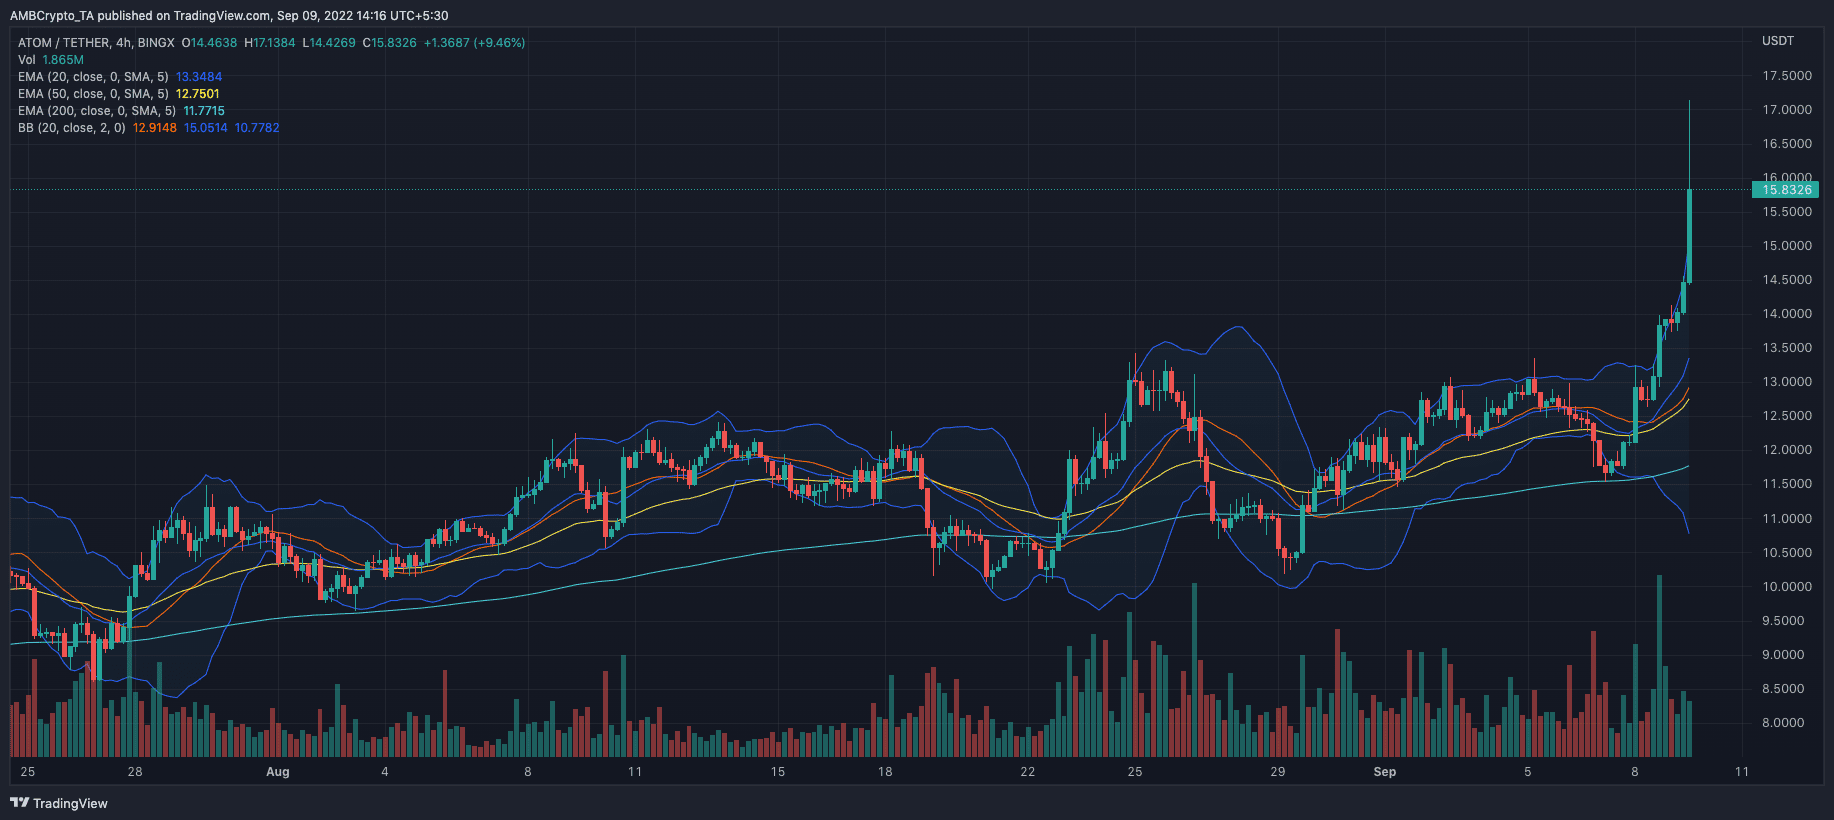
Source: TradingView