Why this is a make or break moment for Polkadot

Disclaimer: The findings of the following analysis are the sole opinions of the writer and should not be taken as investment advice
Inching closer to the neckline of a head and shoulders pattern, Polkadot seemed to be primed for a near-term decline. As short sellers rubbed their hands in anticipation of a breakdown, DOT had only a small window to flip this bearish setup.
Buyers would be looking to get in on a triple bottom at the 50% Fibonacci level and trigger a run-up to $32.6, thereby negating the pattern.
At the time of writing, Polkadot was trading at $27.7, up by 1% over the last 24 hours.
Polkadot 4-hour Chart
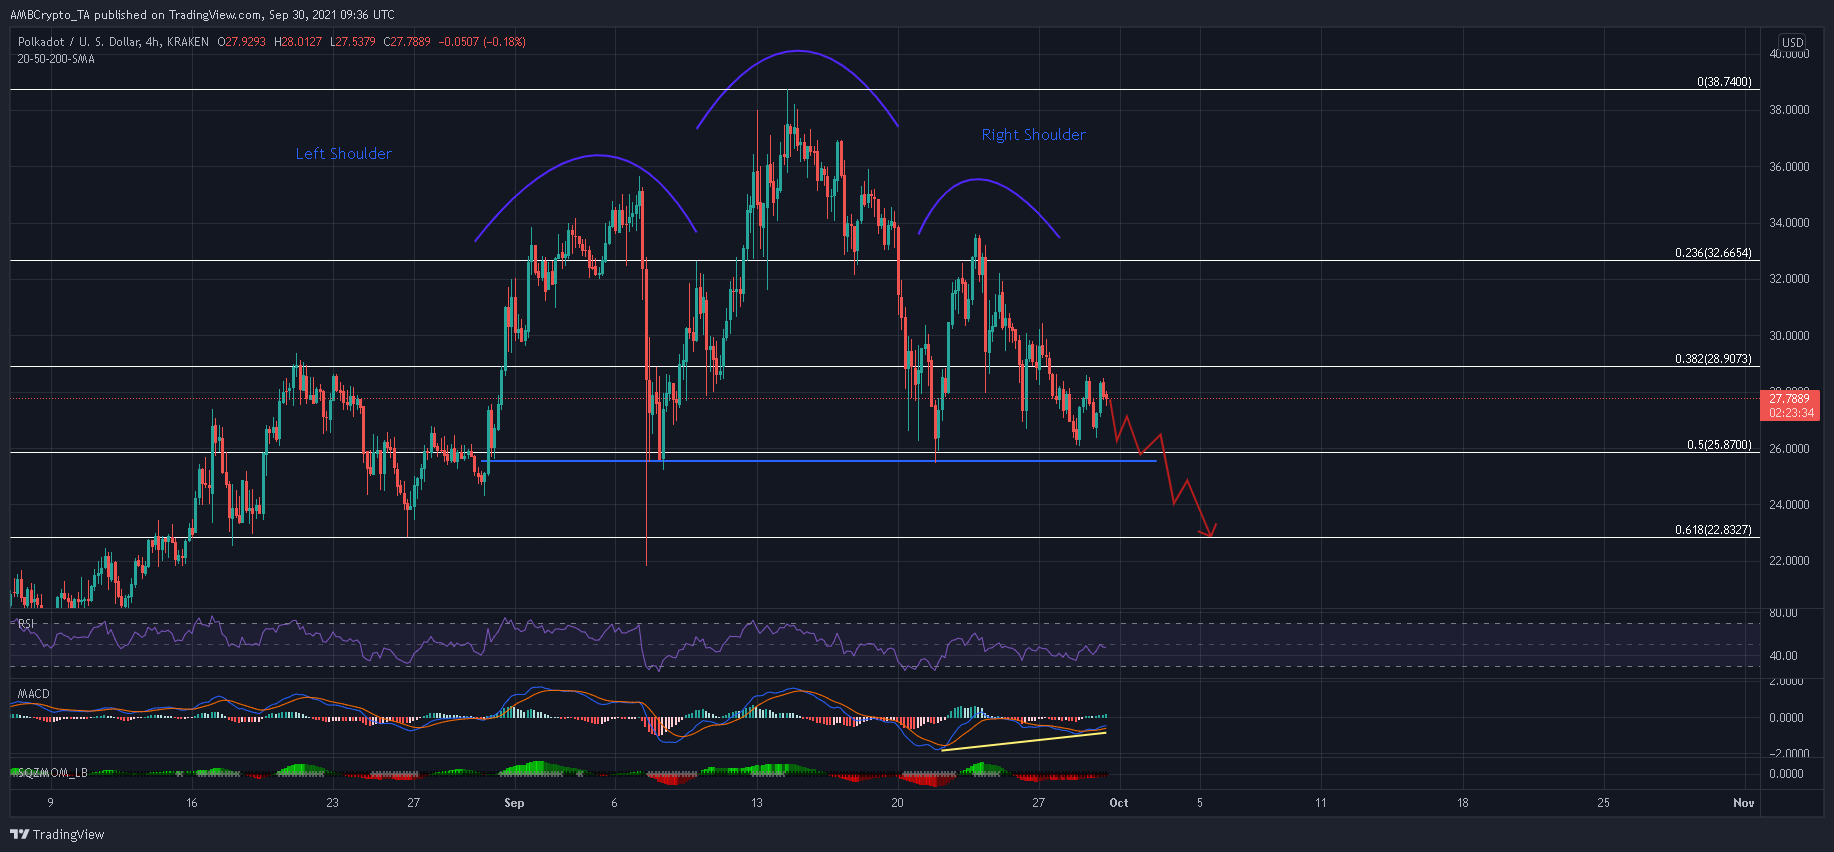
With Polkadot retracing after forming its right shoulder, another attack on the neckline looked imminent. A close below the 50% Fibonacci level, which clashed with the neckline, would allow bears to puncture through to $23 before any countermeasures are taken.
Meanwhile, bulls would look to respond within the golden Fibonacci retracement zone and gather pace for an uptrend. A close above the 38.2% Fibonacci level on strong volumes would put bulls back in the hunt for higher price levels.
Conversely, DOT will hope that a triple bottom around $24.5 would be able to generate a huge amount of buying pressure to flip this outcome. From there, a close above the 23.6% Fibonacci level would alleviate many market uncertainties. This optimism came via the Squeeze Momentum Indicator’s recovery.
Reasoning
According to the Squeeze Momentum Indicator, selling pressure has been gradually receding. Buyers should be on the lookout for the first green bar, followed by ‘white dots,’ suggesting a pickup in volatility. Higher peaks and a bullish crossover on the MACD also lent weight to a favorable outcome.
However, some observers would be reluctant to go long till the RSI recovers above 55. By foregoing some gains, a safer bet can be placed once when the RSI pierces bullish territory.
Conclusion
Now, despite some reasons to be optimistic, DOT still stared down the barrel of a head and shoulders breakdown. A decisive close below the 50% Fibonacci level can trigger an instant 11.5% decline without any bullish intervention.
Meanwhile, bulls should hope that selling pressure fizzles out as DOT keeps its neck above $25.5. A triple bottom seemed to be DOT’s best chance of overcoming this bearish setup.