Why ‘we’ll never see these’ Bitcoin price levels again

Bitcoin cannot be predicted is the one thing everyone knows. But can Mathematics actually turn that notion around? Popular analyst Crypto Capital Ventures used the concept of Fibonacci also known as the golden spiral in studying the past movement of the king coin. This helped us figure out where, according to these tools, BTC could go and how soon could that be.
Bitcoin meets Maths
The golden spiral or the Fibonacci is an extraordinary phenomenon occurring throughout nature, art, music, and even numbers. This is used by various professions such as artists, architects, musicians, and now by traders as well. BTC formed a consistent pattern of price movement within said spiral and continued to do so even at the moment.
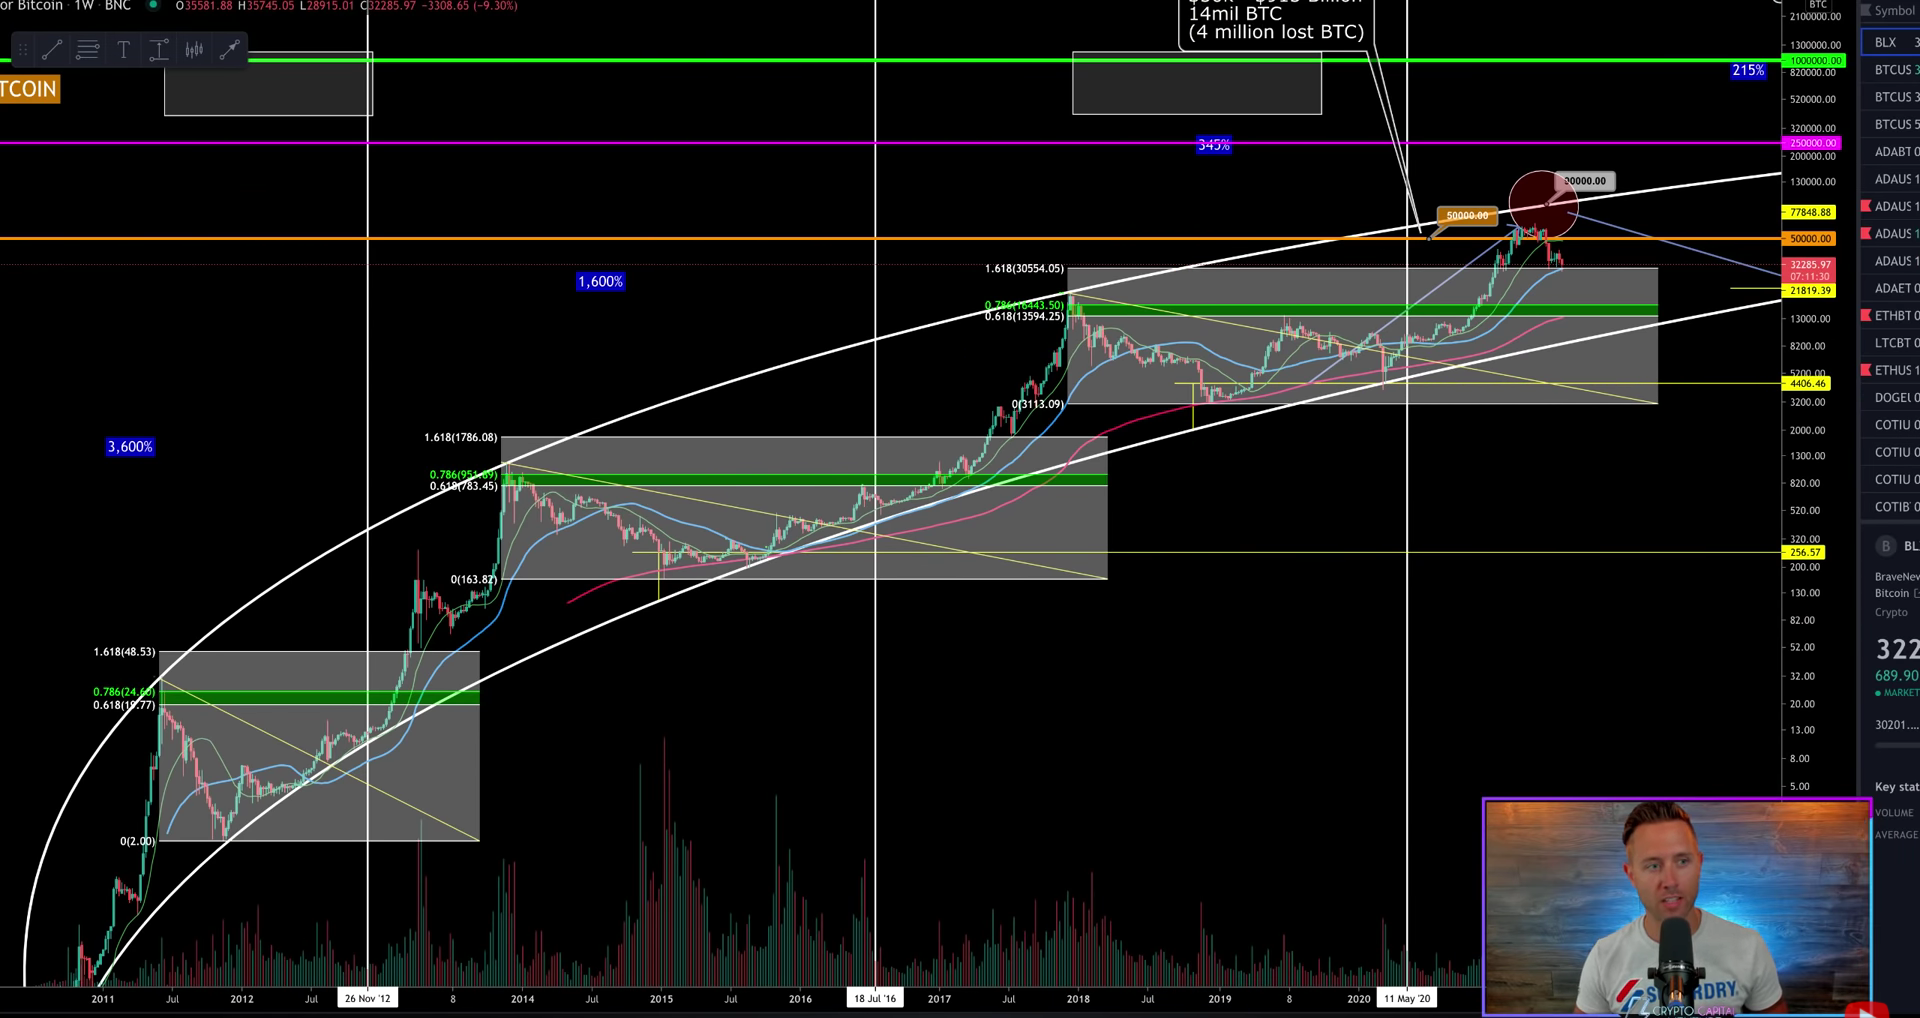
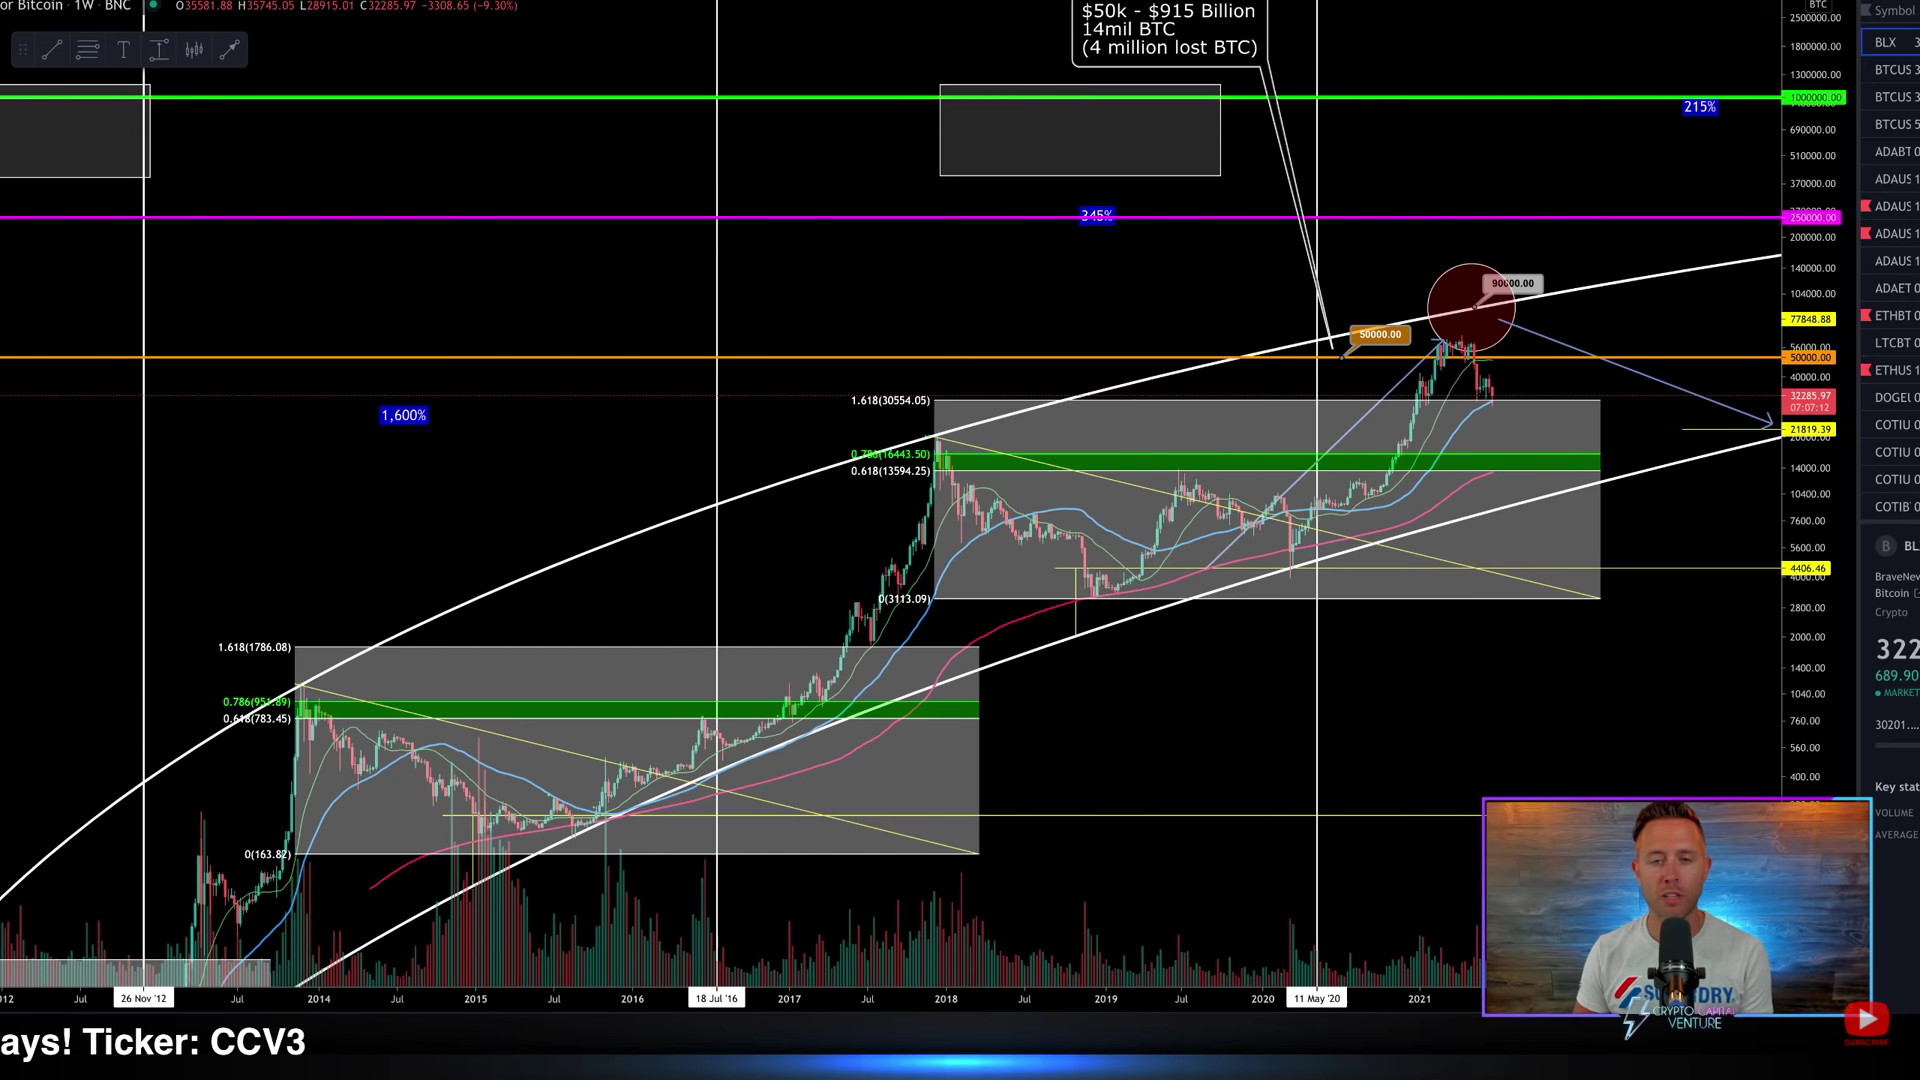
This movement has been consistent since 2012 despite all the volatility. The long-term trajectory displays repeated trends of bear market lows and bullish highs within the same structure at similar points. Closer observation shows that the Fibonacci bull market doors (green rectangle zones) were breached every time after every halving. First in Nov. 2012, second time around July 2016, and most recently on May 15, 2020.
If the Fibonacci levels are considered, historically, once BTC leaves the bull market doors it does not revisit the same levels again. The 1.618 Fibonacci level acts as support briefly before BTC bounces off of it to rally ahead. At the moment, bull market doors are established in the $13,000 – $16,000 range. Also, according to the previous bull market lows, $26,500 is key support considering a long-term price action. Crypto Capital Ventures stated,
“Charts suggest that Bitcoin is in the middle of the bull market and we’ll never see these ($26.5k – 16k) price again.”
If Bitcoin’s movement, going ahead, remains consistent with its historical data, then the king coin will probably never revisit this range.
Short-term price activity
Talking about the short-term implications of Fibonacci, some interesting zones were highlighted. Taking the lower swings and the higher highs into account, Fibonacci depicts some critical as well as actively tested areas. $31,000 – $30,000 is an important support range in the short run. Resistance zone comes up to $33,000 – $34,300.