Will Bitcoin [BTC] close 2022 at a price bottom? These analysts believe…
![Will Bitcoin [BTC] close 2022 at a price bottom? These analysts believe...](https://ambcrypto.com/wp-content/uploads/2022/12/shubham-s-web3-QM91Pbw1b7c-unsplash-1.jpg)
- CryptoQuant analysts have found that at its current price, BTC’s bottom is in.
- The on-chain assessment revealed the re-entry of “smart money” into the market.
After trading momentarily above the $18,000 price mark, Bitcoin’s [BTC] price rebounded to exchange hands below $17,500 after the Federal Reserve raised the federal funds rate by 50 basis points (bps) at its meeting on 14 December.
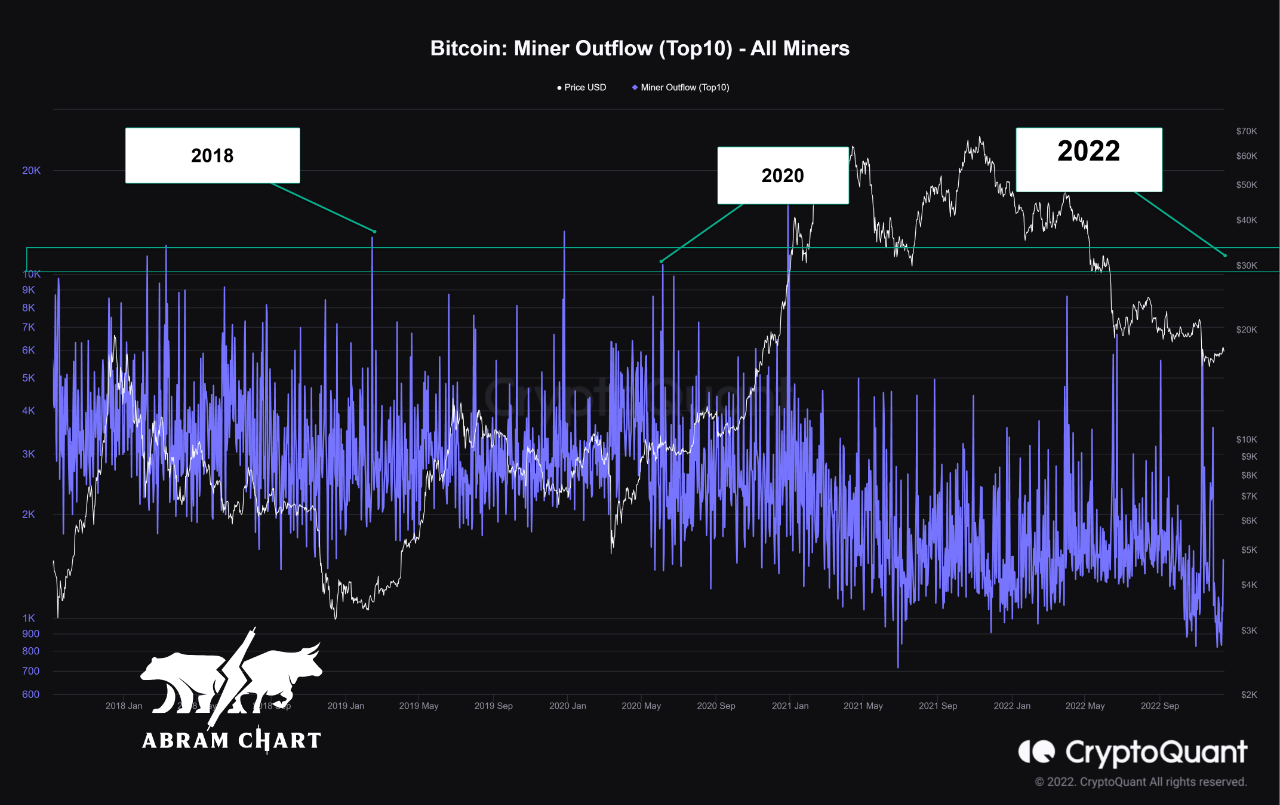
The decline in the price of the king coin after the Feds’ meeting coincided with the surge in the cost of mining on the BTC network. According to CryptoQuant analyst Abramchart, while BTC traded below the $18,000 price region, the cost of mining one BTC reached $19,463, indicating that miners at work on the BTC network mined at a loss.
Read Bitcoin’s [BTC] Price Prediction 2023-2024
Abramchart assessed BTC’s historical performance based on this and opined that the bottom might be in. According to the report, the analyst found a historical correlation between the periods when miners mined BTC at a loss and when BTC logged a price bottom.
“The loss of miners began since June 12, 2022, when bitcoin reached $26,700, and the cost of mining one bitcoin at that time reached $29,450. The same movement appeared at the bottom of March 2020, the cost price of mining was higher than the value of Bitcoin and also the bottom of 2018,” Abramchart said.
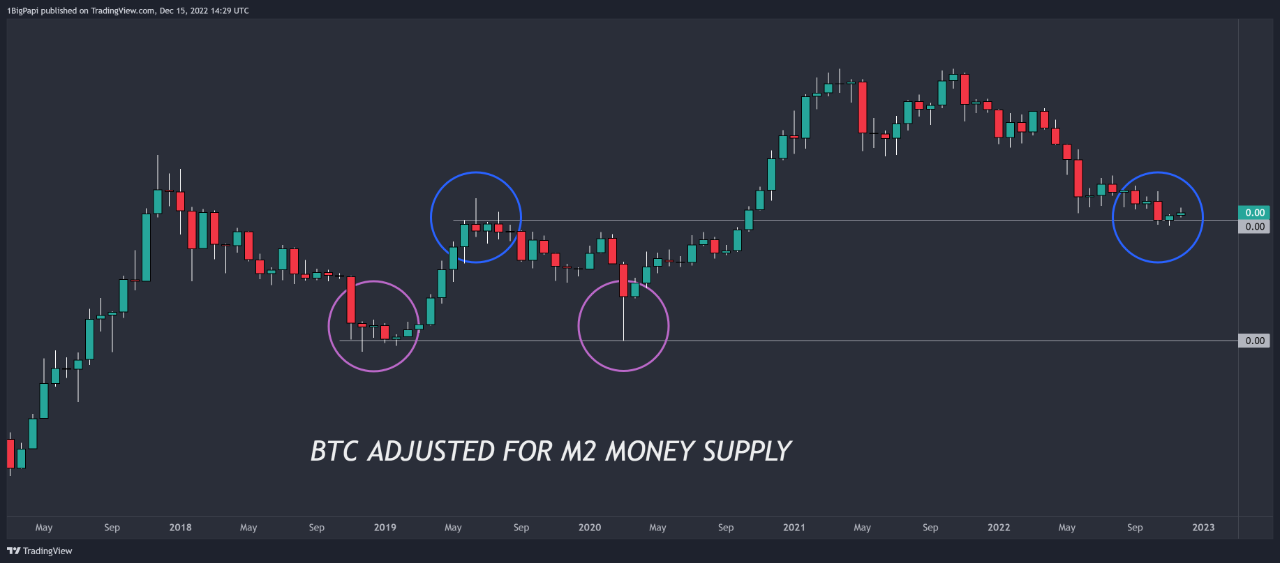
Another CryptoQuant analyst MrPapi, shared the same opinion. He conducted a BTC price adjustment for money supply in the past few years and also concluded that the “floor is in.”
Due to the impact of COVID-19 in the last two years, the United States government had to print more money to cushion the economic stress on its people. According to MrPapi, an adjustment of BTC’s price chart for the increased money supply revealed a correlation between the current BTC cycle and that of 2019.
“Using this chart, it suggests the floor was in between $15k and $17k,” MrPapi concluded.
New money, stronger hands
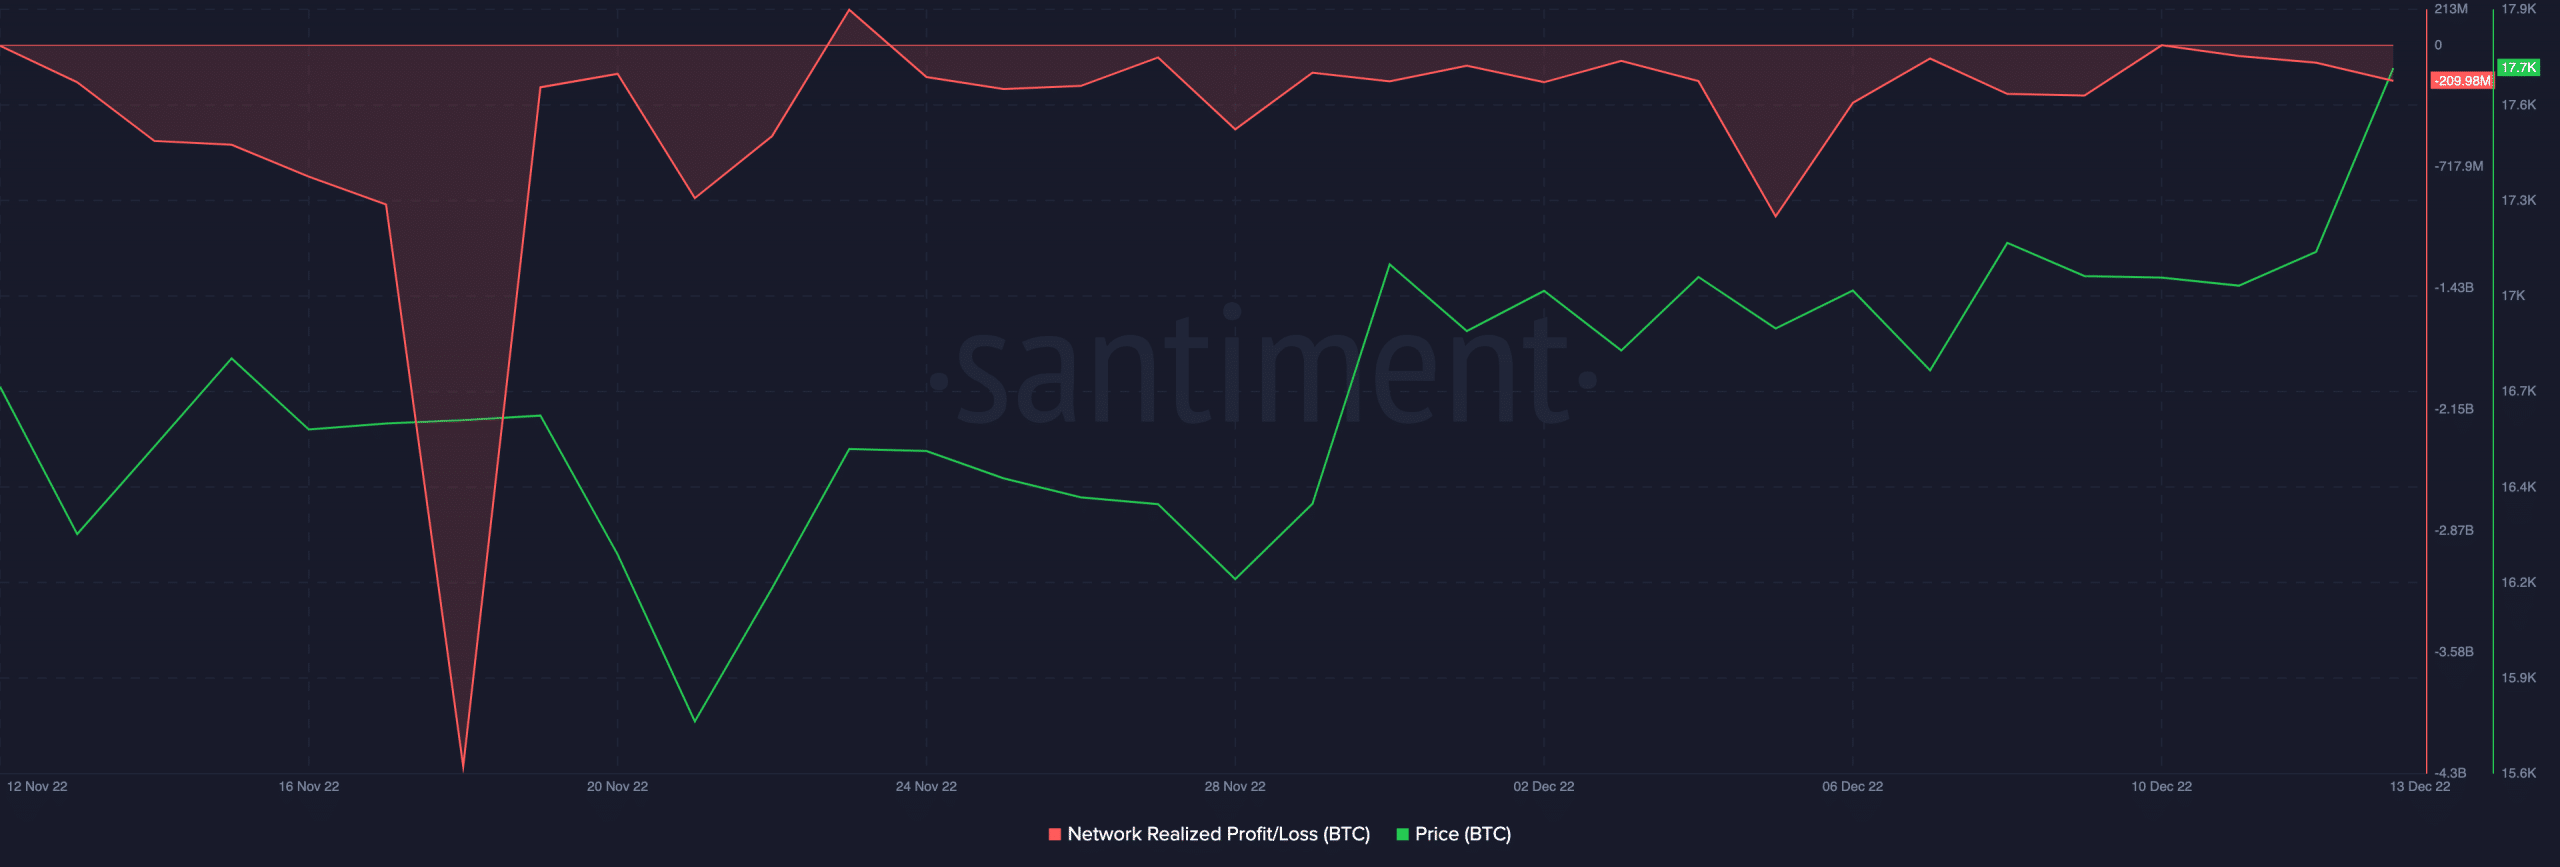
An on-chain assessment of BTC’s Network Profit and Loss ratio (NPL) revealed the re-entry of new demand towards the end of November. Data from Santiment showed a significant dip in BTC’s NPL ratio on 18 November, after which its price went up.
NPL dips are often seen as indicators of a short-term sell-off by less confident investors, known as “weak hands,” and the return of more strategic investors referred to as “smart money.” These dips are often followed by a rebound in price and a period of recovery.
With increased whale accumulation and increased favorable macro conditions we gear up to close Q4 2022. Well, it might sustain a further rally in the value of the leading coin in 2023.