Will BTC repeat history amid DOGE witnessing its most recent rally

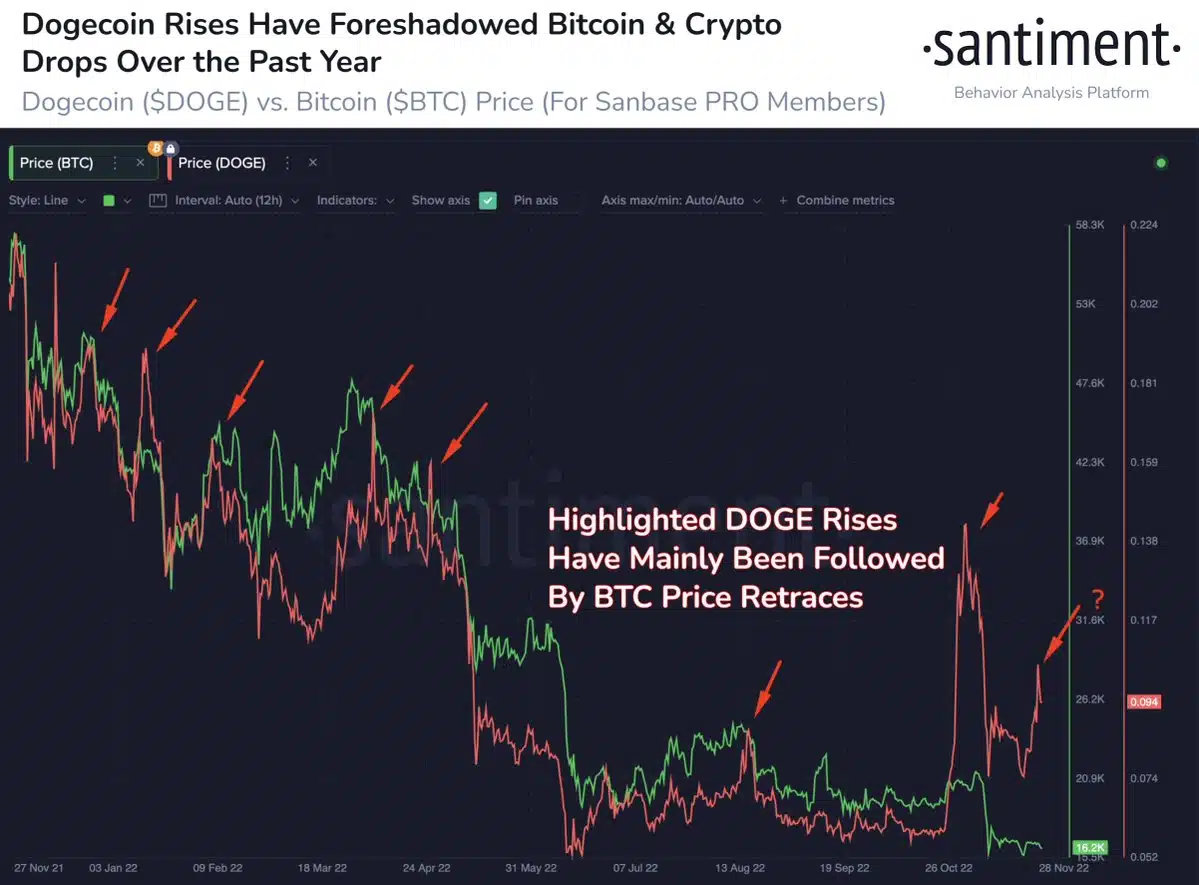
- On-chain data showed that growth in DOGE’s price is usually followed by a fall in BTC’s price
- Analysts found that BTC might see a further price drawdown
While the recent jump in Dogecoin’s [DOGE] price might mean well for its holders, its rally may spell doom for the price of leading coin, Bitcoin [BTC].
According to cryptocurrency price tracking platform CoinMarketCap, the memecoin’s price grew by 37% in the last week. This put DOGE atop all other cryptocurrencies as the asset with the most growth in the last seven days.
Read Dogecoin’s [DOGE] Price Prediction 2022-2023
According to Santiment, a hike in DOGE’s price is a “reliable reflection of crowd euphoria,” and major spikes in the meme coin’s price can be “useful to foreshadow upcoming #Bitcoin drops.” In 2021, on-chain data revealed that each time DOGE’s price rallied, a corresponding BTC price decline followed.
So, is the king coin primed for another fall?
Increased Bitcoin accumulation
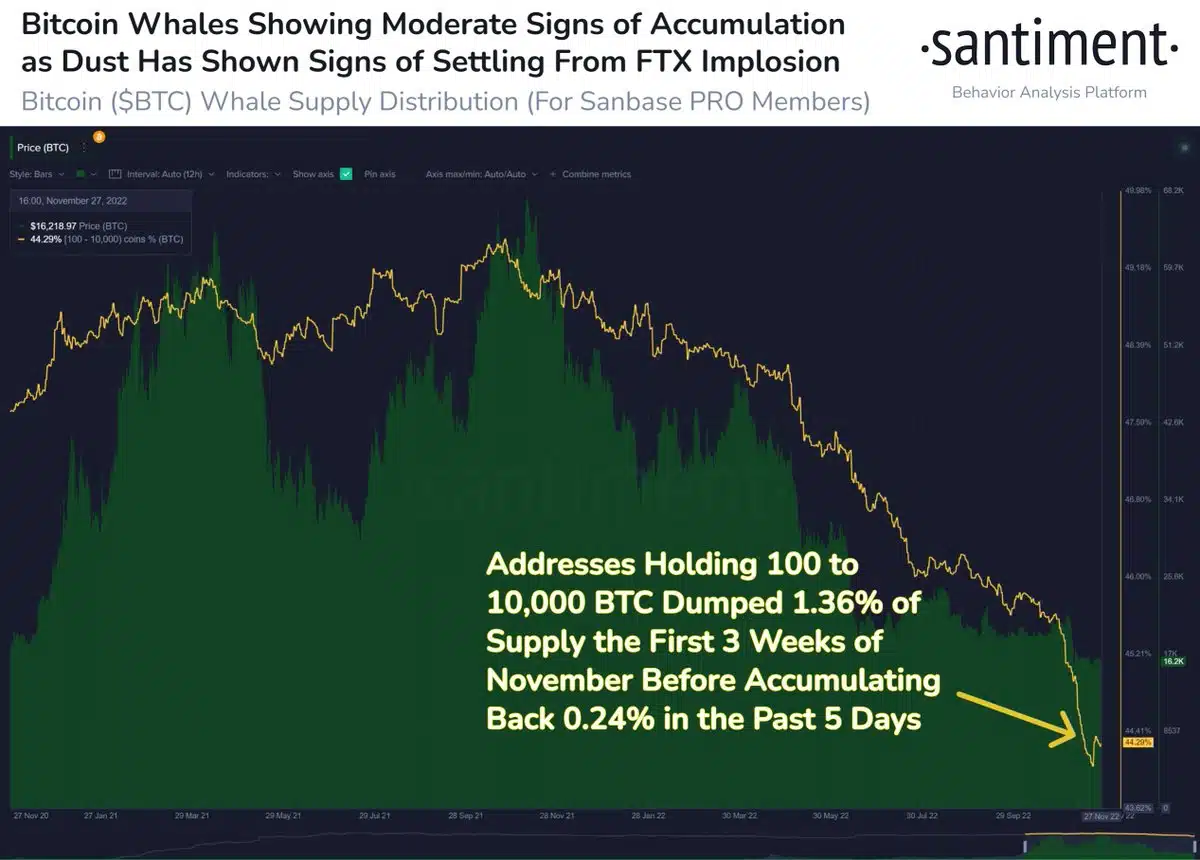
As the general cryptocurrency market recovered from the sudden fallout of cryptocurrency exchange FTX, data from Santiment revealed a steady growth in whale accumulation. Additionally, FTX’s unexpected collapse caused BTC addresses holding 10 to 10,000 BTC to dump 1.36% of the coin’s total supply in the first three weeks of this month.
However, as the market cooled off following FTX’s demise, this cohort of BTC holders restarted their coin accumulation. According to data from Santiment, holders of 10 to 10,000 BTC accumulated over 47,000 BTC in the last five days. This made up over 0.24% of the 1.36% previously dumped.
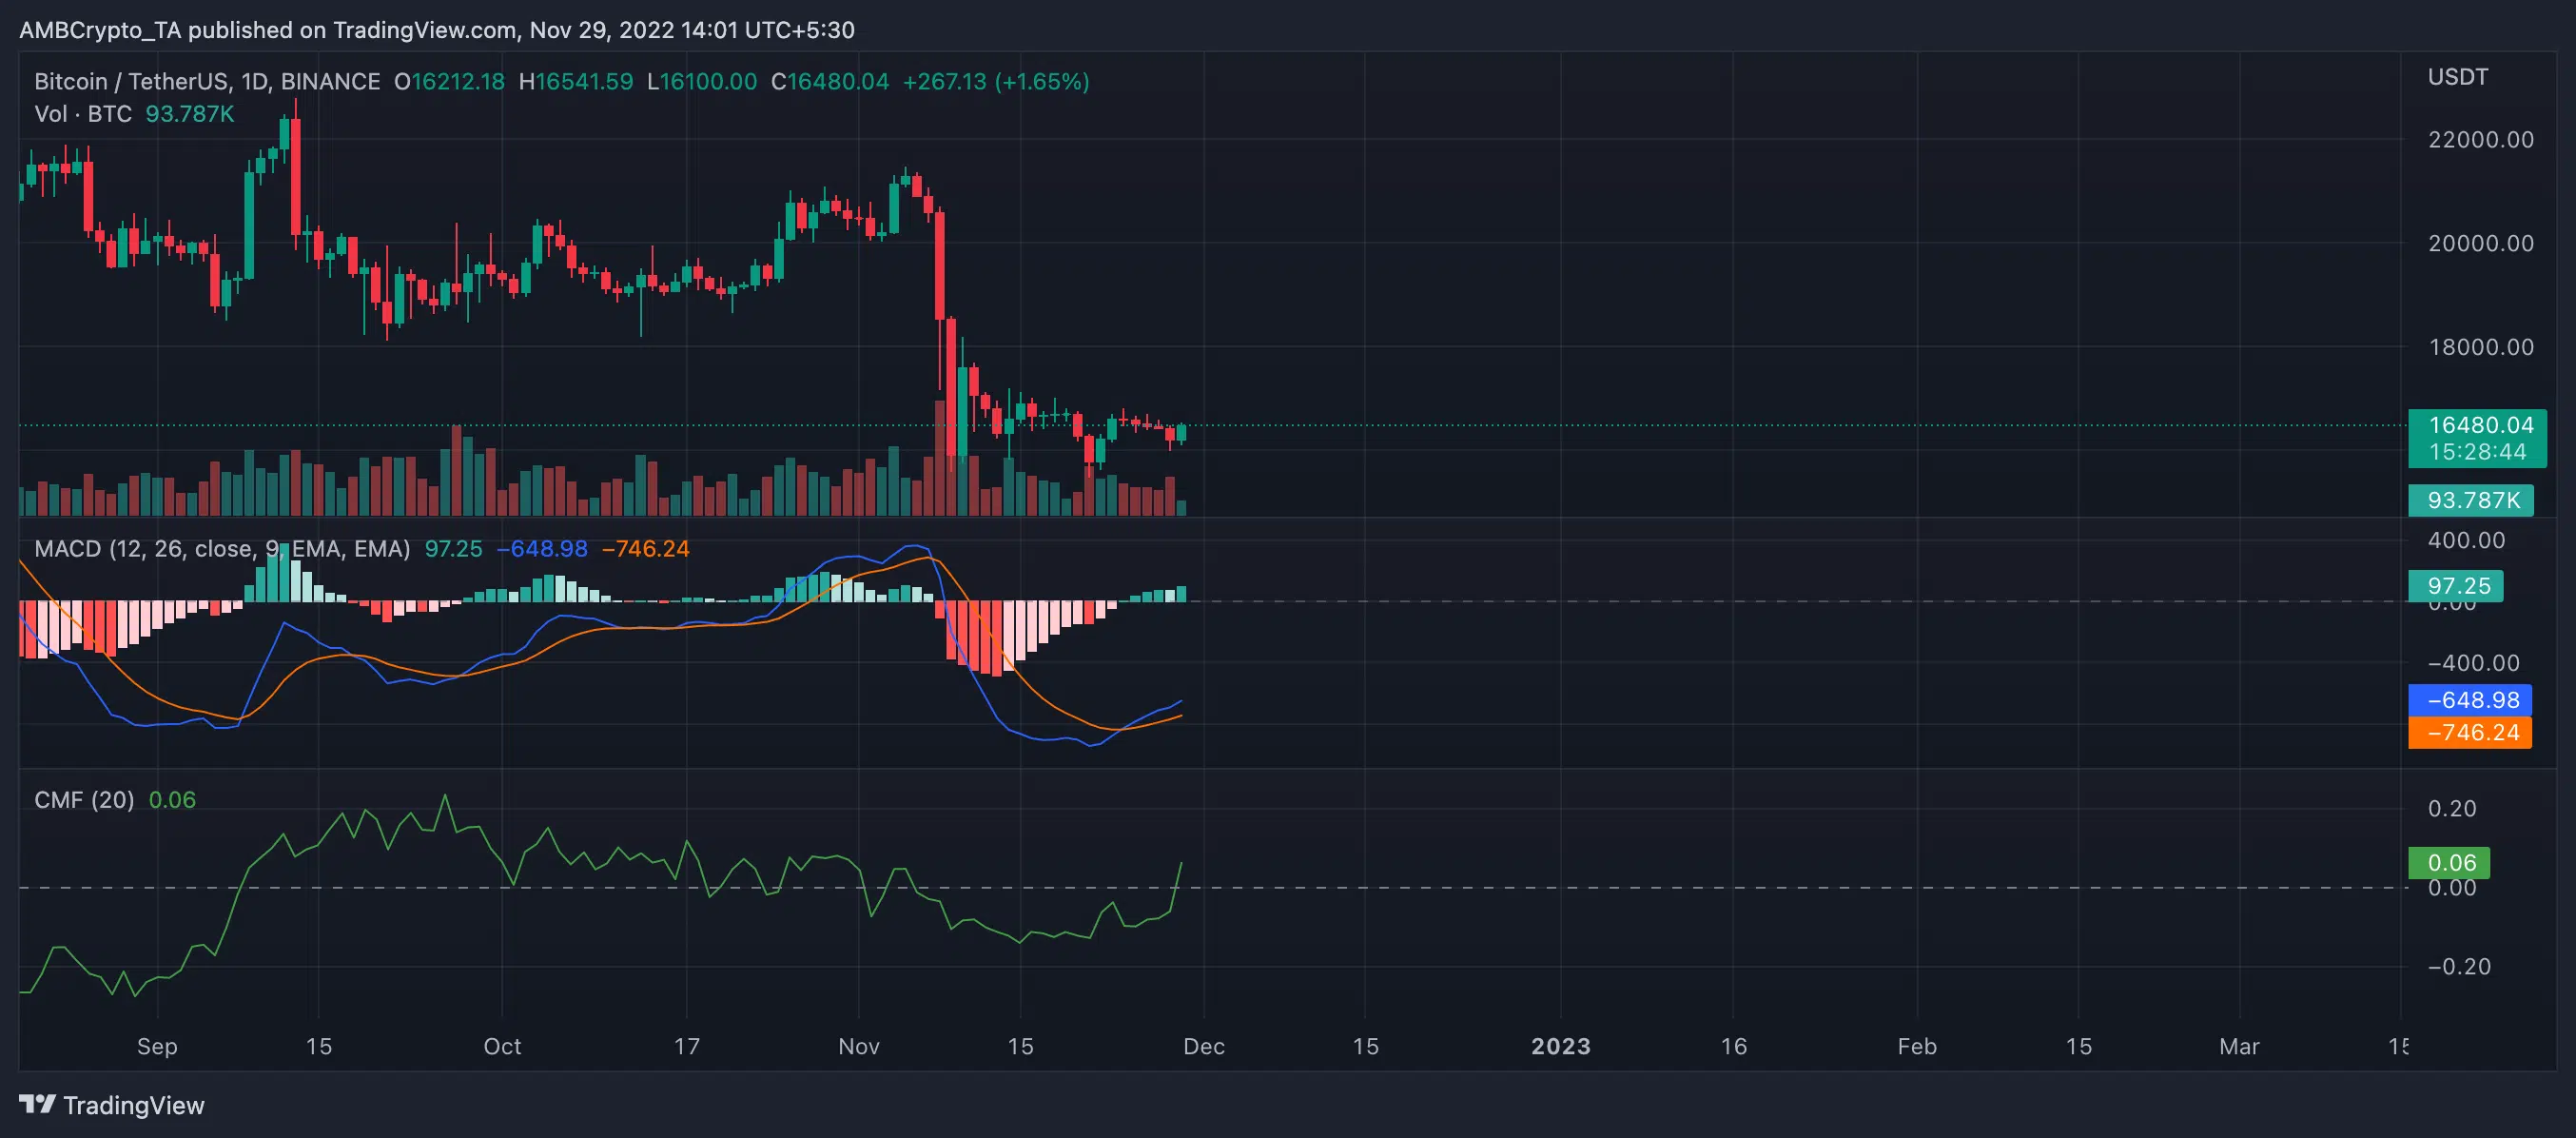
A look at BTC’s performance on the daily chart revealed that the king coin commenced a new bull cycle on 23 November. The Moving Average Convergence Divergence (MACD) line intersected with the trend line, and the price rallied by 2% since then. In addition, the dynamic line (green) of BTC’s Chaikin Money Flow (CMF) was spotted at 0.06, indicating climbing coin accumulation.
Hold your horses
While the last few weeks have been marked by increased coin accumulation (which is usually a precursor to a price rally), a CryptoQuant analyst believes that the king coin might see a further decline in price.
According to analyst ghoddusifar, BTC formed a down-sloping pennant pattern on 27 November. He believed that this pattern, while not common, is “usually associated with the continuation of the downtrend.” As a result, Ghoddusifar advised investors to wait for a breakout before making any trade decision.
Ghoddusifar further found that the price stopped declining during BTC’s last bear cycle in December 2018, when the coin reached the Stock To Flow level of the previous cycle. He stated:
“In fact, the previous Stock to Flow acted as a support and target level for Bitcoin at that time. Once again, Bitcoin is approaching its previous cycle’s stock-to-flow price. It is possible that this price (which is around 8,000 to 11,800 dollars) will serve as the target and the return point of Bitcoin (like the previous cycle).”


