Will Ethereum [ETH] cross $2,000 this week? Refer to these indicators
![Will Ethereum [ETH] cross $2,000 this week? Refer to these indicators](https://ambcrypto.com/wp-content/uploads/2023/04/ETH.png)
- Ethereum’s price increased by more than 5% in the last 24 hours.
- Most of the market indicators and metrics supported the possibility of further growth.
Investors woke up to the good news on 5 April as the crypto market turned quite bullish, allowing multiple cryptocurrencies to push their prices upward.
Ethereum [ETH] was capitalizing on the market trend, it crossed the $1,900 mark. For the first time since August 2022, Ethereum was able to climb back over $1,870, giving hopes for further growth
🦈📈 #Ethereum jumped back over $1,870 today for the first time since August 17, 2022. This near 8-month high comes as sharks have been accumulating steadily since last summer. Addresses holding 100-10k $ETH have accumulated $4.24B in the past 9 months. https://t.co/leyQqlbvED pic.twitter.com/b5YazPfSO5
— Santiment (@santimentfeed) April 4, 2023
Read Ethereum’s [ETH] Price Prediction 2023-24
Ethereum’s price action caught the attention
CoinMarketCap’s data revealed that ETH managed to increase by more than 5% in the last 24 hours and also over the last seven days.
At the time of writing, it was trading above the $1,900 mark, at $1,910.97, with a market capitalization of over $230 billion. Considering the market conditions, the crypto community expects Ethereum to cross the $2,000 benchmark soon.
Will ETH surpass the $2k hurdle?
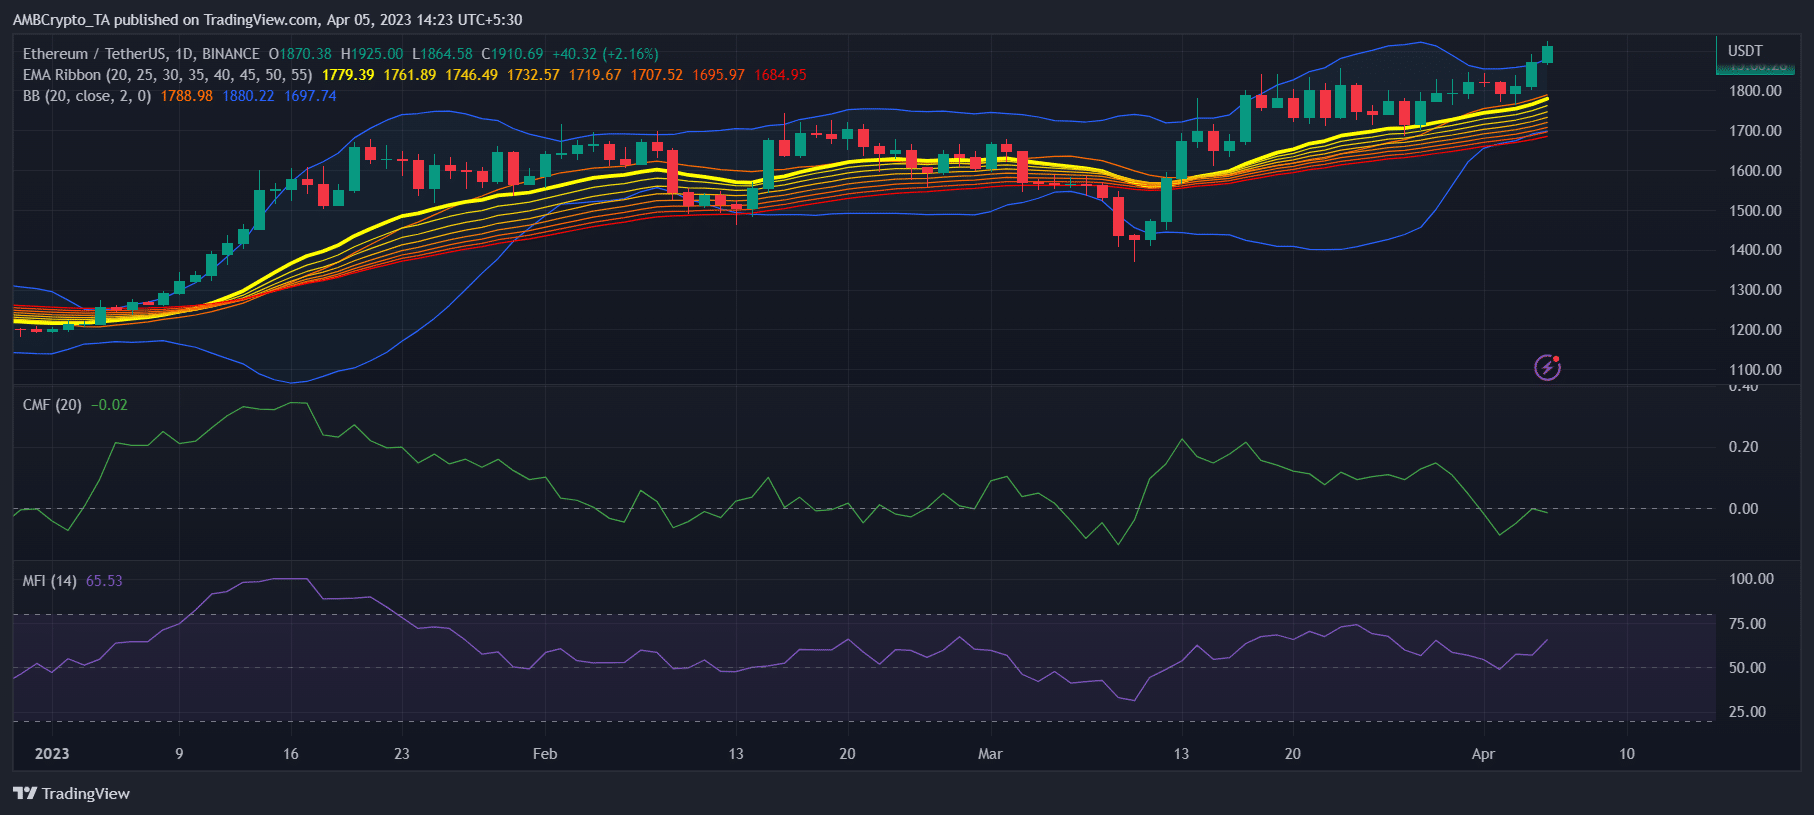
A look at ETH’s daily chart suggested that the bulls were ready to further push the king of altcoins upwards. For example, the Exponential Moving Average (EMA) Ribbon revealed buyers’ advantage in the market as the 20-day EMA was well above the 55-day EMA.
ETH’s Money Flow Index (MFI) was moving further upward from the neutral mark, which was also a bullish indicator.
However, the Chaikin Money Flow (CMF) did not behave according to the will of the bulls as it registered a downtick. The Bollinger Bands also looked troublesome as it revealed that ETH’s price was entering a less volatile zone, which can restrict the token’s price from increasing exponentially in the short term.
How much are 1,10,100 ETHs worth today
ETH has a long road ahead?
Though the Bollinger Bands suggested that investors can expect a few slow-moving days, Ethereum’s on-chain metrics told a different story.
ETH’s net deposits on exchanges were low compared to the 7-day average, which indicated that the token was not under selling pressure.
Additionally, the total number of active wallets used to send and receive coins also increased by 25.83% compared to the previous day.
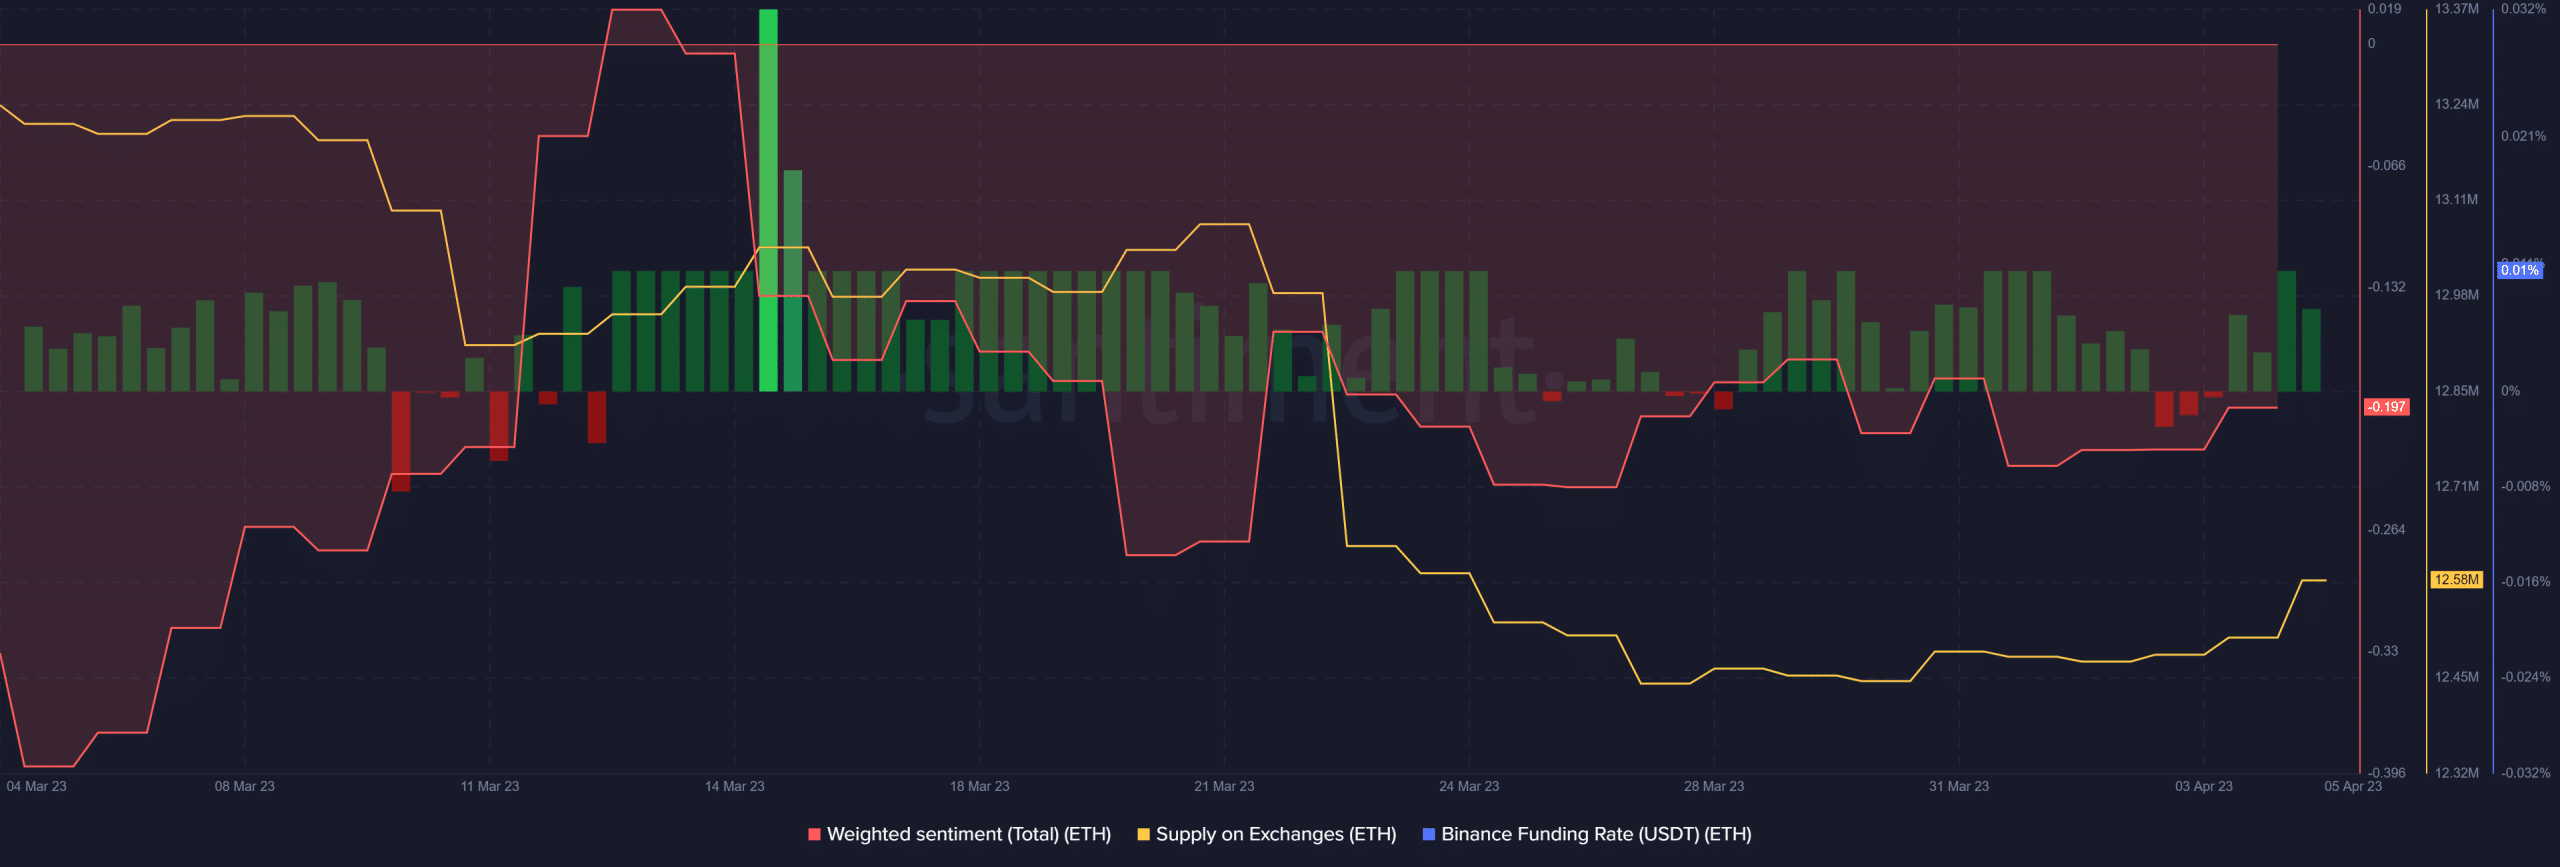
Moreover, as per Santiment’s chart, ETH’s weighted sentiment improved over the last month, reflecting investor confidence in the token. This was achieved even though the network fell victim to an attack recently, in which the attacker stole a substantial amount of ETH by interfering with MEV bot transactions.
Ethereum’s demand in the derivatives market was also high, which was pretty evident from its Binance funding rate. Another optimistic metric was its supply on exchanges, which declined considerably over the last 30 days.
Therefore, taking into account all the metrics and indicators, it seemed likely for Ethereum to cross the $2,000 mark soon.