With Litecoin steady at $68.23, can the LTC bulls breach this critical resistance?

- LTC had a price pullback at $68.23
- LTC could face further rejection in the $68.89-$69.55 area if it moves above $68.23
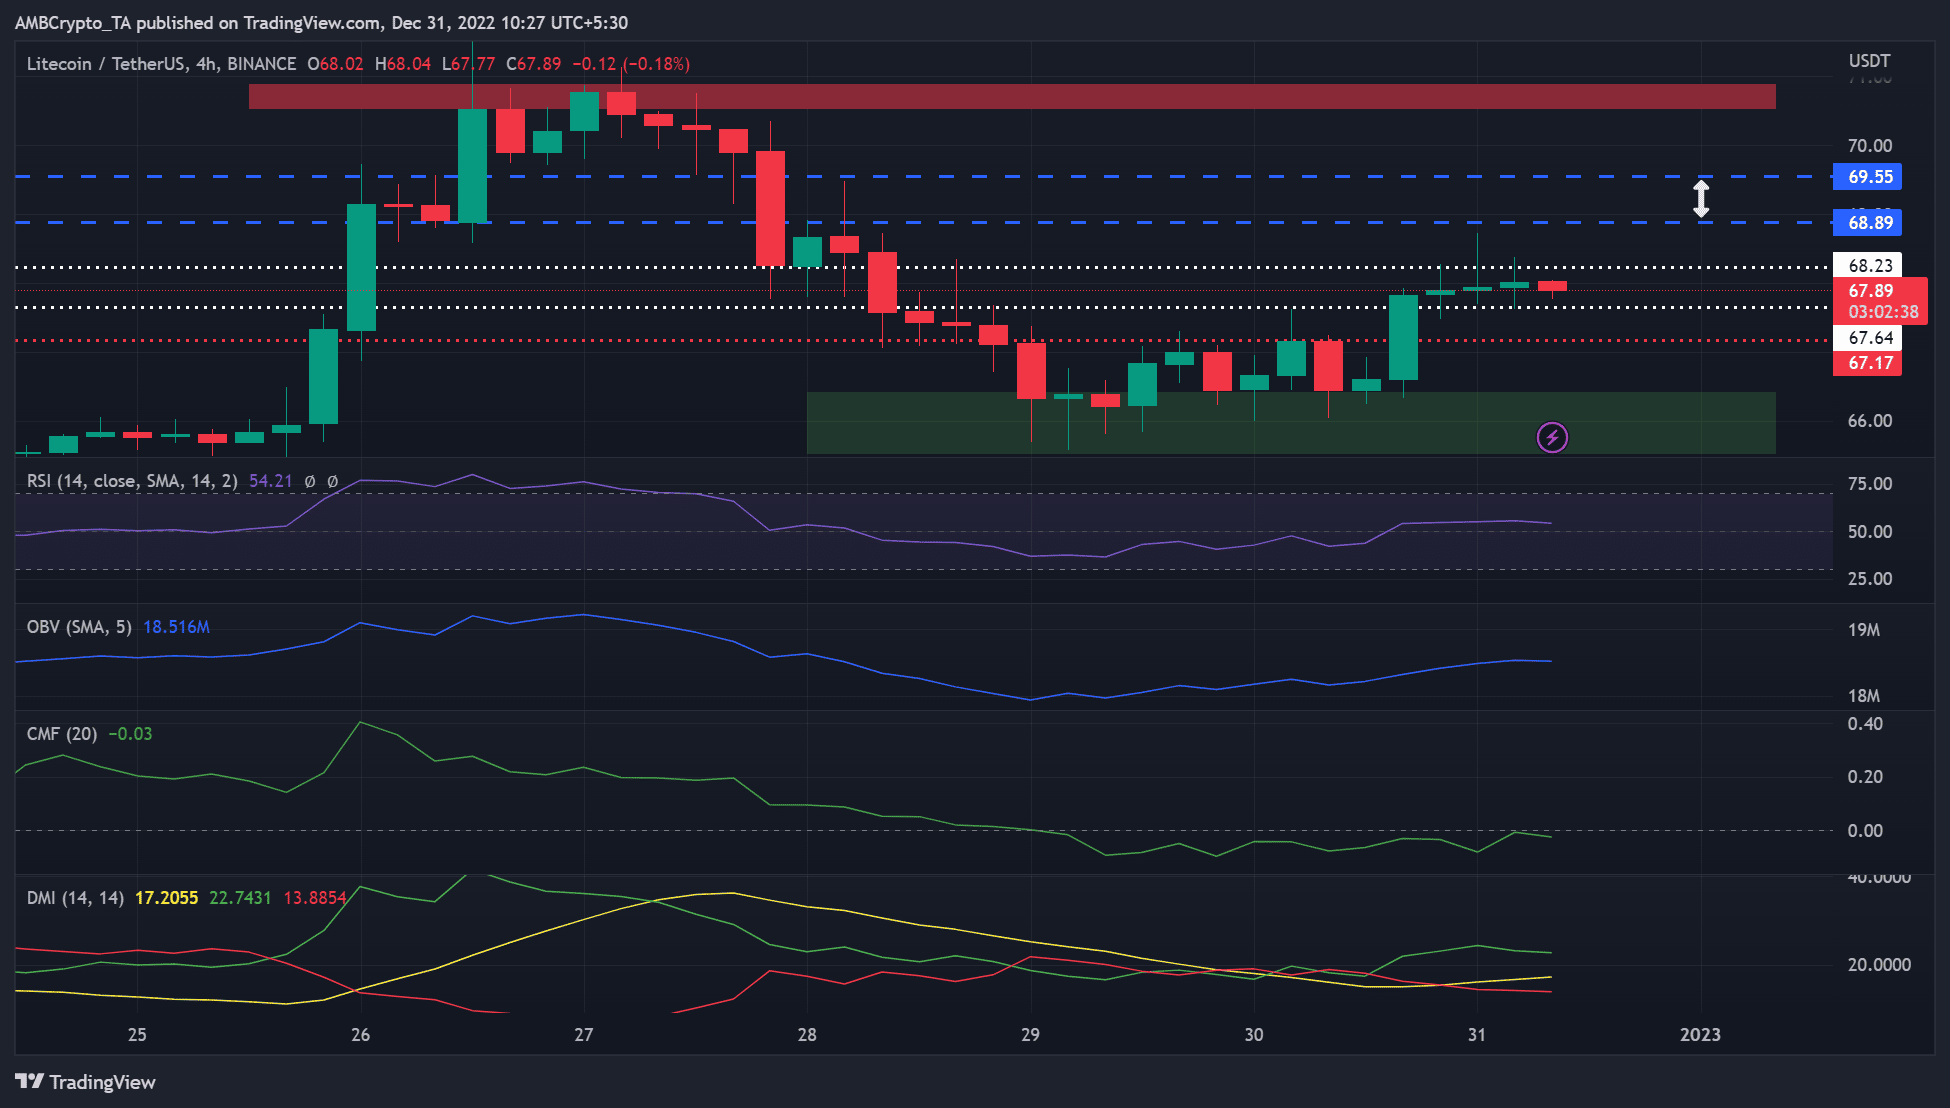
TradingView’s four-hour chart showed that Litecoin [LTC] had rallied since 29 December, with occasional corrections. However, it faced a key price rejection at $68.23, which blocked any further uptrends.
Read Litecoin’s [LTC] Price Prediction 2023-24
LTC fell below $68.02 after Bitcoin [BTC] plunged to $16.57k, suggesting that investors should watch BTC’s performance before trading.
At press time, LTC was trading at $67.89. However, it could break out above the immediate rejection level at $68.23 if the bulls gained momentum.
The $68.23 hurdle: Can LTC bulls overcome it?
LTC could break the immediate hurdle at $68.23, as suggested by technical indicators at the time of writing.
The Relative Strength Index (RSI) was consistently above the midpoint but close to it. It showed that buying pressure increased but met resistance from sellers.
Accordingly, the Directional Movement Index (DMI) showed that buyers dominated the market, although they did not have absolute leverage, as their influence was 22 – less than the 25 required for definitive leverage.
The On-balance Volume (OBV) had accelerated; thus, there was an increase in trading volume and enhanced buying pressure.
Therefore, LTC might break the $68.23 level in the coming hours/days. However, it might be difficult to overcome the critical resistance area between $68.89 and $69.55 in the same period.
However, a break below $67.17 would negate the above bullish forecast. Such a downward move could settle on the buy zone around $66.
Investors can track the Chaikin Money Flow (CMF) breakout above the zero mark. A convincing break above zero would indicate strong upside momentum and signal that LTC could overcome the $68.23 hurdle.
LTC saw flat development activity and a decline in active addresses
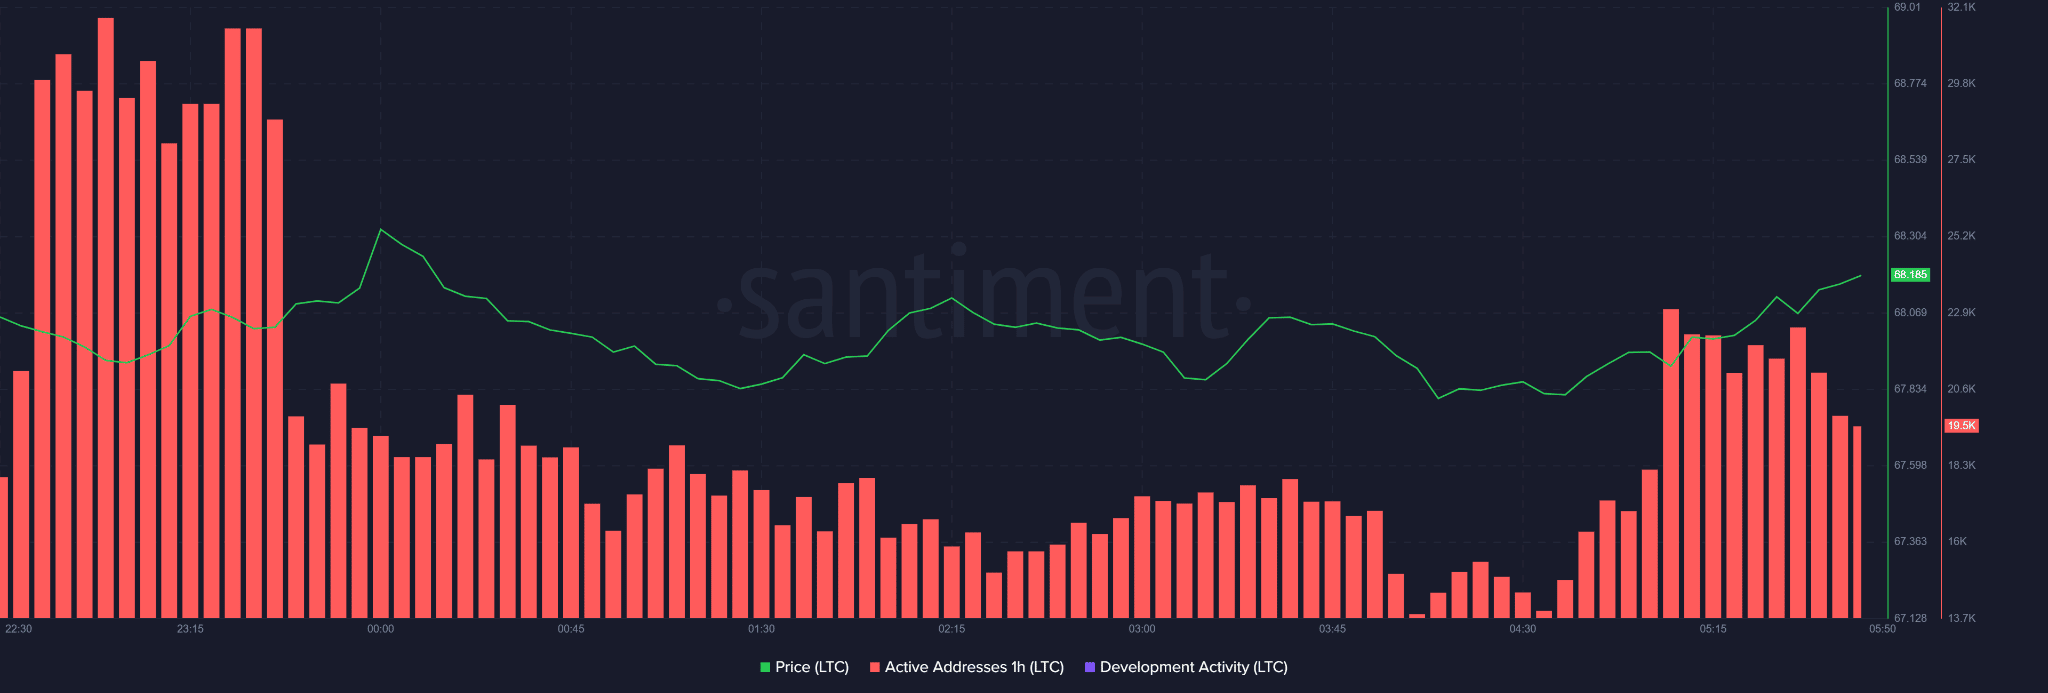
The number of active addresses fell slightly in the last one hour until press time, according to Santiment. This could undermine buying pressure and price appreciation.
Are your LTC holdings flashing green or red? Check with the Profit Calculator
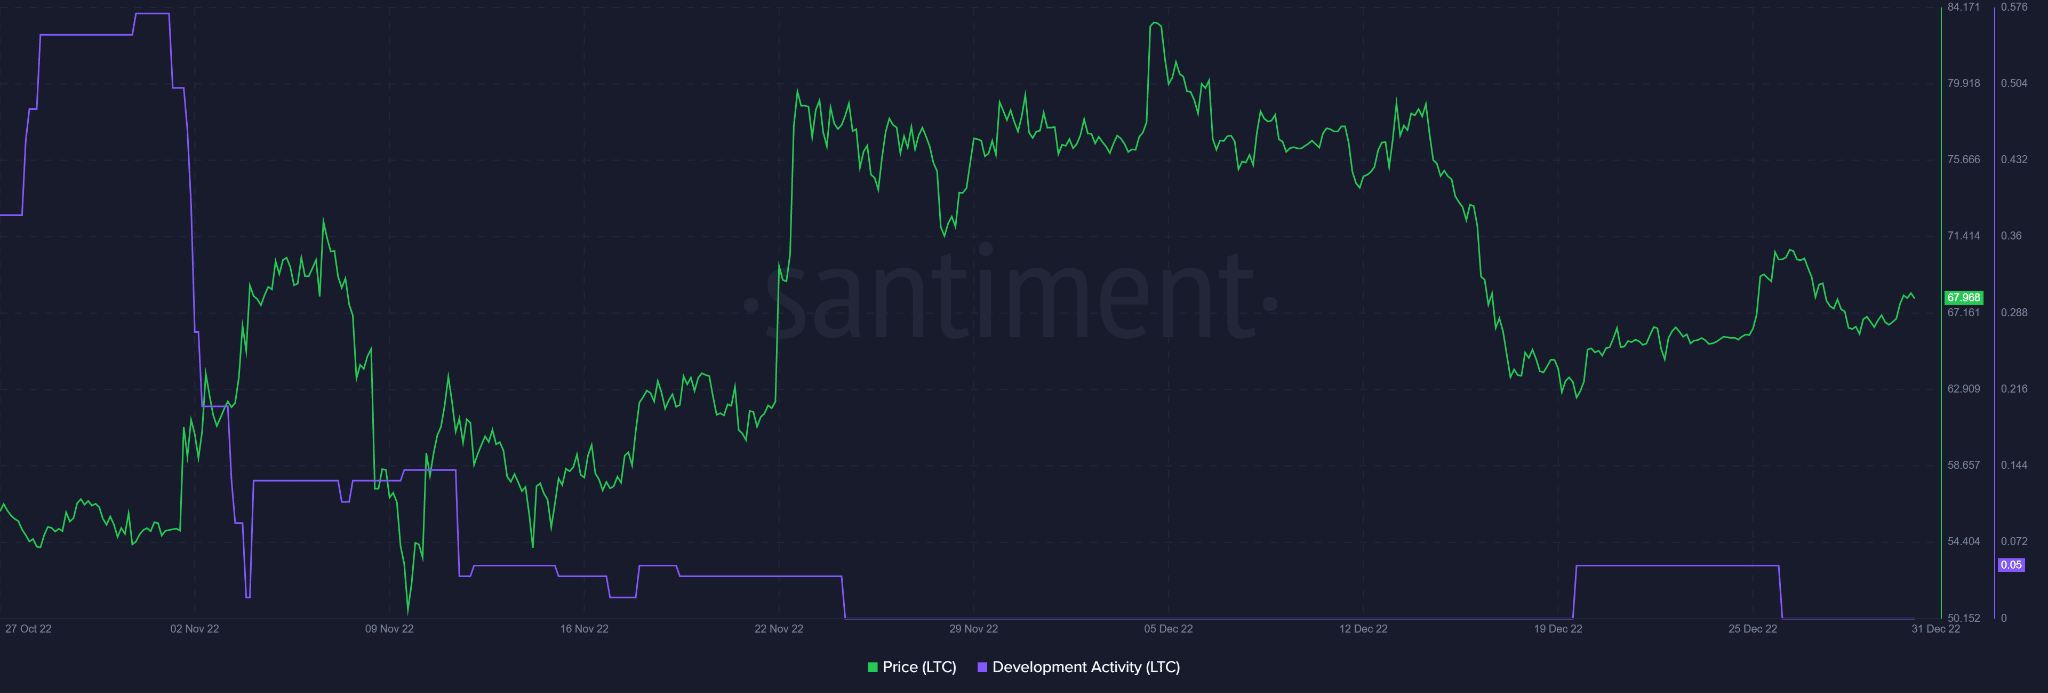
In addition, LTC’s development activity stagnated in early December, accompanied by a price decline. However, between 19 – 25 December, there was an increase in development activity, which led to a rise in prices.
Could flat development activity record at press time influence a price decline?