With MATIC breaking out of a trendline resistance, here’s where it can head next

Disclaimer: The findings of the following analysis are the sole opinions of the writer and should not be considered investment advice.
Bitcoin has been stuck within a range from $28.7k to $31.5k, and at the time of writing, BTC was trading just beneath the $30k mark. The Bitcoin Dominance metric has risen in the past three weeks, from 44.5% to 47.25%. This suggested that altcoins were shedding value faster than Bitcoin. MATIC has also been on a steady downtrend in recent weeks.
MATIC- 12-Hour Chart
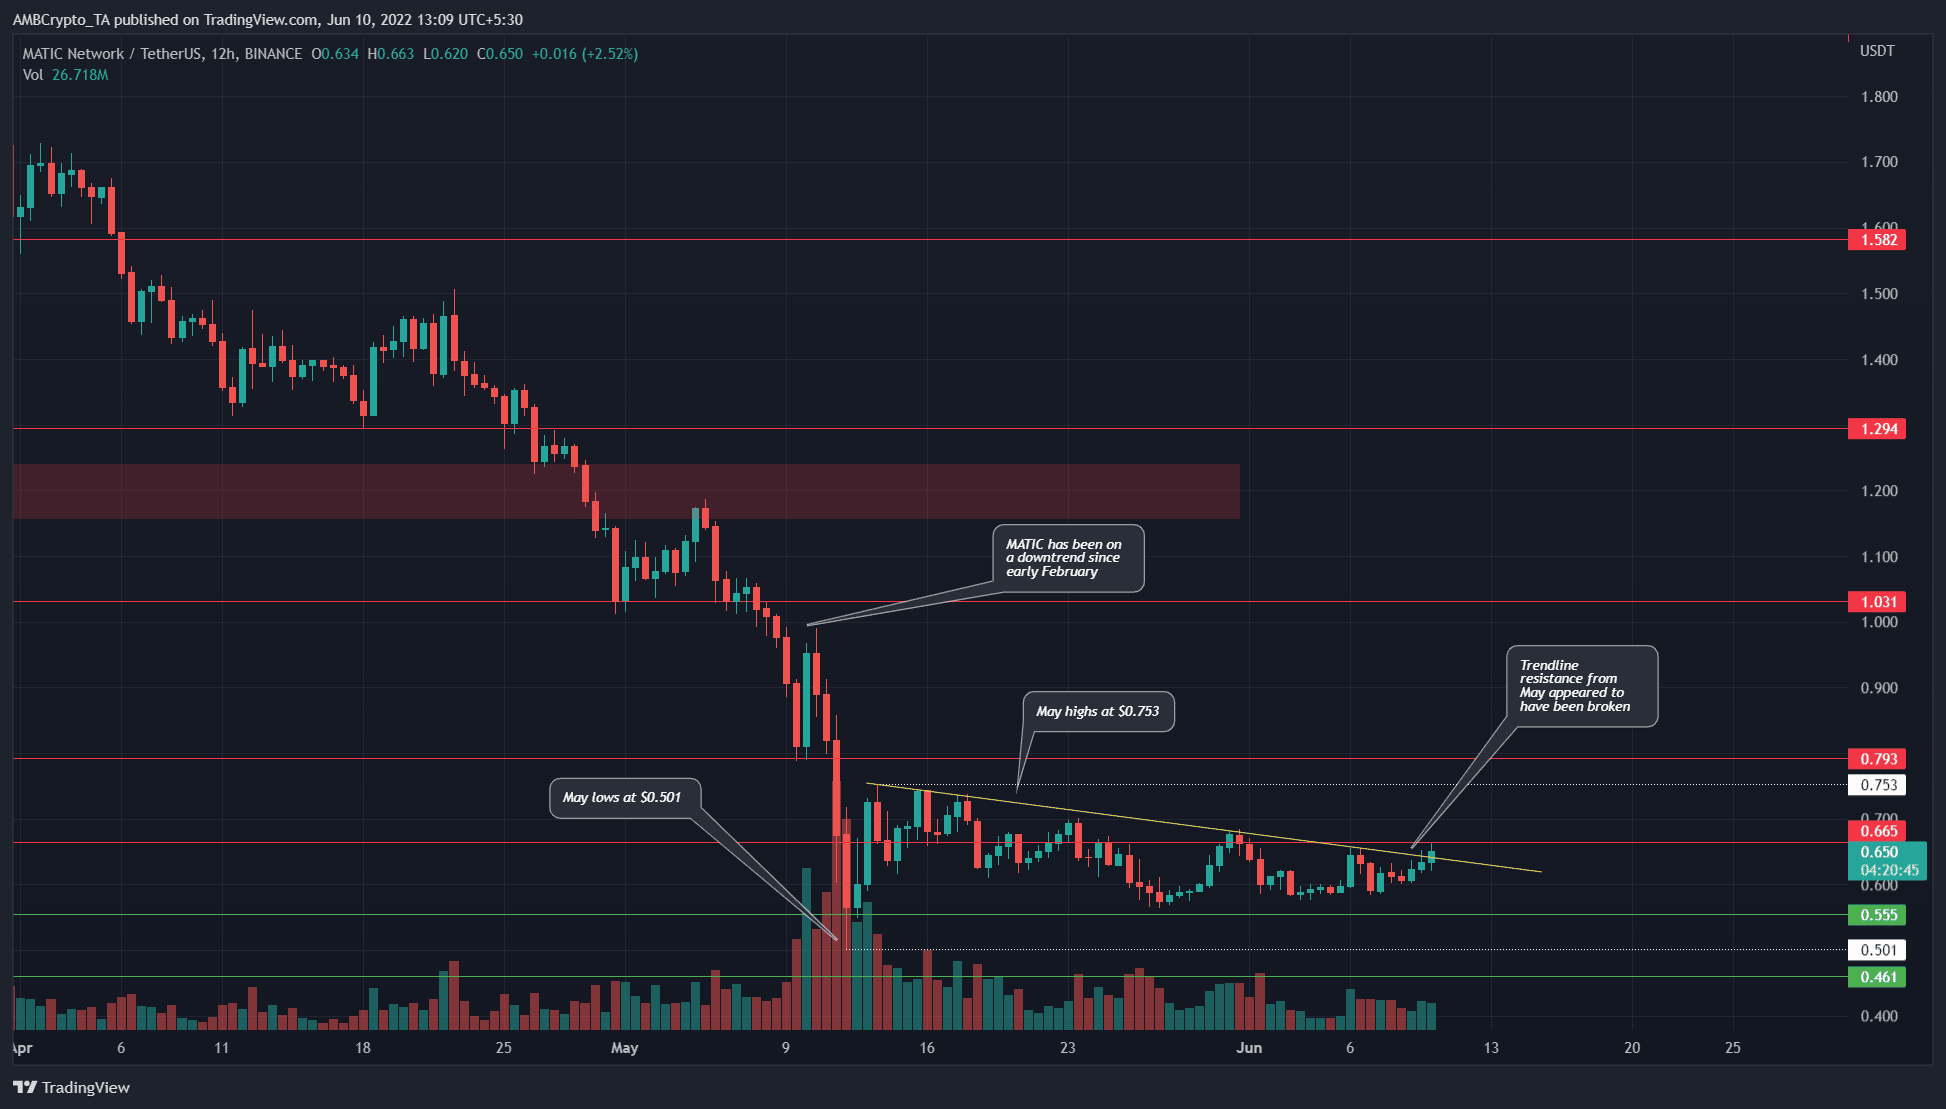
Since mid-January, the price has been in a downtrend on the charts. In April and May, MATIC has shed nearly 60% of its value. The technical structure was strongly bearish, as there were a series of lower highs and lower lows characteristic of a downtrend.
The most recent lower high stands at $0.684, and there was also a long-term horizontal resistance level at $0.66 as well. The $0.65-$0.7 is filled with resistance that the bulls must beat in order to initiate a rally toward the $0.8, $0.94, and $1 resistance levels.
Rationale
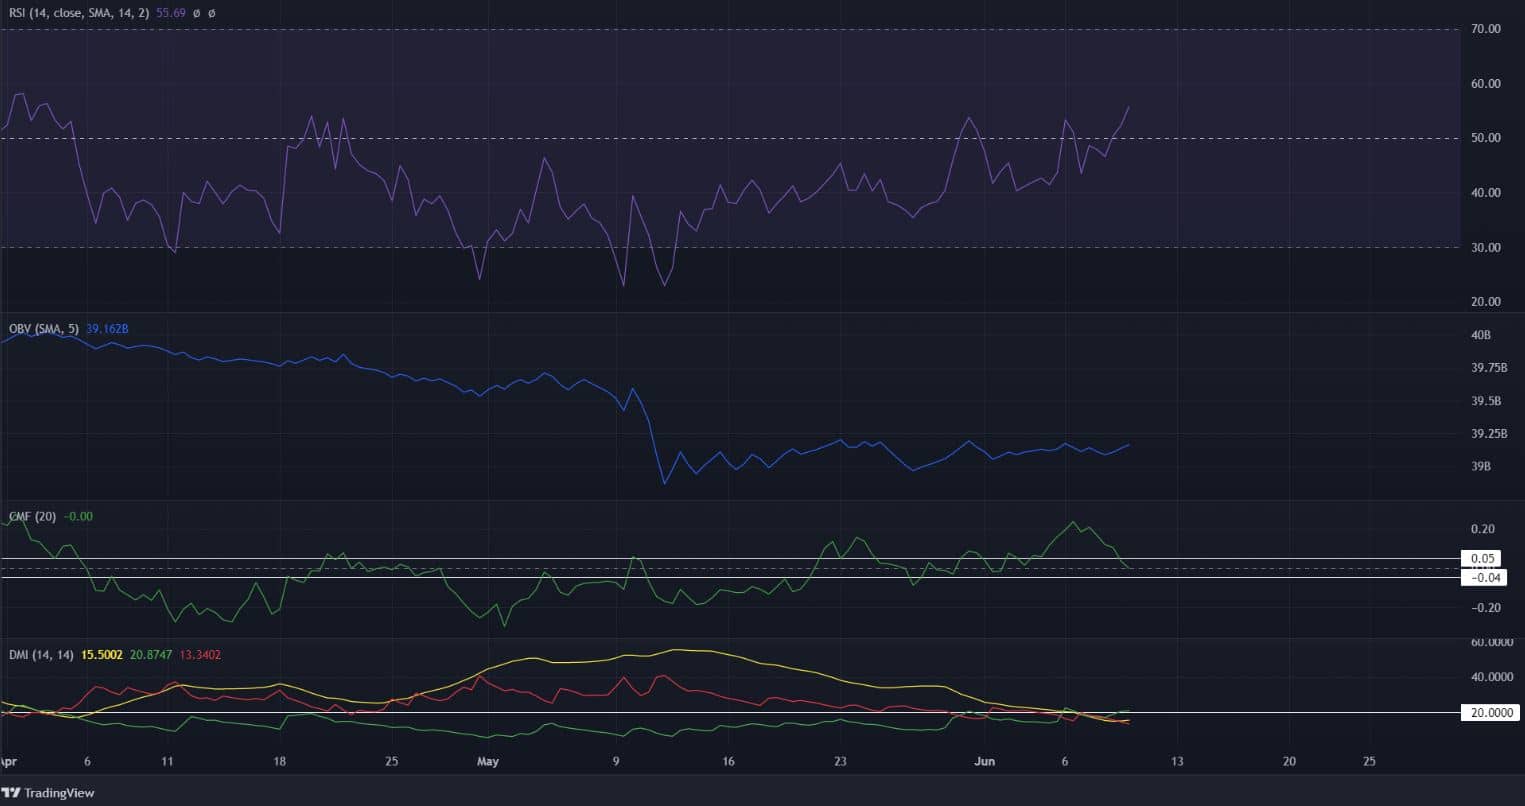
The H12 RSI climbed past neutral 50, an early indication that the momentum could be shifting in favor of the buyers. The RSI has not been able to cross the 45 mark since April began. Combined with the session close above the trendline resistance, there was a possibility that a move upwards could be on the cards.
The OBV remained flat over the past three weeks, while the CMF also spent a considerable amount of time within the -0.05 to +0.05 area. Taken together, it meant that there was not a huge amount of buying pressure in the past two weeks. The volume indicator at the bottom of the price chart did not show a large spike in trading volume either.
The DMI showed a distinct lack of a trend, as the -DI (red), +DI (green), and the ADX (yellow) all remained beneath 20.
Conclusion
A breakout past a month-long trendline, if it does occur, might not usher in an uptrend. The market remains dominated by the bears and a revisit to the $0.7 area would more likely be a selling opportunity than a buying one.


