XRP, Chainlink, Stellar Price Analysis: 28 August

The altcoin market flashed gains since the last 24 hours, but also signaled at potential price pullbacks. XRP gained 5.9% but buying strength dipped despite the gain. Chainlink recorded a 4.3% increase, while pointing towards possible rangebound movement. Lastly, Stellar could experience a sell-off even though it logged a 4.6% gain.
XRP
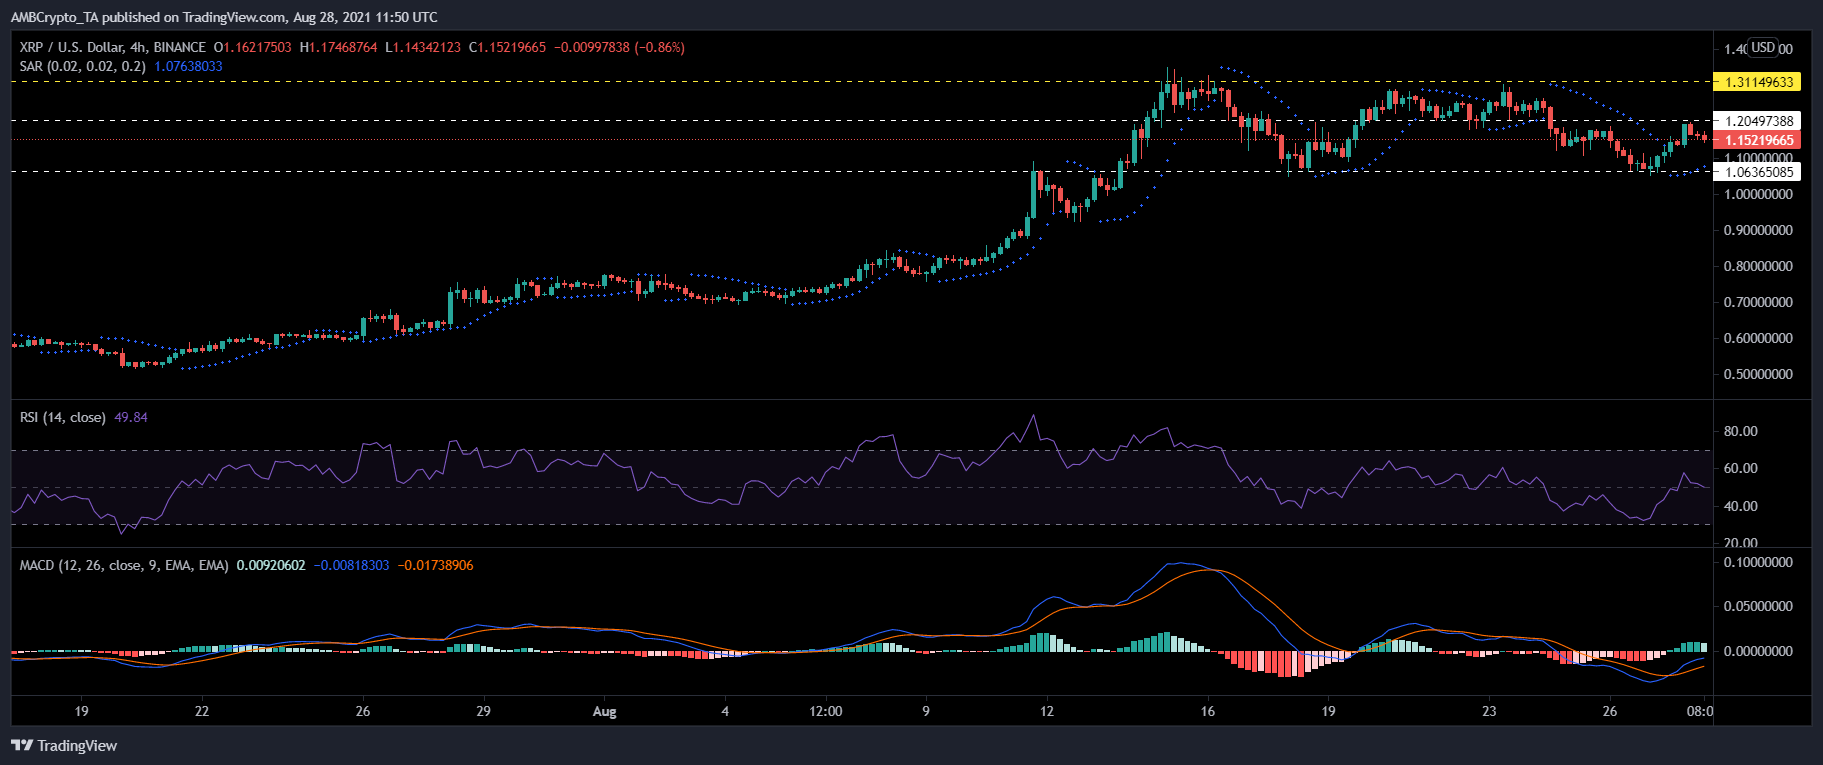
XRP rose 5.9% over the last 24 hours, and was trading at $1.15. The continued uptrend could push XRP to topple over the $1.20 mark, and test the $1.31 level. Technical parameters showed positive price action.
MACD displayed green bars on its histogram underlining that XRP was on an uptrend. The Parabolic SAR flashed dotted lines below the candlesticks in accordance with the aforementioned reading.
Relative Strength Index, even though bullish, threatened to fall below the half-line. In the event of a sell-off, XRP could find support on the $1.06 mark.
Chainlink (LINK)
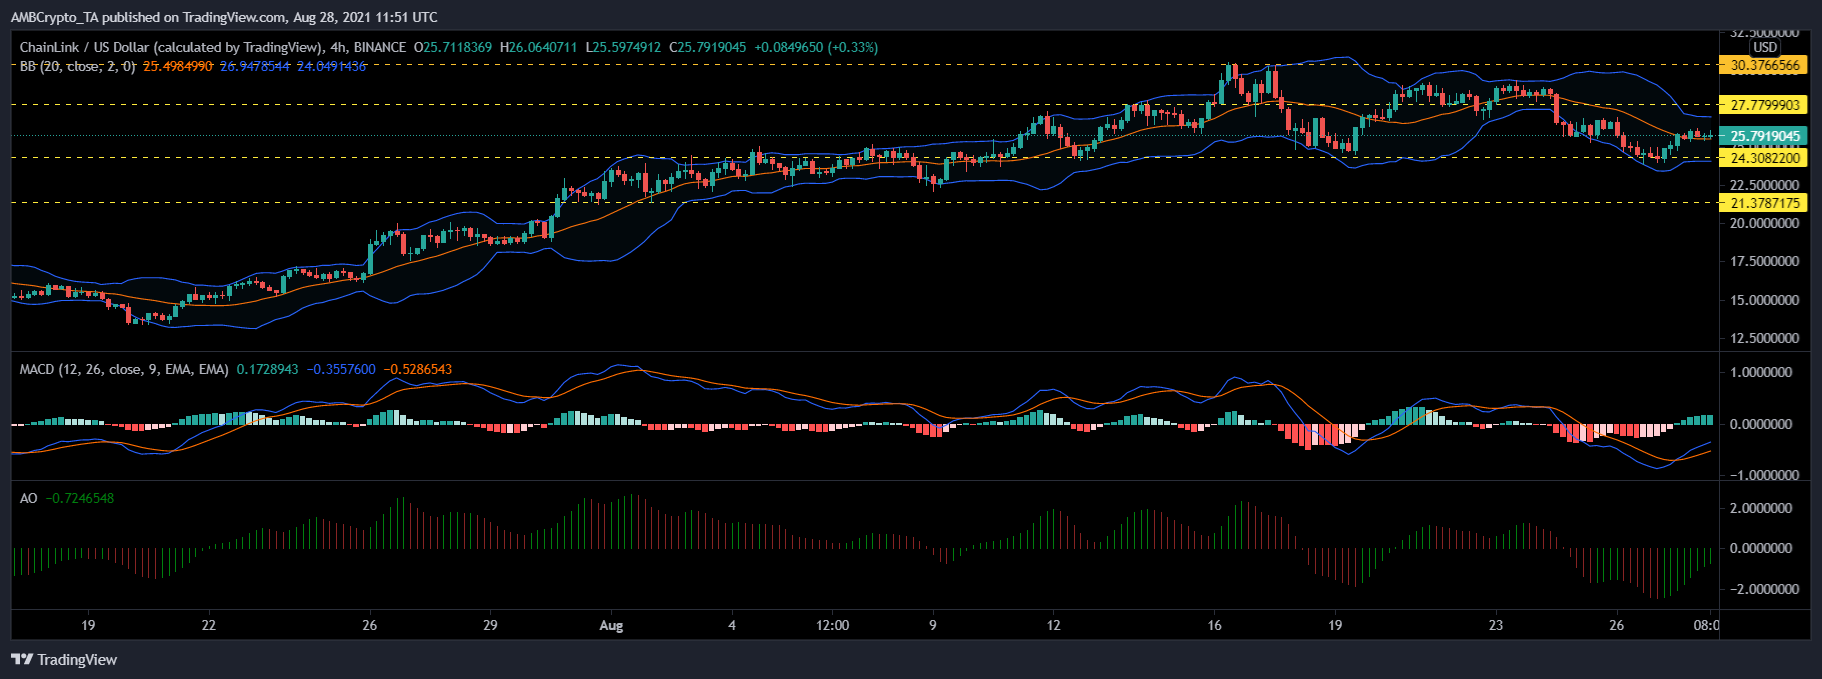
LINK was priced at $25.79 and it registered a 4.3% gain over the last 24 hours. With continued upward movement, LINK could attempt to test the $27.77 price ceiling. In order to retest the $30.37 resistance mark, LINK would need to trade above the $27.77, longer than just a few trading sessions.
MACD observed green bars on its histogram, depicting an upward price action. Awesome Oscillator also pointed at the same, with the green signal bars.
Bollinger Bands, however, implied a constricted price movement as the bands tightened. The expected range for LINK to trade within, could be between $27.77 and $24.30 levels. On the flip side, if prices reverse, LINK could find support on $24.30 and $21.37.
Stellar (XLM)
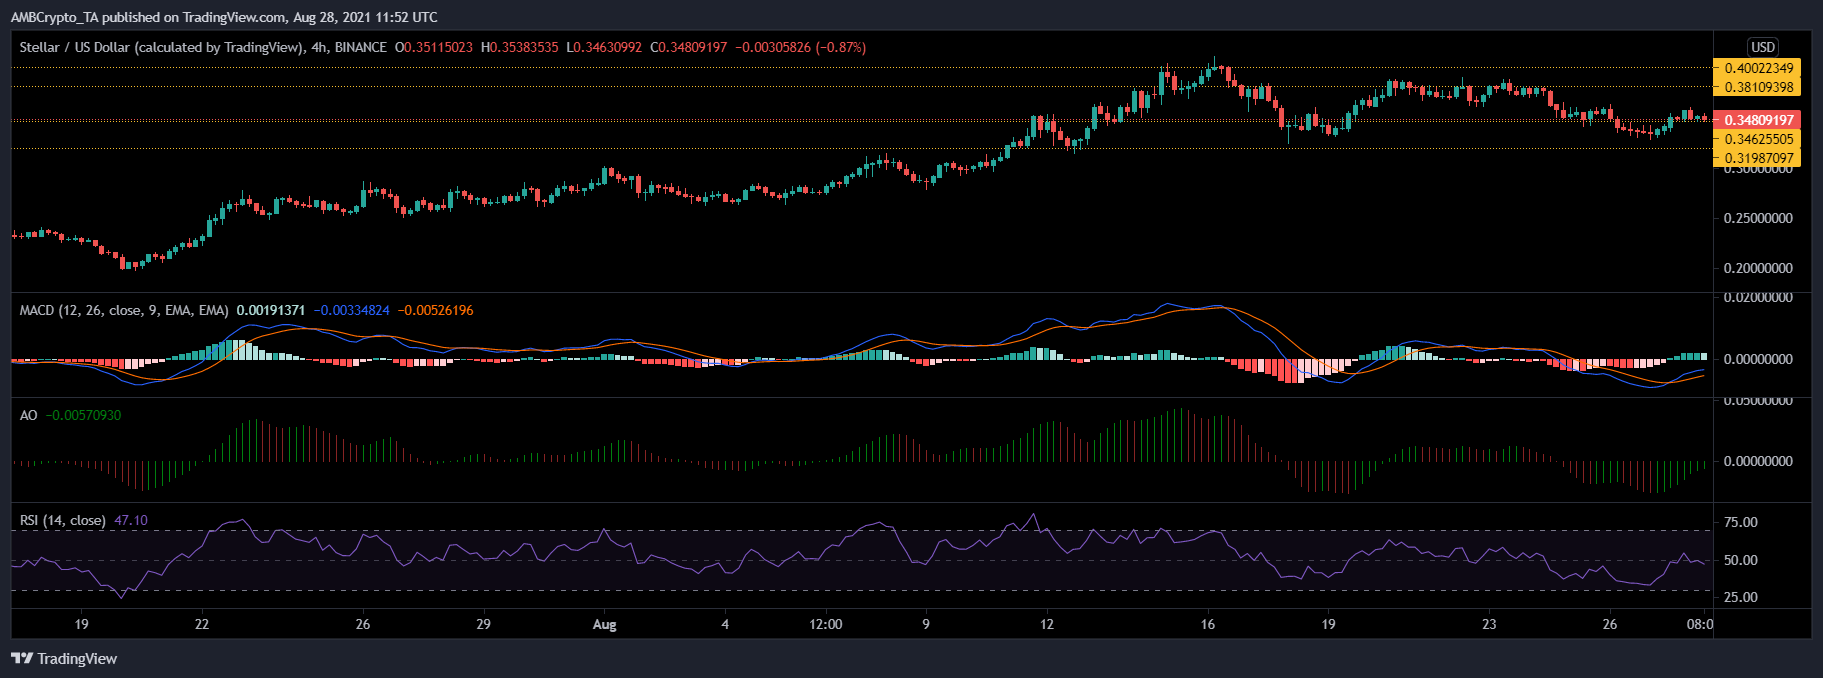
Stellar noted a 4.6% appreciation since yesterday. XLM’s prices stood at $0.348. The immediate resistance for the coin lay at $0.381 and then at $0.400. The four-hour chart, however, indicated chances of a price reversal.
Awesome Oscillator flashed green signal bars. Green bars on MACD’s histogram receded over the past trading sessions. Buying pressure lost strength and the Relative Strength Index fell slightly below the half-line.
In event of the buying pressure declining further, prices could come down to $0.346 as the coin was trading too close to the aforementioned support line. The next support level for XLM was at $0.319.


