XRP, Decred, Polkadot Price Analysis: 30 December

XRP traders circled important dates of delisting and court battles on their calendar, while on the charts XRP was set to slide further south. Polkadot broke out past the $6 level on extraordinary trading volume and reached a high of $7.7 and was likely to retrace some of the gains made. Decred had a bullish outlook to it on the charts for the coming days, but the next few hours could see a dip as low as $34.
XRP
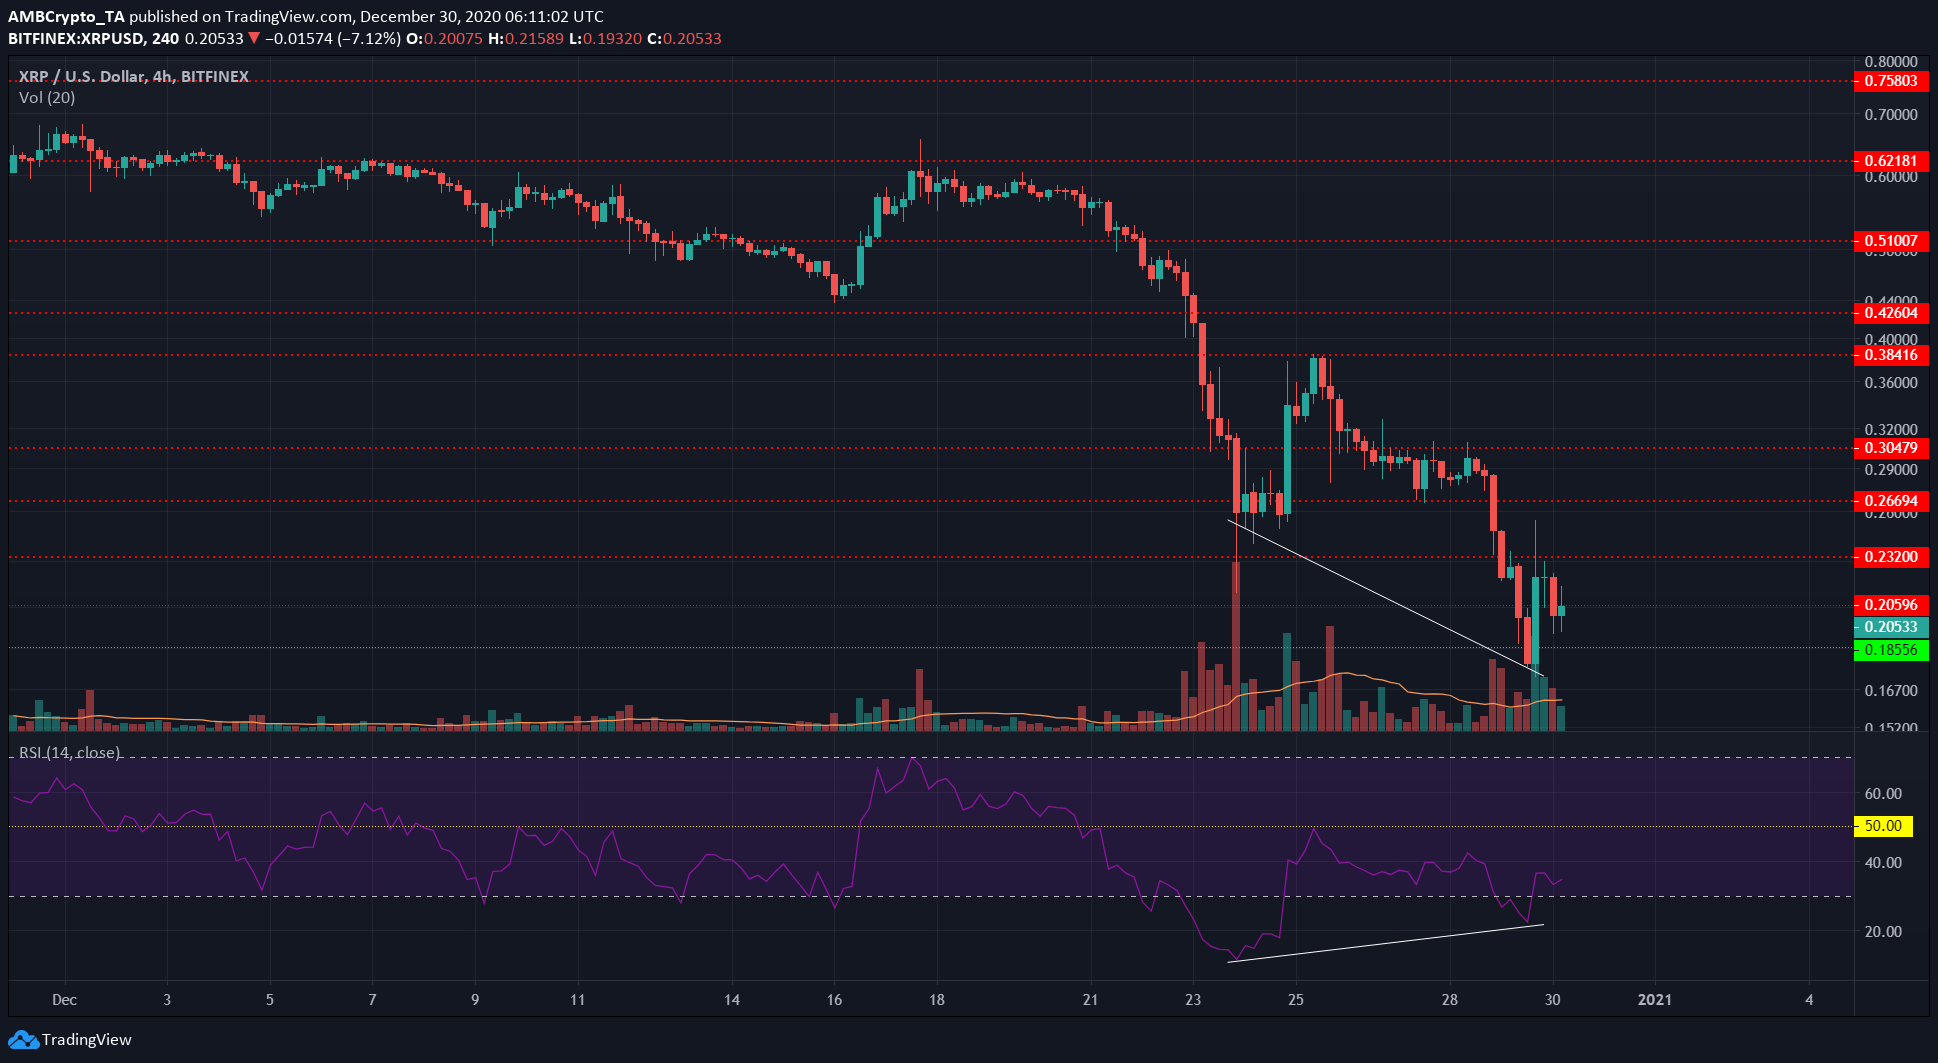
An oversold bullish divergence materialized to cause a dead cat bounce measuring nearly 24% for XRP, from the $0.18 level to close that trading session at $0.22.
The price has declined since and was trading at $0.2 at press time.
XRP was announced to be delisted on US exchanges in the near future due to the SEC’s lawsuit. However, Ripple’s partner and Japanese financial giant SBI Holdings asserted that, under Japanese law, XRP is a cryptocurrency asset.
The first court date was set for the SEC’s case against Ripple in the New York Southern District Court on the 22nd of February.
Polkadot [DOT]
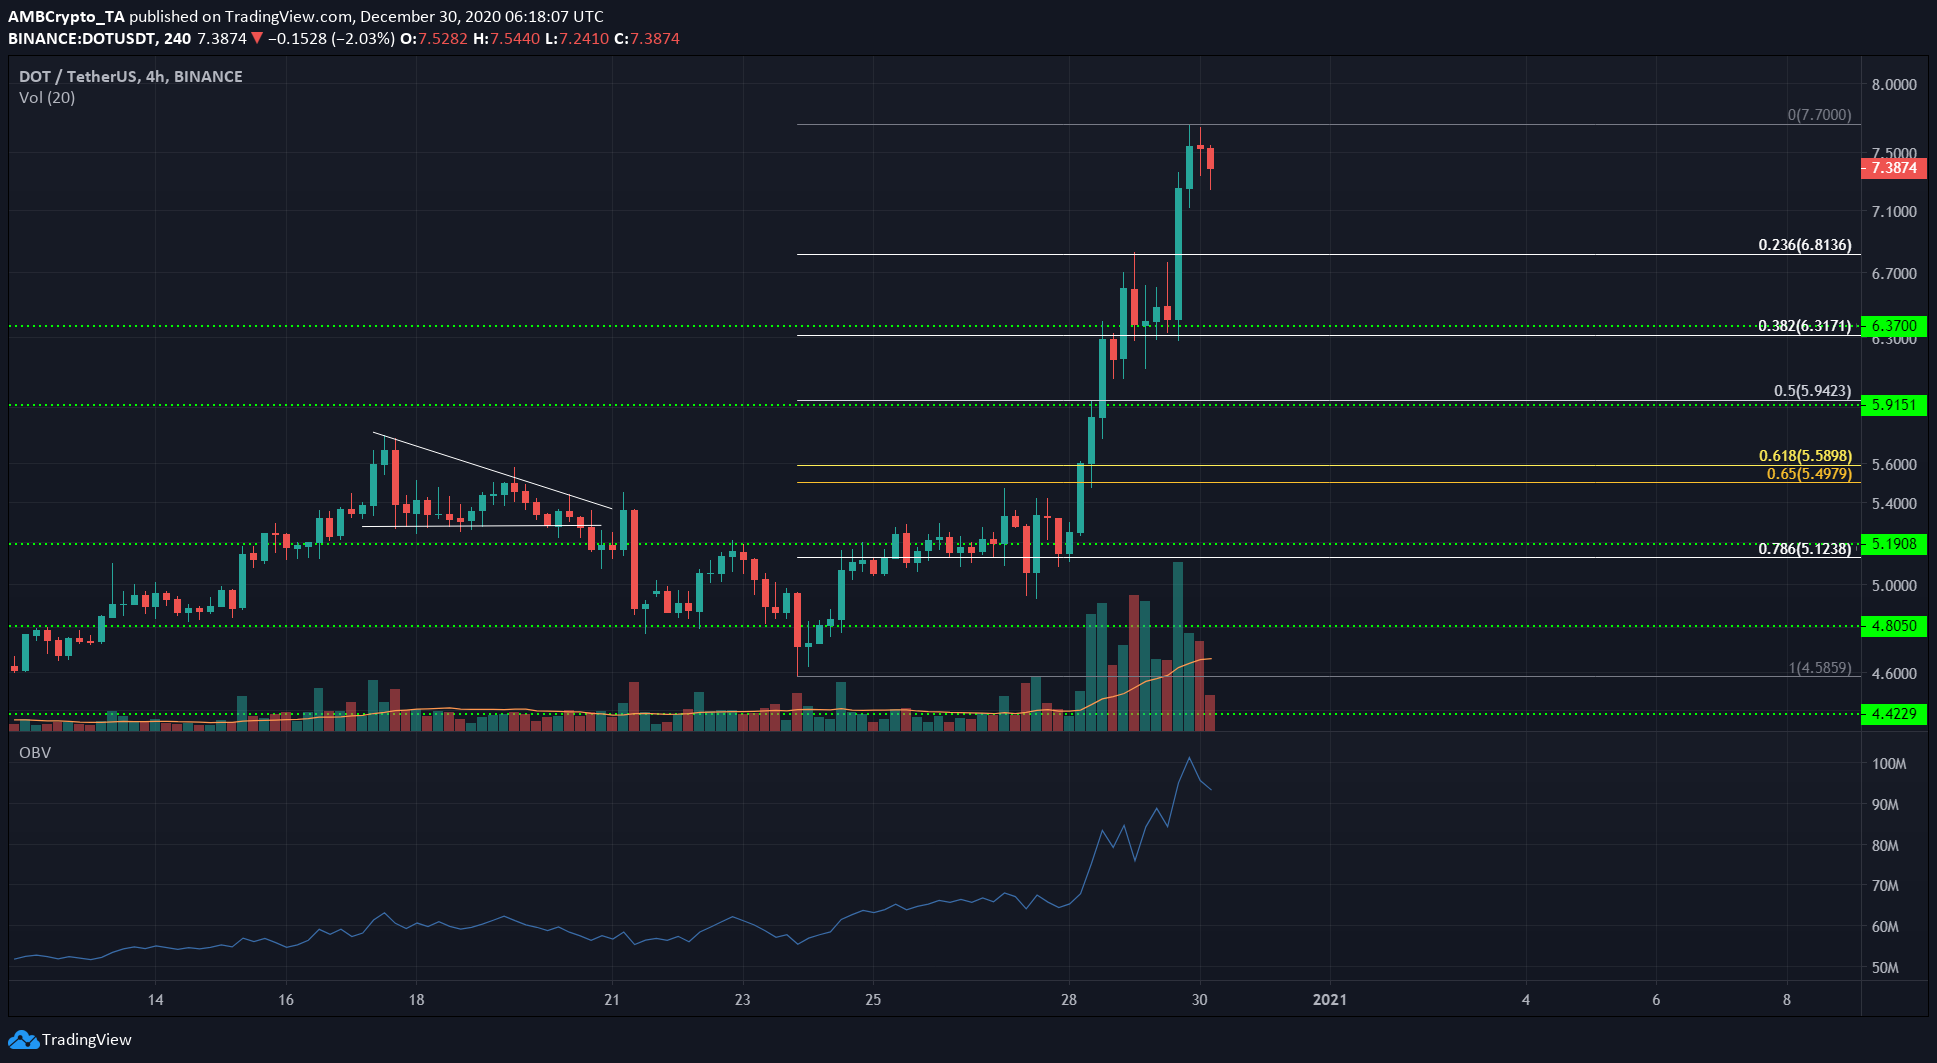
Polkadot’s move from $4.58 to $7.7 began on the 23rd of December when Binance announced a $10 million fund to support projects built on Polkadot.
Using the Fibonacci Retracement tool for this move, some important levels of support were identified. The price appeared to have reversed after posting a hanging man candlestick pattern, that was not yet confirmed at the time of writing.
If confirmed, the price can be expected to retrace to 23.6% and the 38.2% retracement levels based on market sentiment over the following days.
The OBV confirmed that the recent rise was on strong buying volume and hence legitimate.
Decred [DCR]
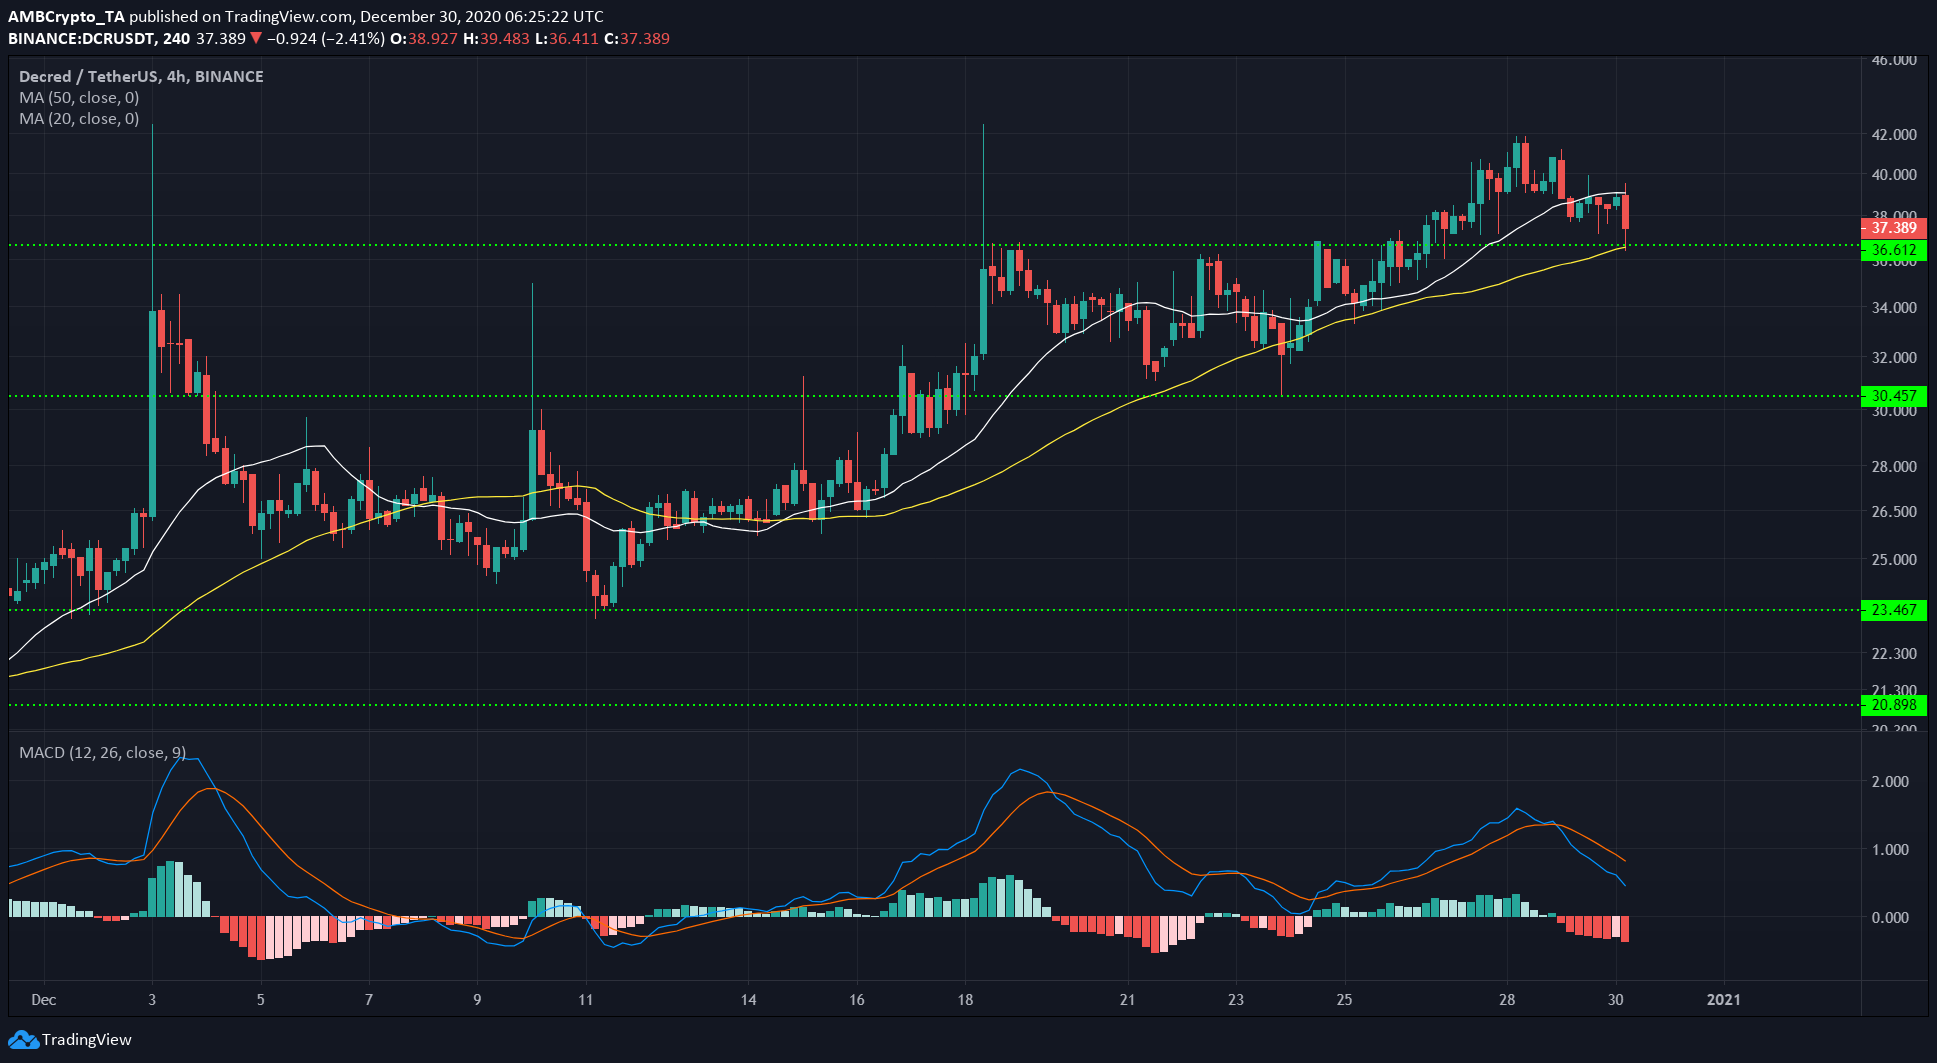
The short-term moving averages showed that DCR was in a strong uptrend. The 50 SMA (yellow) had confluence with the $36.6 horizontal support. DCR could find buyers on this level and halt its dip.
The MACD formed a bearish crossover but this can be regarded as a weak buying signal. A session close below the $36.6 level can see DCR dip to the $34 region.