XRP, Dogecoin, Cardano Price Analysis: 07 June

Volatility remained low in the XRP market for short-term price swings. Dogecoin traded within a descending triangle and lay vulnerable to a 20% retracement. Finally, Cardano could see a surge to $1.85 and a successful breakout would initiate a rally.
XRP
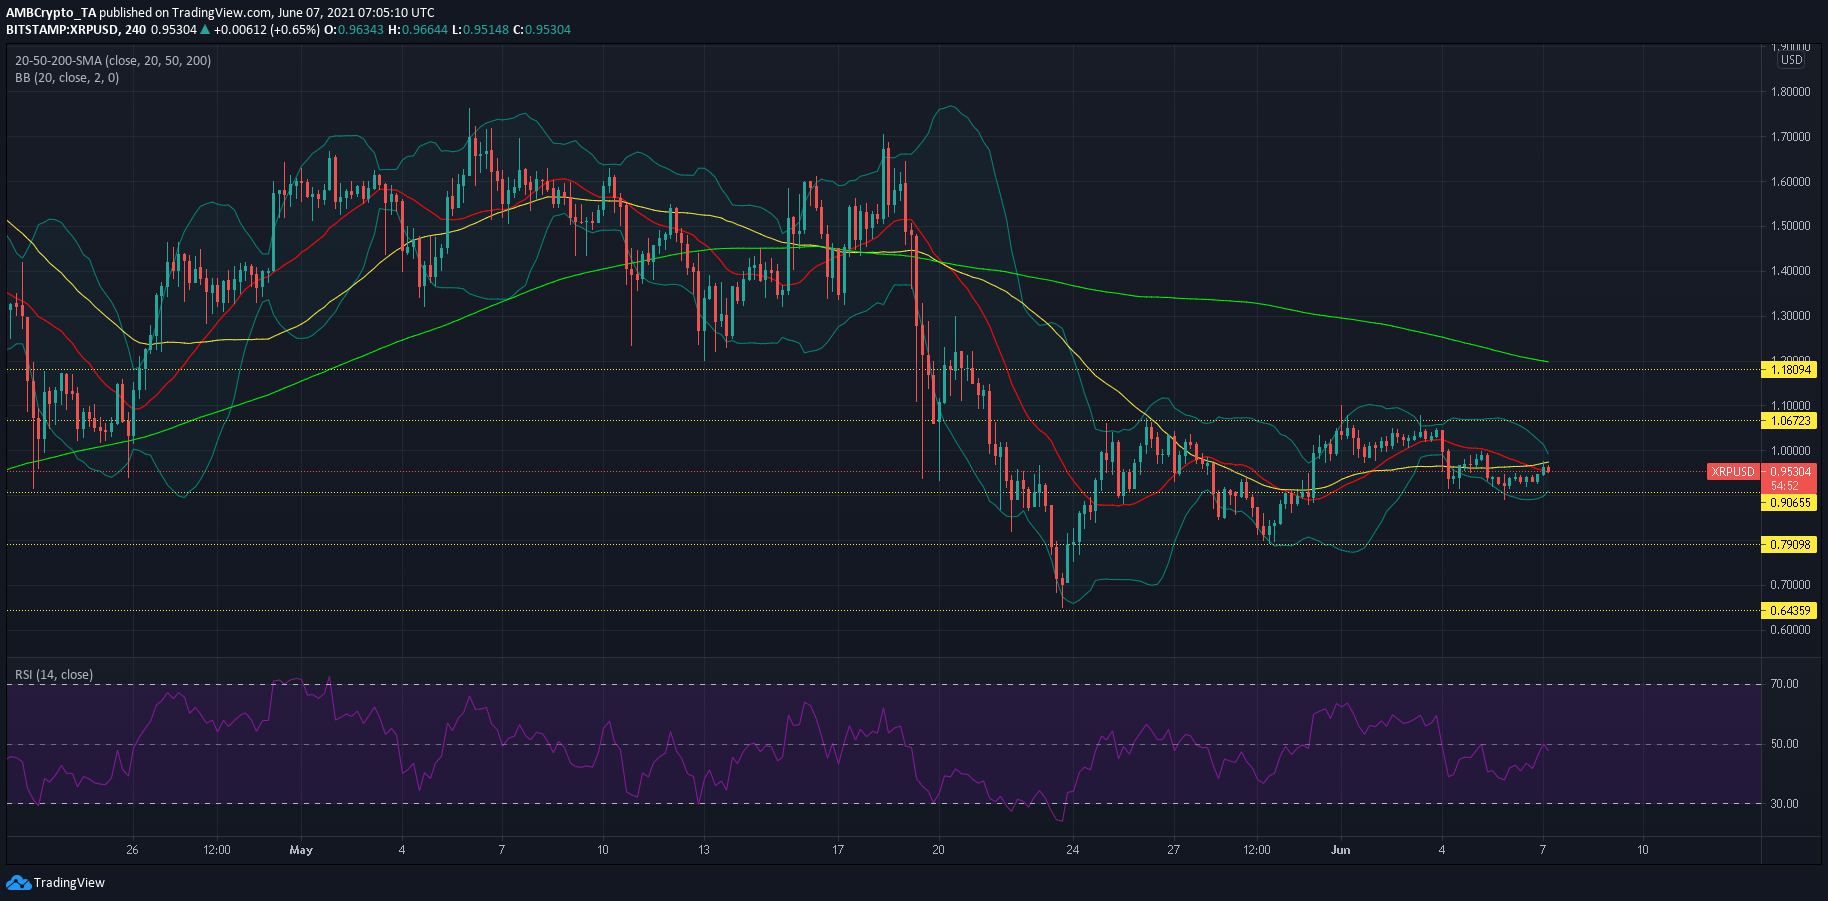
On the 4-hour timeframe, XRP’s 20-SMA (red) and 50-SMA (yellow) moved above the candlesticks and outlined a bearish market. The contracted nature of Bollinger Bands showed that volatility was settling down after XRP made its jump from $0.80 to $1.06 and its subsequent pullback.
RSI’s movement between 37-50 over the past few days also reflected a degree of equilibrium between buyers and sellers. Considering these factors, it was likely that XRP may move sideways over the coming sessions as volatility was low for sharp price movements.
Once volatility returns, selling pressure could drag XRP all the way to $0.64 in a bearish scenario. Conversely, a breakout could push the cryptocurrency to $1.18 and 200-SMA (green).
Dogecoin [DOGE]
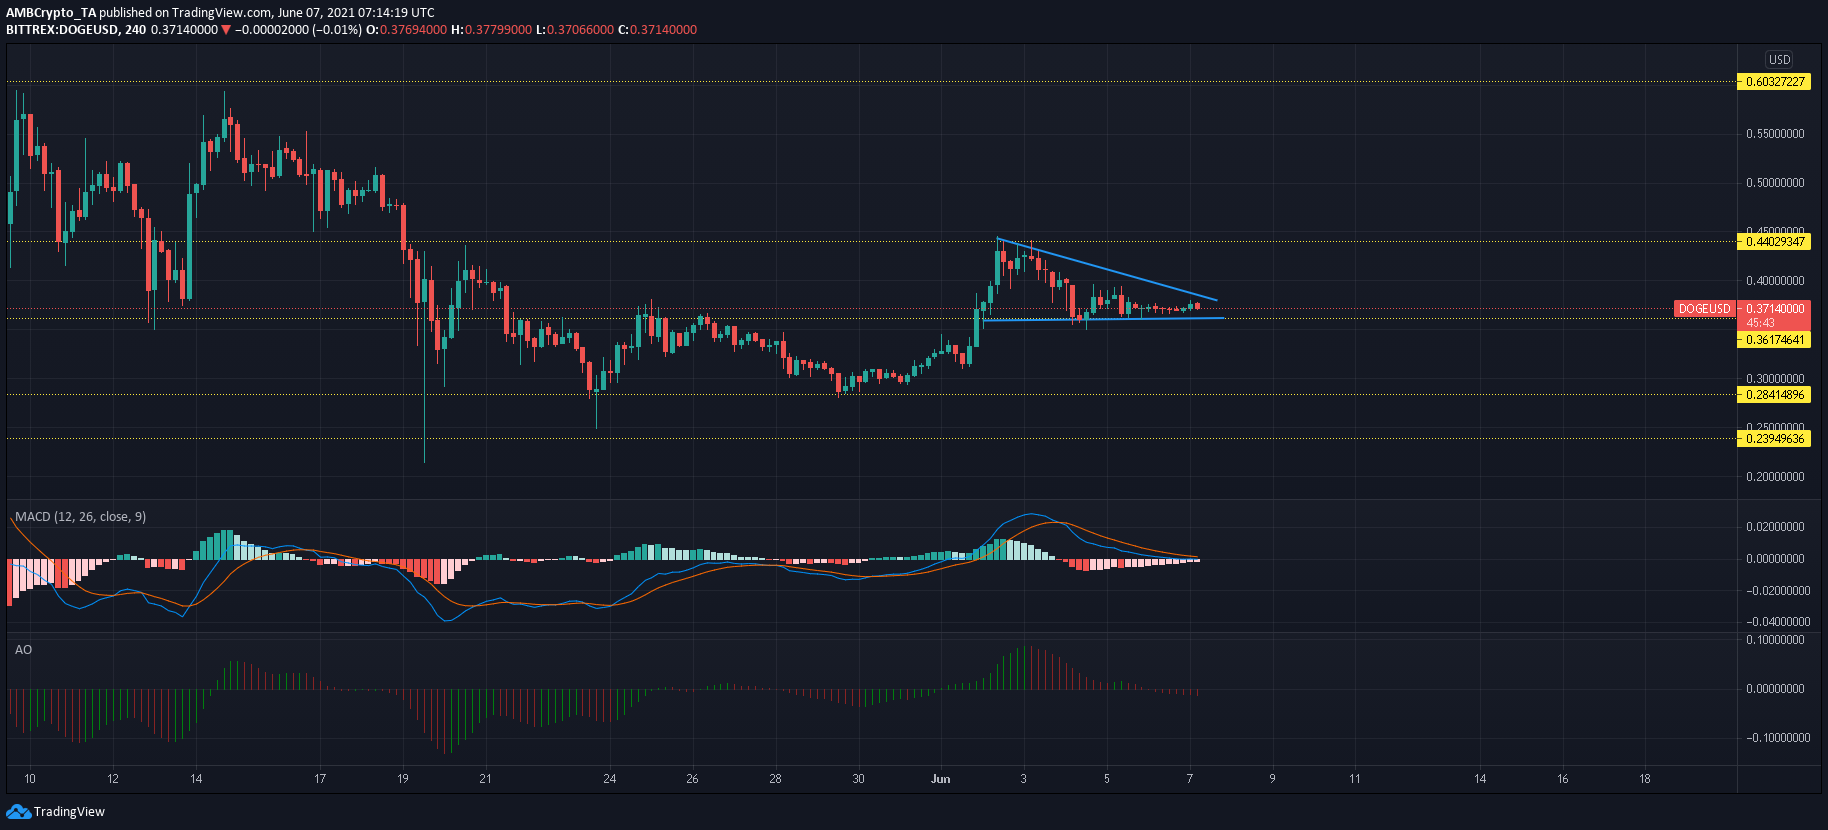
Dogecoin’s drop from $0.440 to $0.36 led to the formation of a descending triangle and the bulls were at risk of a breakdown. If $0.36-support is breached, sellers could push DOGE to the defensive line at $0.28, which would represent losses of 20% from the bottom trendline. However, DOGE’s technicals did not point towards an immediate breakdown, and movement within the pattern was possible moving forward.
According to Awesome Oscillator, there was some bearish momentum but not enough to warrant a breakdown just yet. On the other hand, MACD’s fast-moving line caught up to the Signal line and hinted at a bullish crossover, and suggested that bulls might hold on to the press-time support.
Cardano [ADA]

Cardano’s current upcycle was crucial to its path to recovery towards May highs. Since the 19 May sell-off, ADA has attempted to breach $1.85-ceiling multiple times but sellers have denied a breakout on each occasion. On the plus side, ADA has managed to find support at higher levels- at $1.05, $1.32, and $1.61. This indicated that bulls would eventually break above the stiff upper ceiling.
MACD line was on the verge of crossing above the Signal line as the market was shifting over to the buyers. Meanwhile, RSI was still in neutral territory and ADA could see some sideways movement before attempting a move above $1.85.