XRP, Litecoin, EOS Price Analysis: 19 November

Market dominators Bitcoin and Ethereum noted double-digit weekly losses, at press time. Consequently, altcoins like XRP, Litecoin, and EOS corresponded by registering over 24% retracements in nine days.
All these coins struck their weekly or monthly milestones on 10 November. After which all of them were in the correction phase and now showed signs of a possible recovery.
XRP
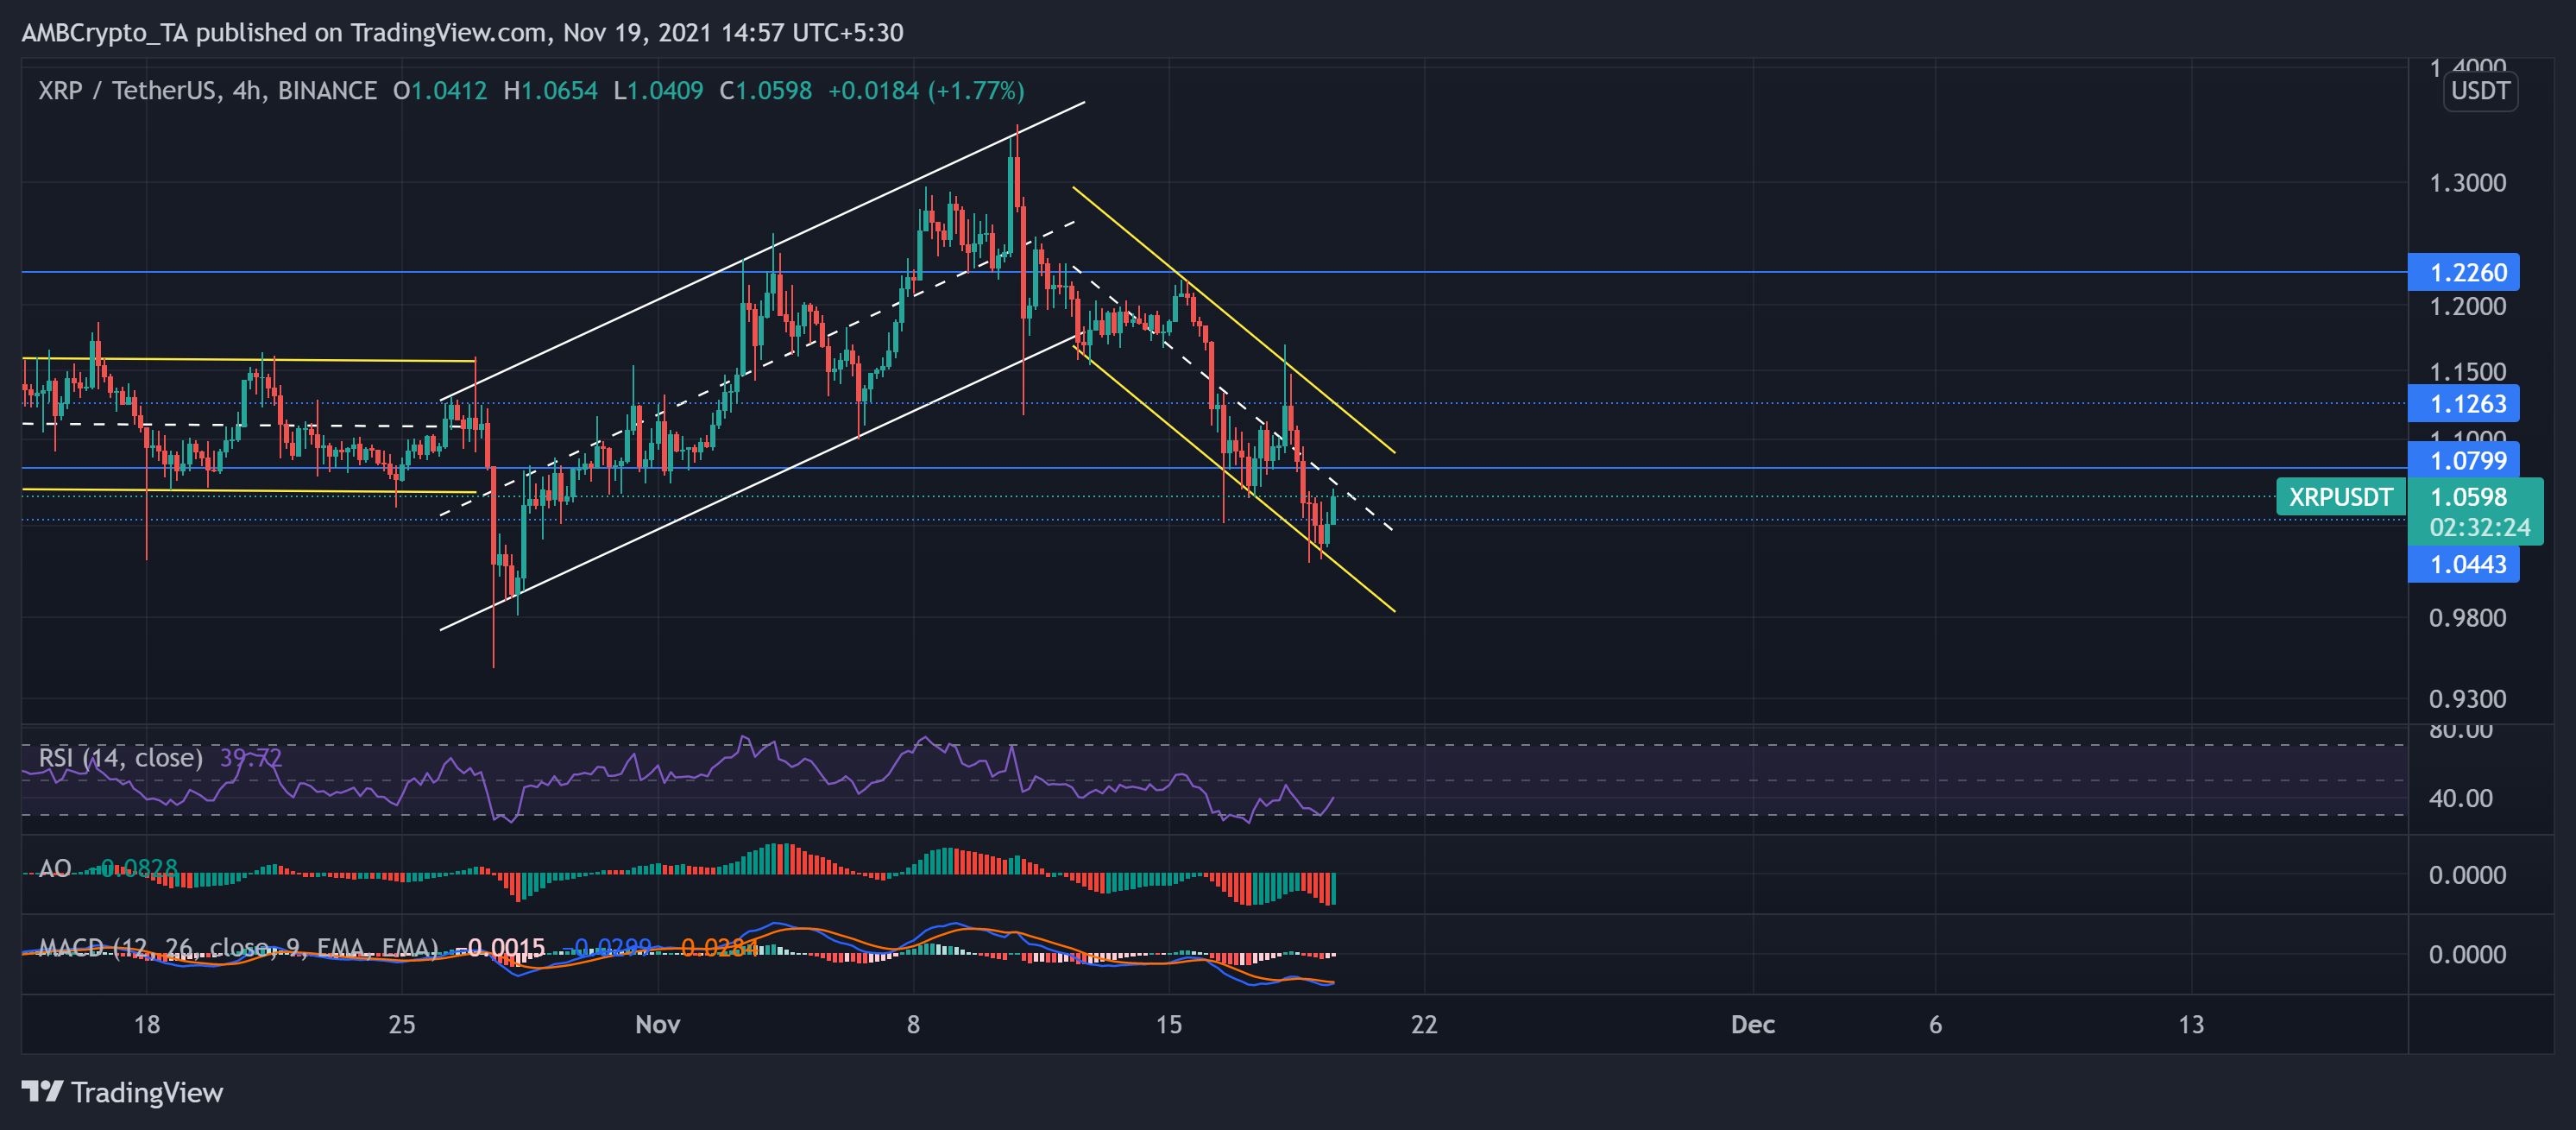
Since mid-October, XRP has followed a dynamic trajectory. After moving sideways for nearly two weeks, it oscillated within the ascending parallel channel (white). During this phase, XRP rallied by 35% to touch its two-month high on 10 November.
Since then, however, the bulls lost their vigor as the trend flipped into a down channel. This pullback resulted in a 24.7% correction until the price touched its three-week low on 18 November.
While bulls failed to counter the price at the lower trendline, bears breached the $1.07-mark and found support at $1.0443. Now, as bulls again try to breach the $1.07-mark, the technicals preferred the bearish power but pointed at its ease.
At press time, XRP was trading at $1.0598. The RSI witnessed a 10 point revival after dipping into the oversold region. Although MACD and AO were below the equilibrium level, they hinted at a possible upswing.
Litecoin (LTC)
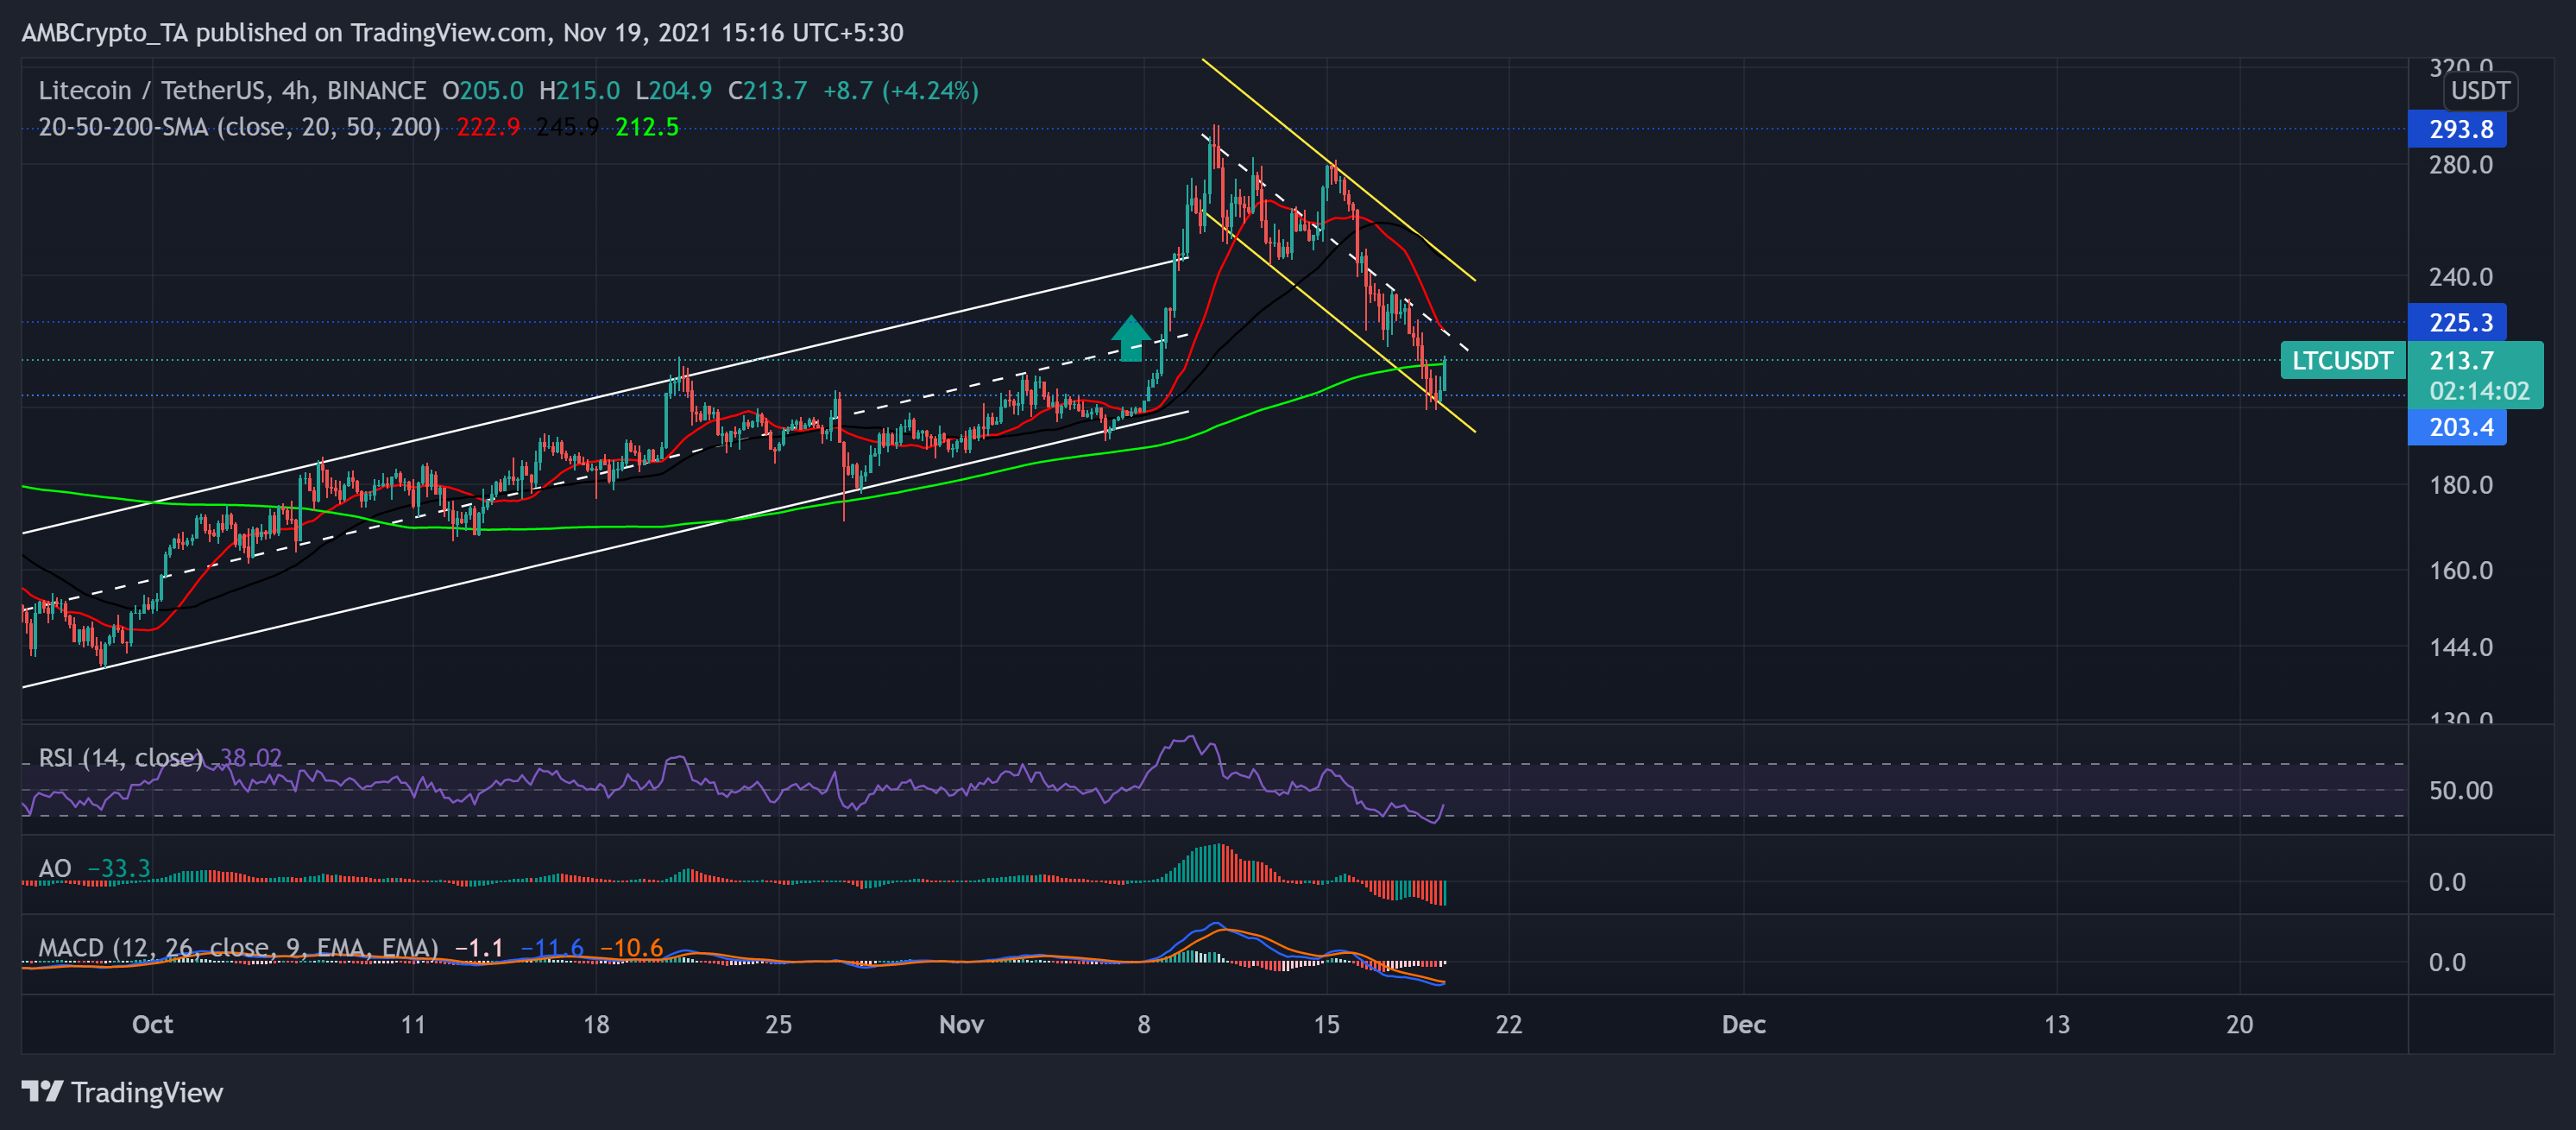
Since late September, LTC persistently rose by swaying between a parallel channel (white). This momentum led to a 74.5% ROI from 29 September to 9 November. Consequently, the price breached the upper channel to touch its 25-week high on 10 November.
However, since then, the price action retraced by registering a 26.4% nine-day blip. At press time, LTC traded below its 20-50 SMA at $213.7. The technicals favored the sellers but did not discard the possibility of a near-term bullish revival.
The RSI restored 13 points after dipping into the oversold region. Additionally, MACD and AO reaffirmed the bearish strength with a possible upturn.
EOS
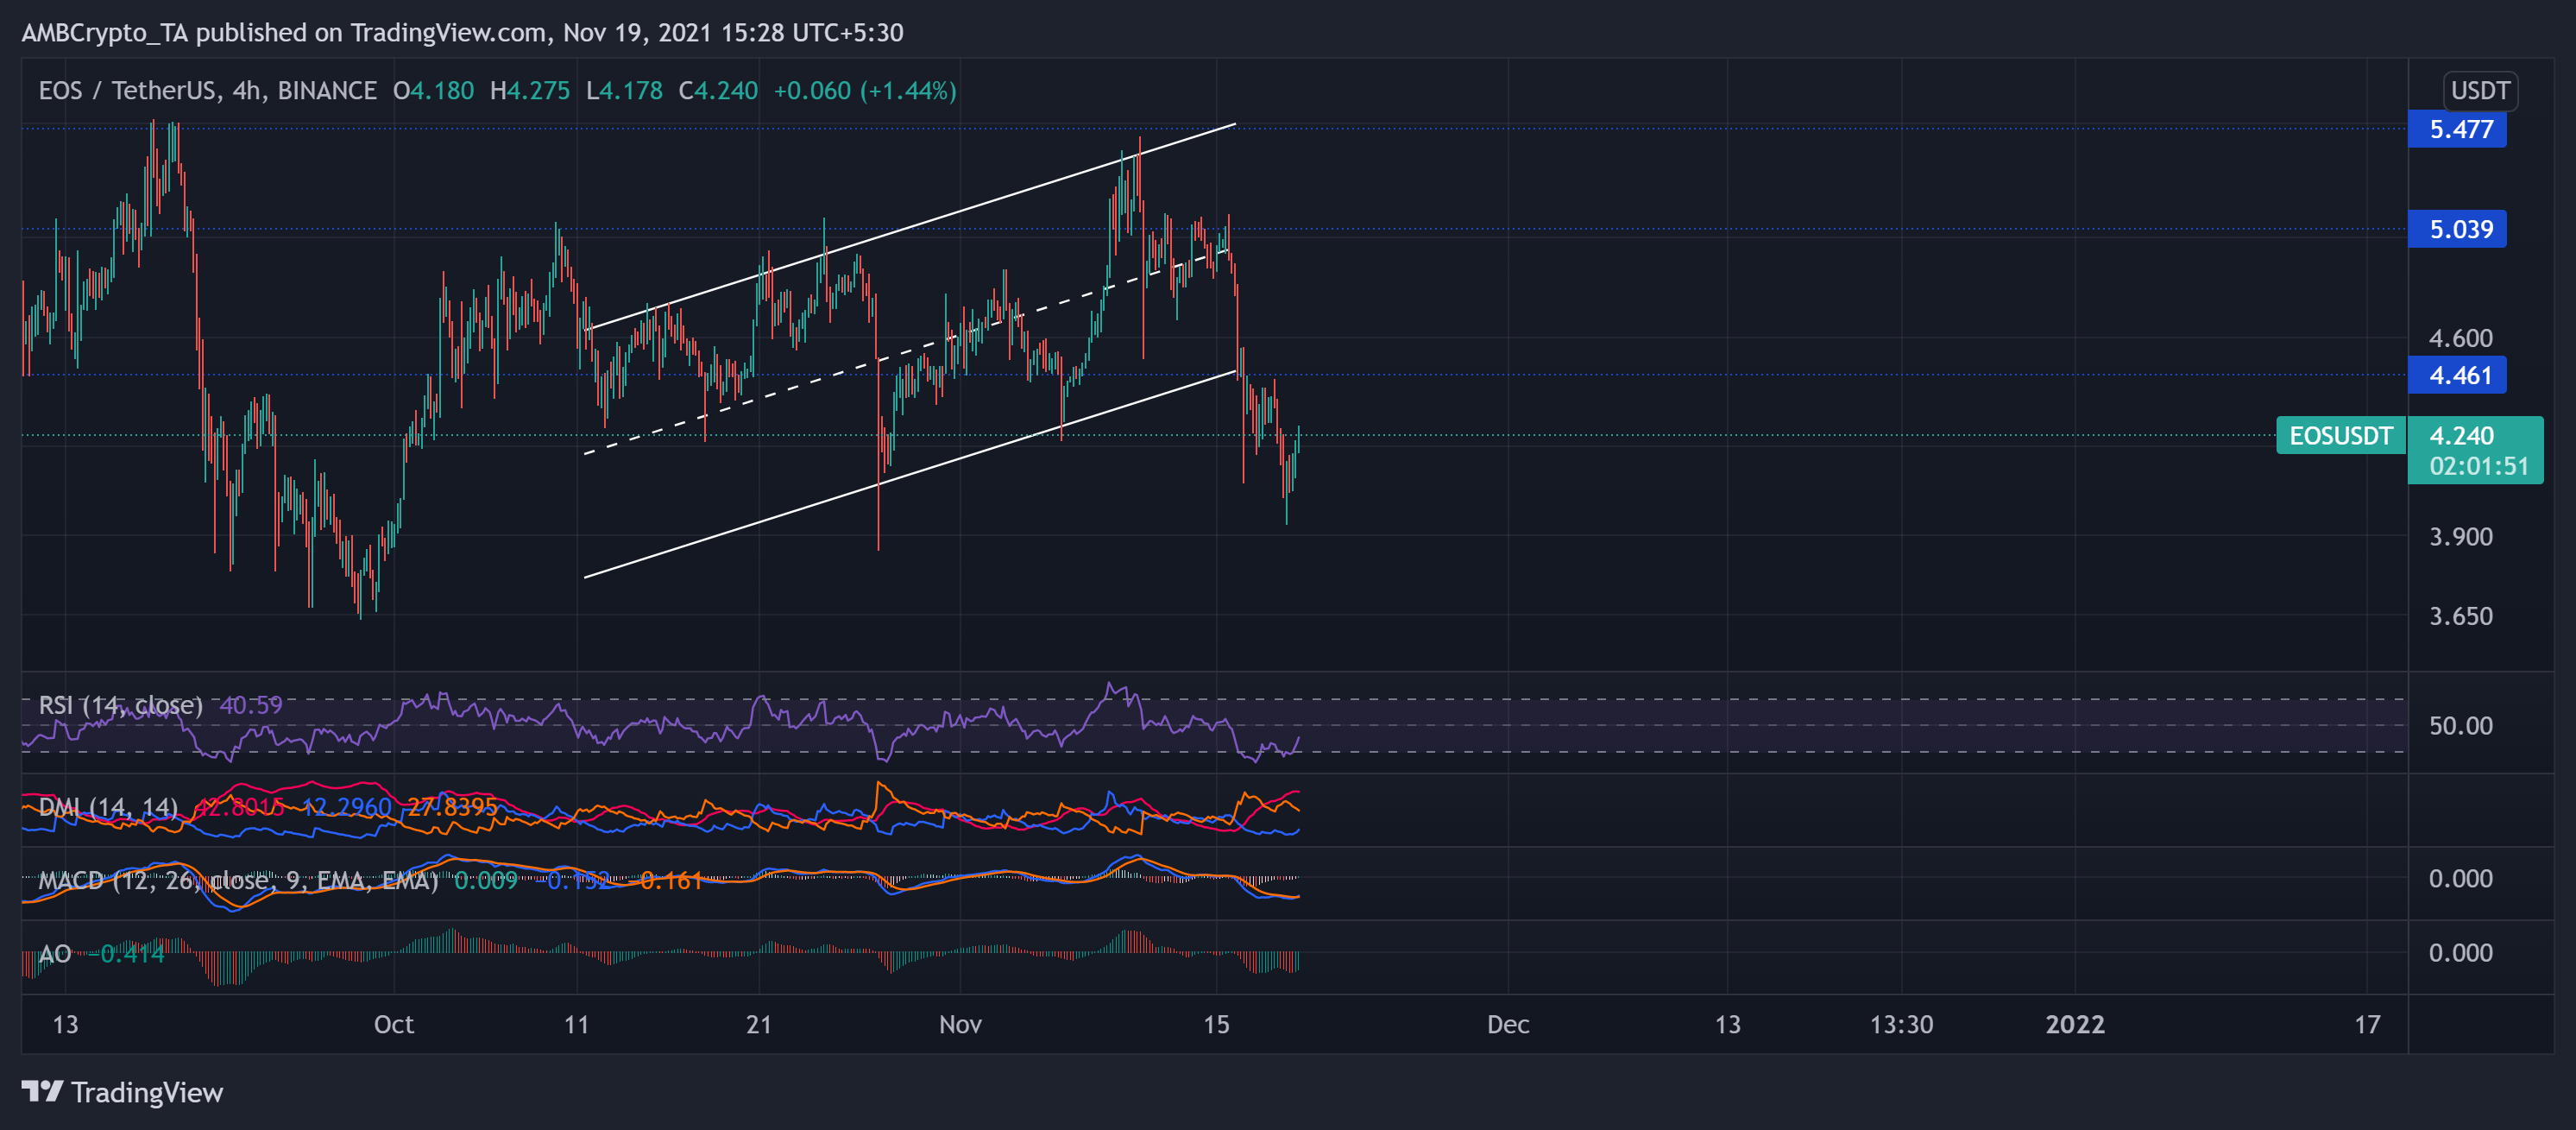
Since 11 October, EOS’s price action has undertaken a bullish trajectory as the price moved between the two parallel lines heading north. The digital currency saw a 20.9% rally over the next month. Consequently, EOS hit its seven-week high on 10 November and retreated between the parallel lines.
The altcoin saw a 25.03% withdrawal over the next week until it hit its seven-week low on 16 November. The near-term technicals resonated with the selling strength with possible ease in its momentum. At press time, EOS was trading at $4.24 after recording a 1.5% increase in 24 hours.
After being on a downtrend, RSI displayed recovery signs as it headed north. Additionally, the DMI preferred the bearish vigor. However, MACD and AO showed possible signs of easing bearish power if bulls continue their rally.