XRP, MANA, Sushi Price Analysis: 15 December

With Bitcoin trading at around $48,000 and Ethereum trading between $3,800-3950, the bearish sentiment was driving most alts, at press time.
The selling pressure was most evident in Sushi, as its bulls failed to uphold the 11-month-long resistance. Also, XRP and MANA charts projected substantial dips along with bearish near-term technicals.
XRP

Although Ripple’s XRP crossed the 38.2% Fibonacci hurdle after an ascending triangle breakout on 9 December, the bulls failed to sustain their edge. As a result, the alt noted a 12.15% six-day decline as it oscillated in a down-channel.
After hitting its monthly milestone on 10 November, the alt steadily took a back seat as the bears took over. Since then, it lost over a third of its value. Even though the bulls failed to uphold the 16-week long resistance at the $0.88-mark, they ensured the $0.765-support. Consequently, the price action bounced back from the lower channel after noting a 1.6% 24-hour gain.
At press time, XRP traded at $0.8026. The RSI has struggled to sustain itself above the midline since the start of the month. Also, the price moved below its 4-hour 20-50-200 SMA. However, the ADX displayed a substantially weak directional trend for XRP.
Decentraland (MANA)
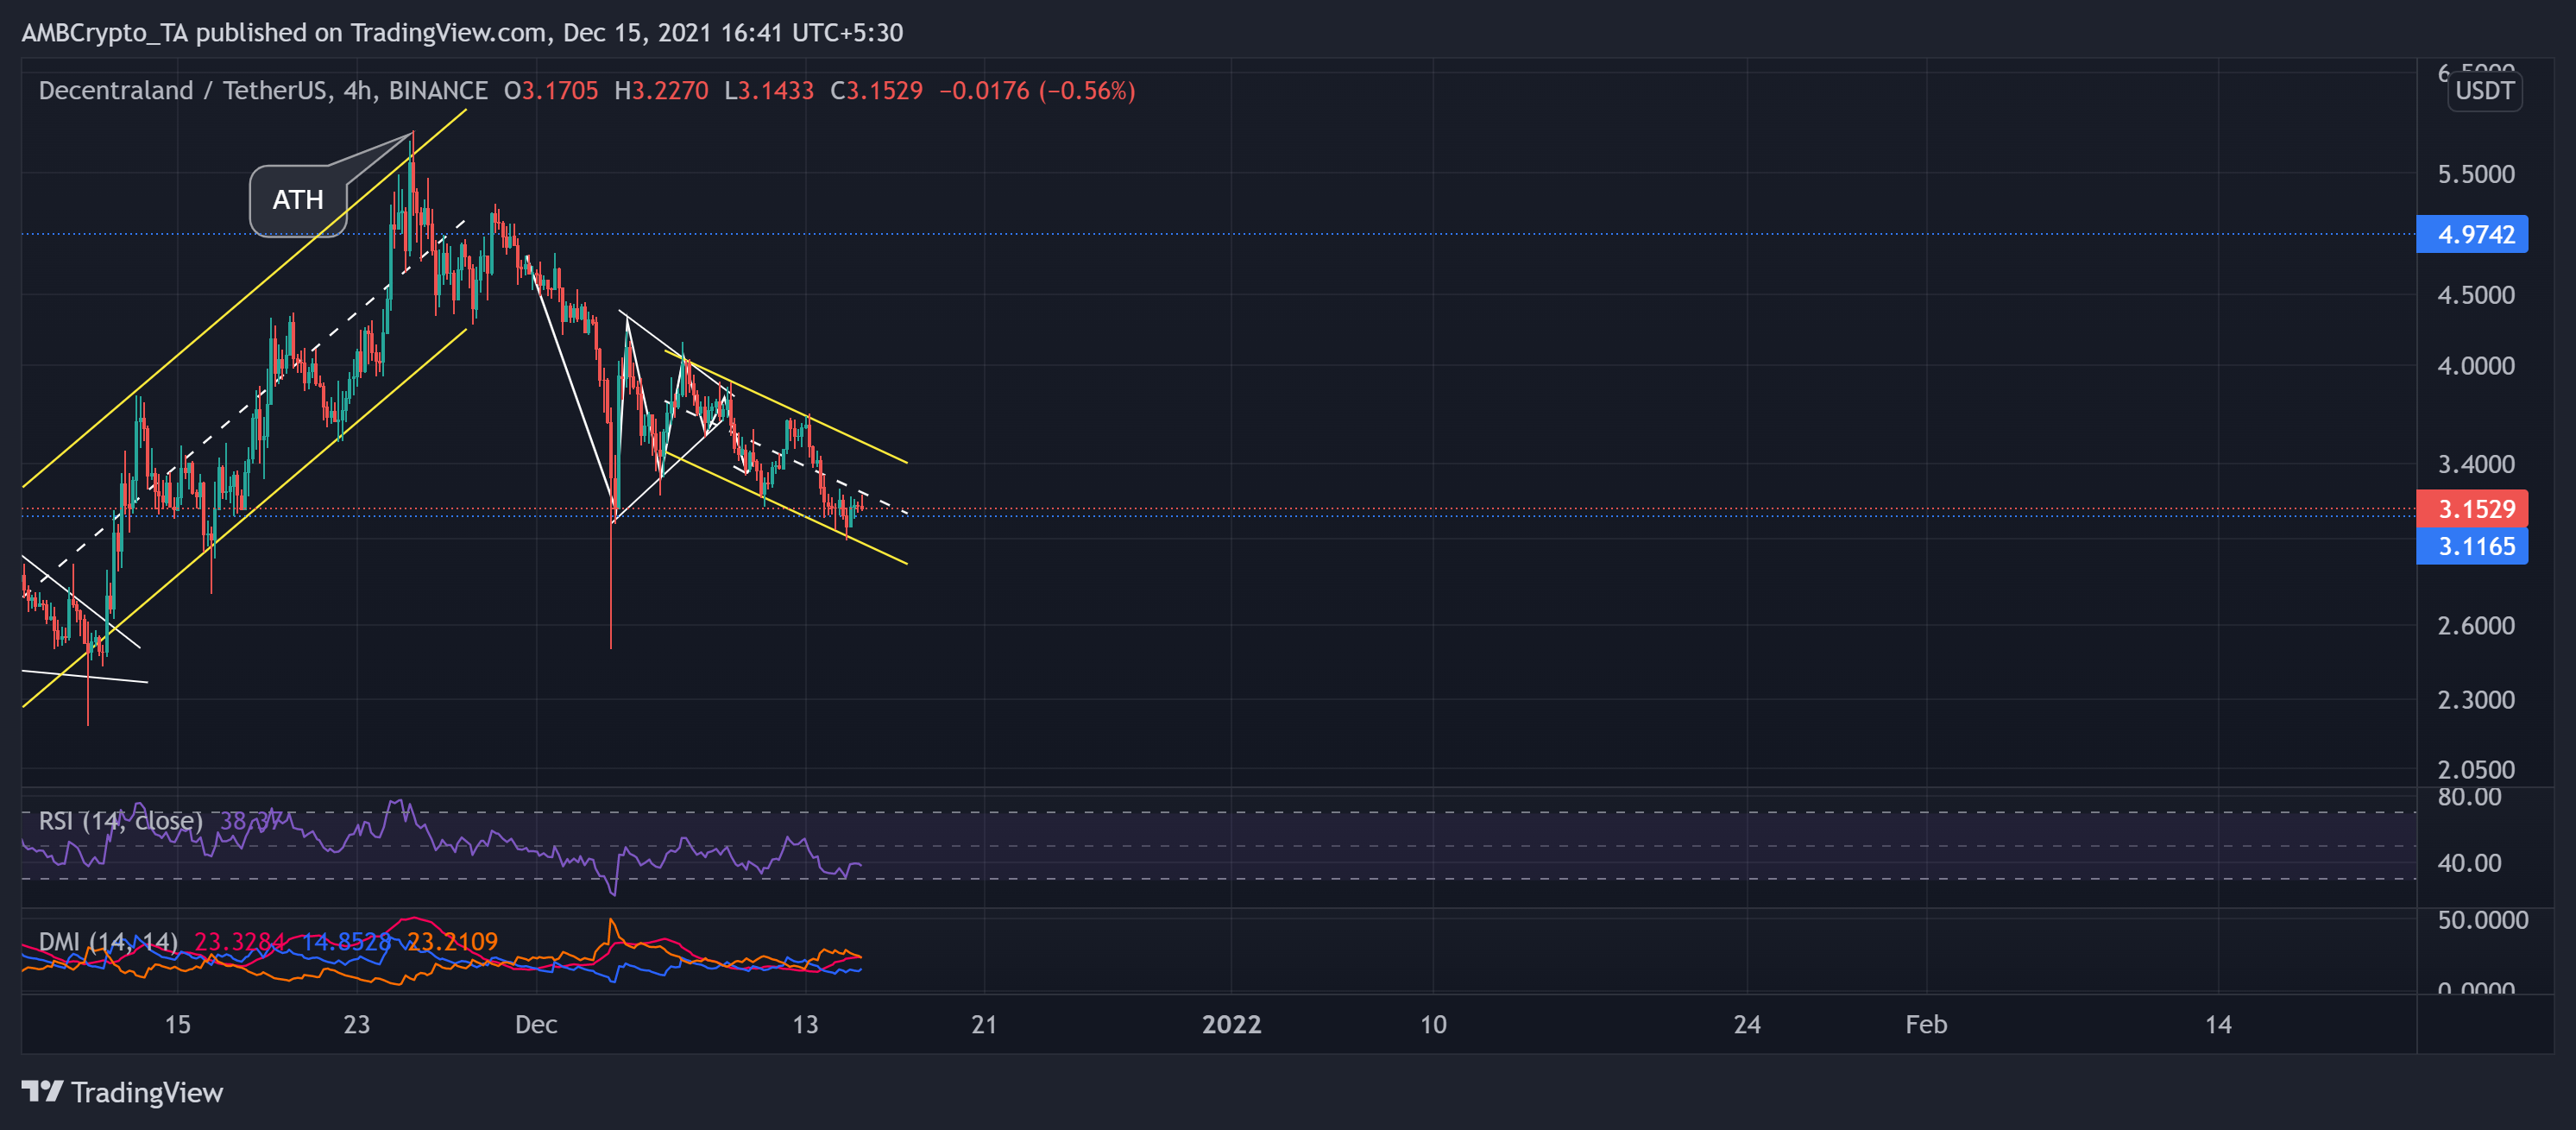
MANA saw a classic bearish pennant breakout on 9 December. This fall transposed into a down-channel after the alt noted a 16.9% decline on its weekly chart. The alt saw a vigorous decline after striking its ATH on 25 November.
Despite the fall, the bulls ensured the one-month support at the $3.11-mark. Now, if the bearish streak continues, the bears could snap the immediate support level in the near term.
At press time, MANA traded at $3.1529. The RSI moved sideways after being in the bearish zone. Further, the DMI depicted selling preference while the ADX displayed a slightly weak directional trend.
SUSHI
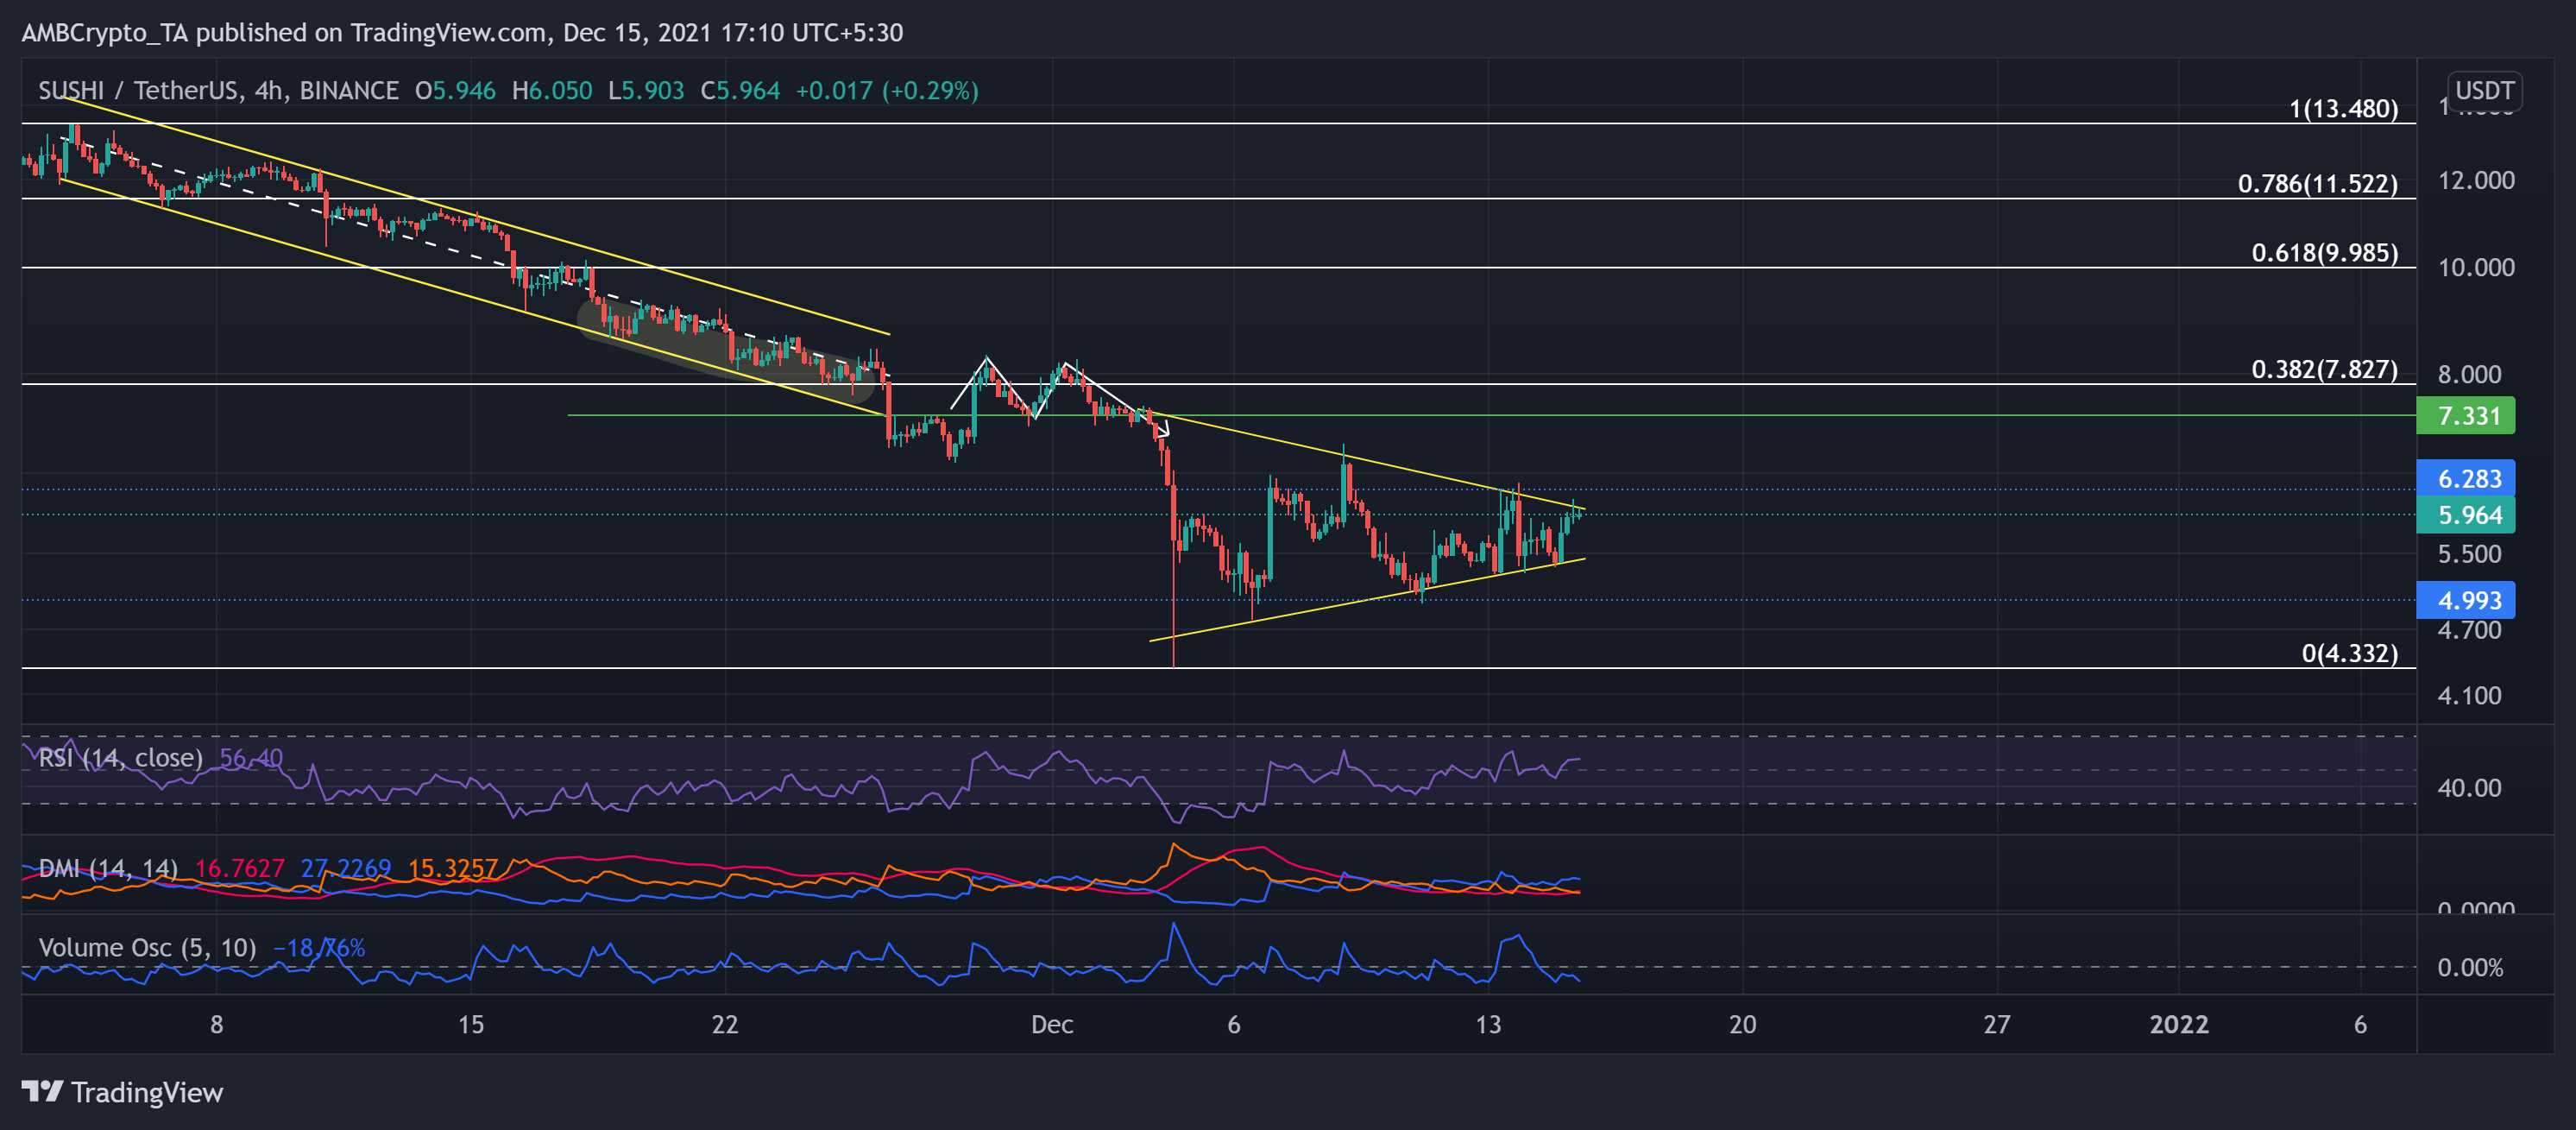
Since 18 November, the price refrained from retesting the upper parallel channel and moved below the midline (white, dashed). Consequently, SUSHI saw a further breakdown and breached the 38.2% Fibonacci resistance. After a slight uptrend on 28 November, SUSHI formed a double-top. As a result, the price saw a breakdown below the 11-month resistance at the $6.2-mark on 4 December.
Over the past 12 days, the alt formed a symmetrical triangle on the 4-hour timeframe. At press time, SUSHI traded at $5.964 after noting a 5.7% 24-hour gain.
The RSI saw a sharp surge and managed to cross the midline. However, it becomes crucial to take note of the decreasing volumes on which the above jump occurred, indicating a weak bullish move. While the DMI flashed a bullish preference, the ADX displayed a weak directional trend.