With the lengthening of market cycle, expect the unexpected from Bitcoin
The Bitcoin market finally seems to have regained its footing, following the volatile deleveraging event last week as BTC’s price finally retested the $48,800 mark. Over the last week, Bitcoin prices were largely range-bound, between the lower $45,600, and higher $51,000 mark.
As BTC finally retested the $48,850 mark, the anticipation of a bullish turn increased in the market but was it too soon to expect that?
Another dip could knock the door
Fear and uncertainty still gripped the BTC market ahead of a key Fed meeting. The Crypto Fear & Greed Index stood at 28/100, up from the Tuesday low of 21/100, presenting a transition from ‘extreme fear’ to ‘fear’ further reflecting the market sentiment for BTC.
However, looking at the Realized Cap’s 7D Oscillator, it was evident that the BTC market has begun to see some significant loss realization, somewhat similar to May 2021. Analysts anticipated that we might stay in this ranging phase before getting back to green days.

Further, the short-term HODLers’ SOPR revealed that the overall trend was on the negative side, meaning that STH were selling mostly in loss. With the anticipated BTC top looking like a distant dream, one reason for the consolidation could be the lengthening Bitcoin cycles.
BTC cycles lengthening
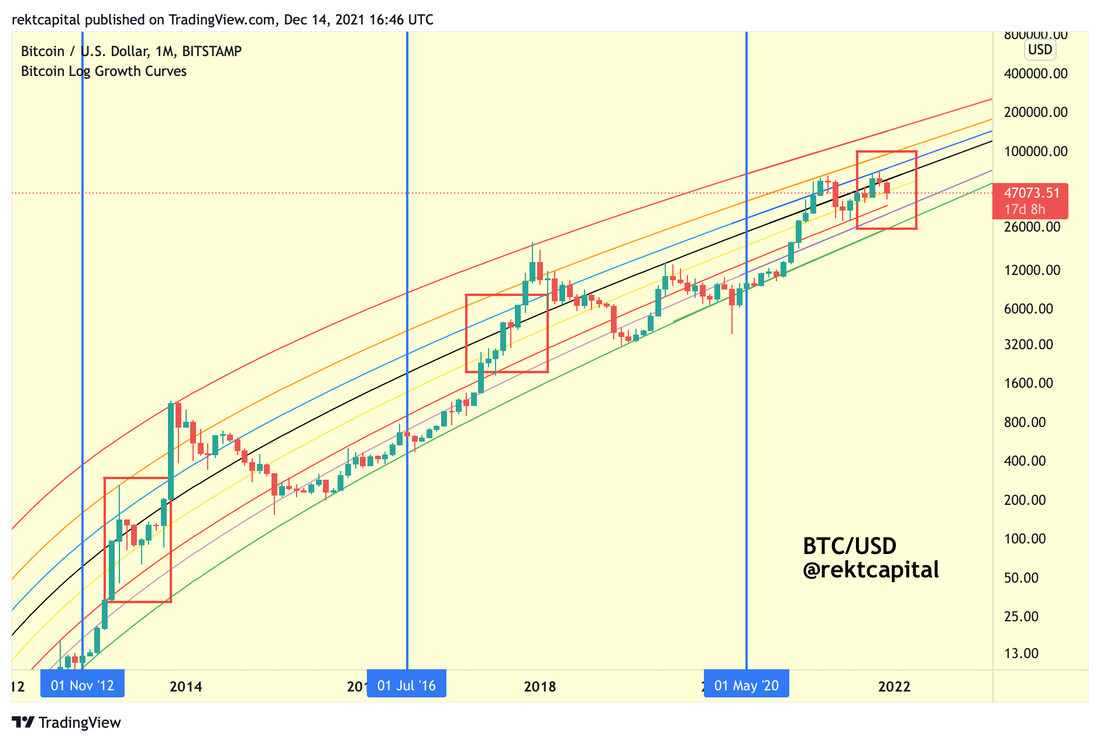
Looking at the lengthening cycle in terms of the actual retest of the black 0.5 Fib Curve support it can be seen that in 2013 when the retest of the 0.5 Fib Curve was complete, it took BTC very little time to rally to the top of the Bitcoin Log Growth Curve channel to peak in its Bull Market. While in 2017 it took BTC almost 3 months to rally to the top after a retest of the level.
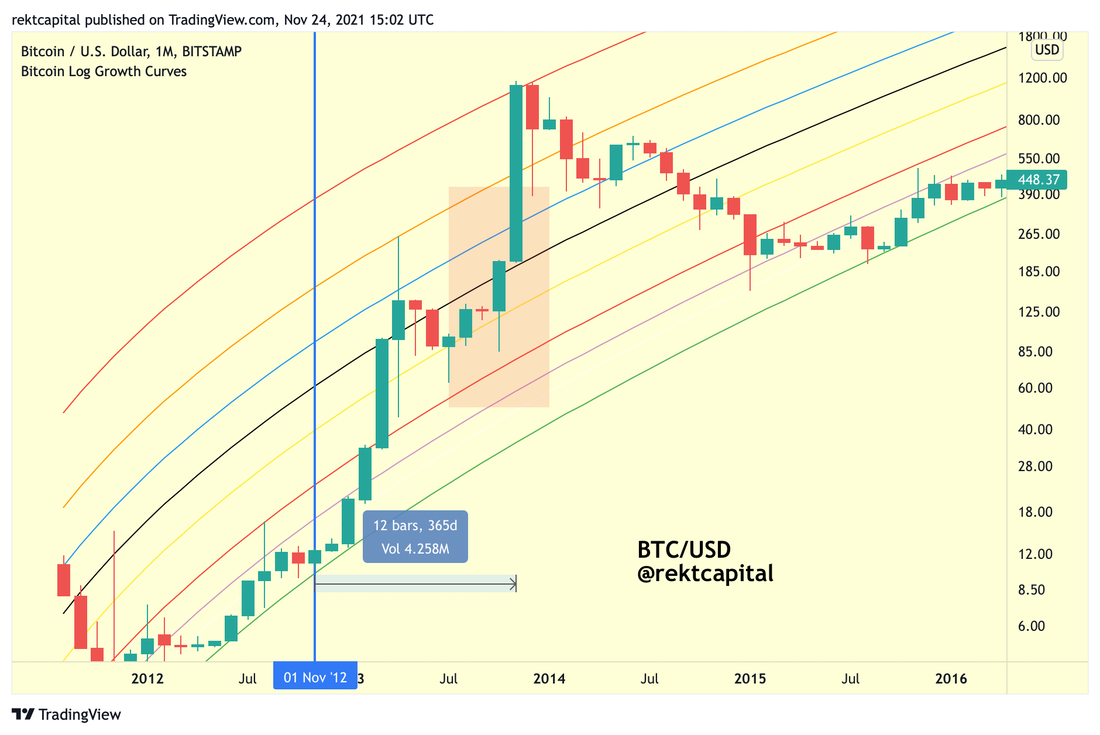
So, it’s possible that with cycles lengthening, BTC is taking more time to test the levels. Notably, post the recent halving, Bitcoin retracted 39% since rejecting the $69,000 zone. A similar retracement was seen in 2017 when BTC dropped by 40% at a similar point in the cycle.
So BTC is pretty much doing the same thing right now, down by 39% and in the process of retesting the yellow 0.382 Fib Curve as support.
For now, for BTC to be back on track, it’s all about maintaining the yellow 0.382 Fib Curve as support, just like it did in 2013 and 2017.
So it seems like with the recent consolidation and the possibility of BTC cycles lengthening, it’ll be best to sit tight and wait as the new top may be a little far.


