XRP, MATIC, The Sandbox Price Analysis: 03 January

While Bitcoin wavered near its 11-week Point of Control, XRP and SAND displayed range-bound oscillation tendencies after breaking down from their 61.8% Fibonacci resistance.
To top that up, MATIC displayed a steady decrease in buying power. However, the directional trend for all the aforementioned cryptos stood quite weak.
XRP
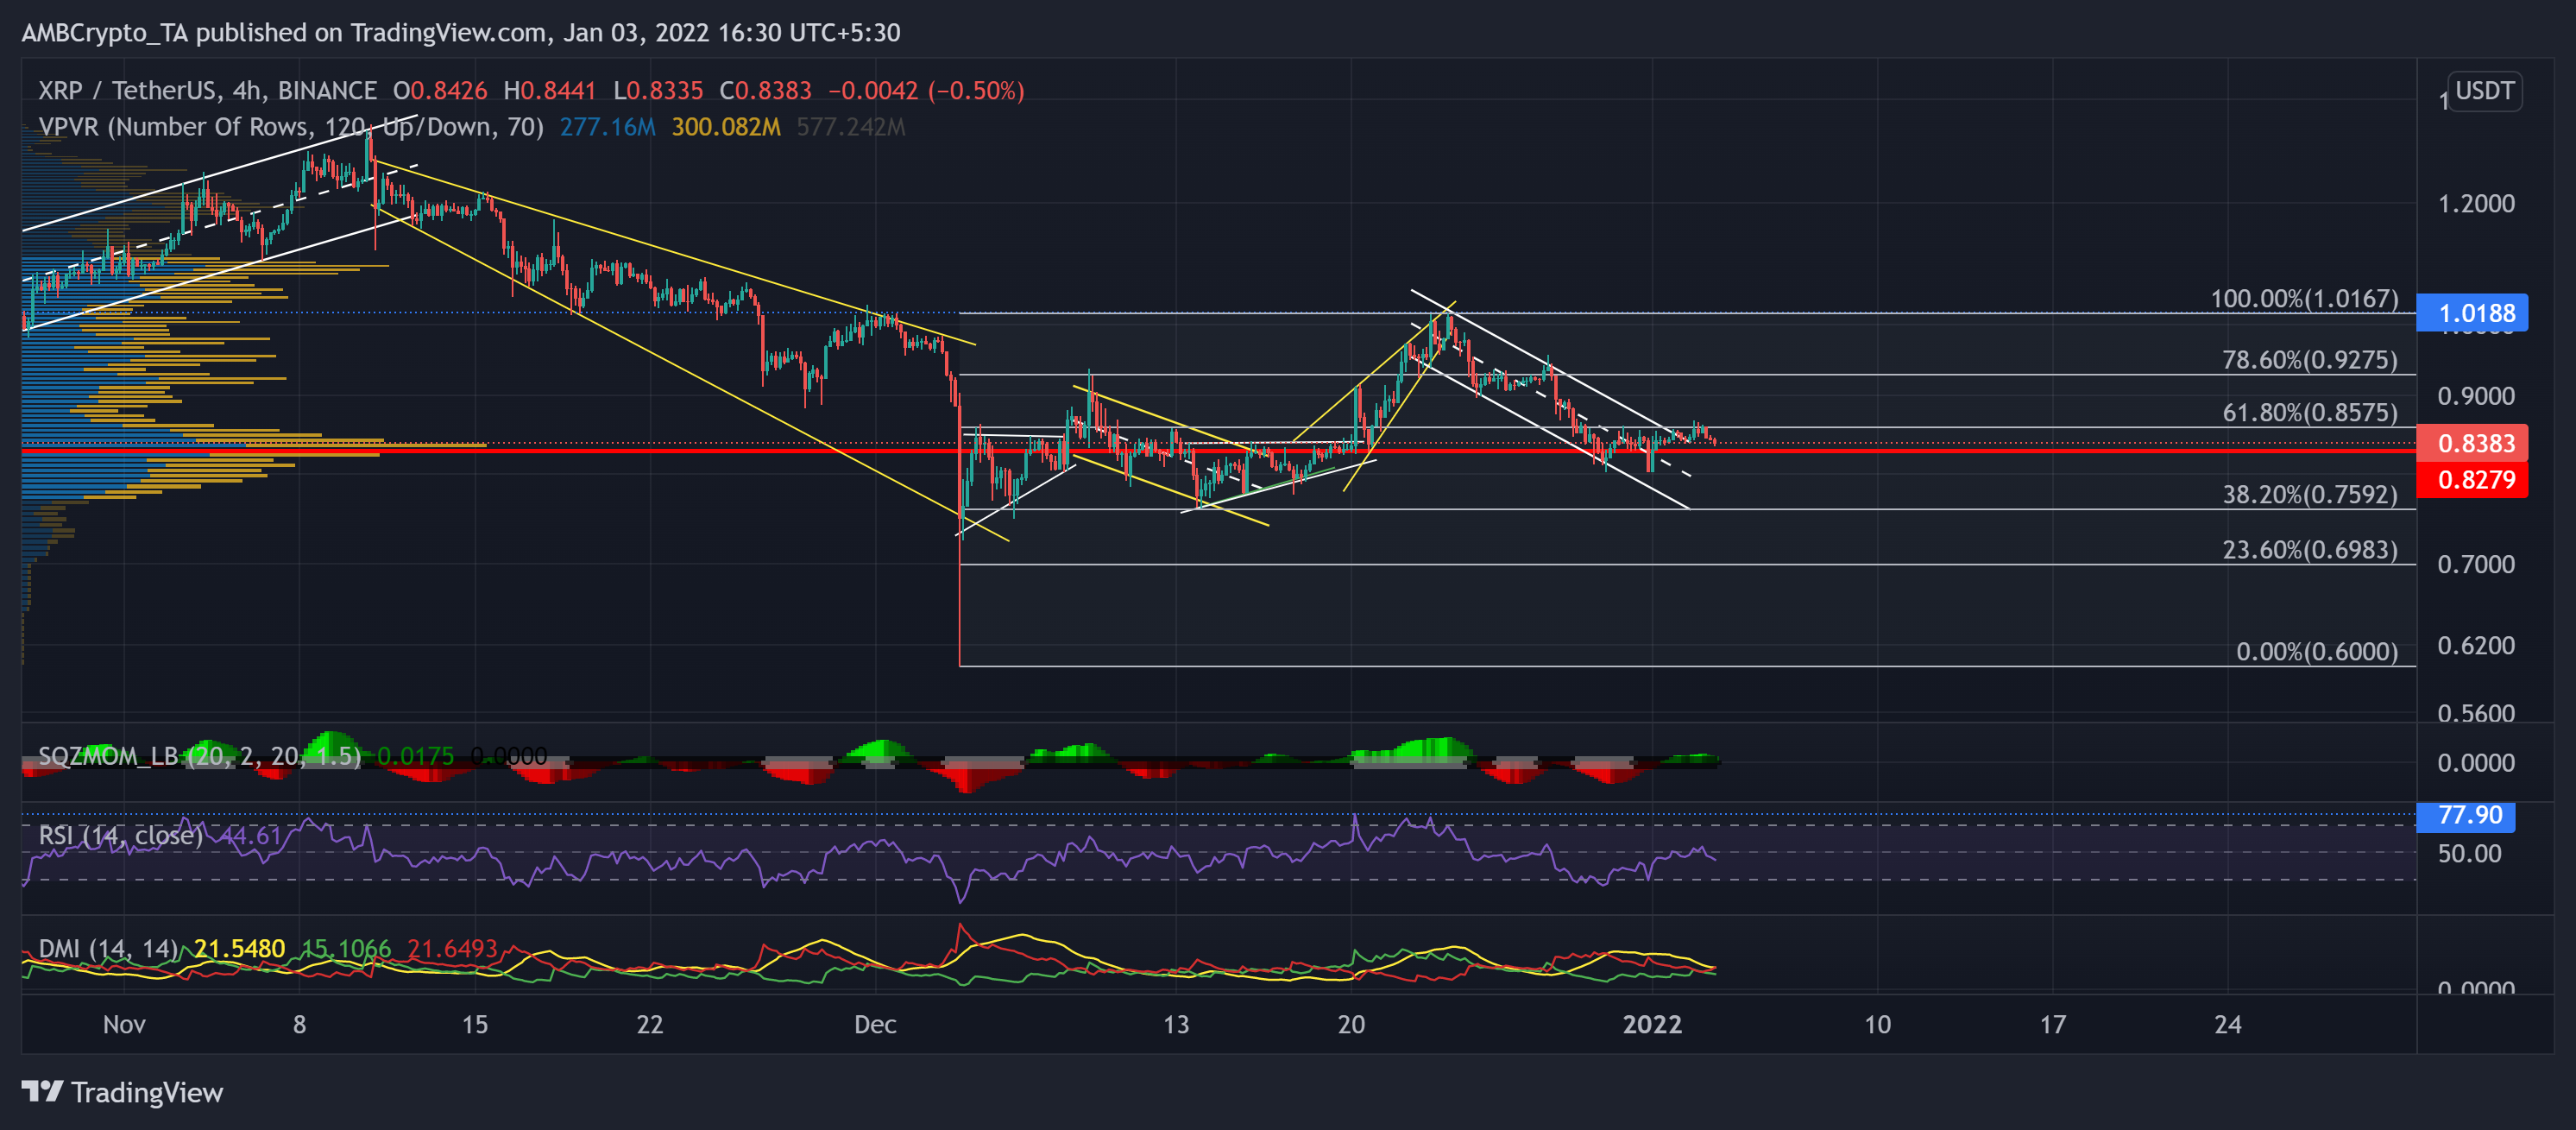
Since its up-channel (white) breakdown, the alt gravitated and found an oscillation range between the $1.01 and $0.774-mark for over a month. While the $1.01 resistance stood strong for over five weeks, the price action retreated in a down-channel (white). With this dip, XRP fell below its 61.8% Fibonacci resistance.
Over the past six days, the bulls retested the golden Fibonacci level multiple times but failed to breach it. Thus, the above level also restricted the down-channel breakout on 2 January.
Now, XRP was near its Point of Control that offered the highest liquidity for over two months. This point also took shape as its immediate support. Meanwhile, the Squeeze Momentum Indicator flashed a low volatility phase.
At press time, XRP was trading at $0.8383. The RSI swayed below the half-line at the 44-mark. The -DI looked north while the +DI headed south, hinting at a near-term bullish setback. However, the ADX of the alt was weak.
Polygon (MATIC)
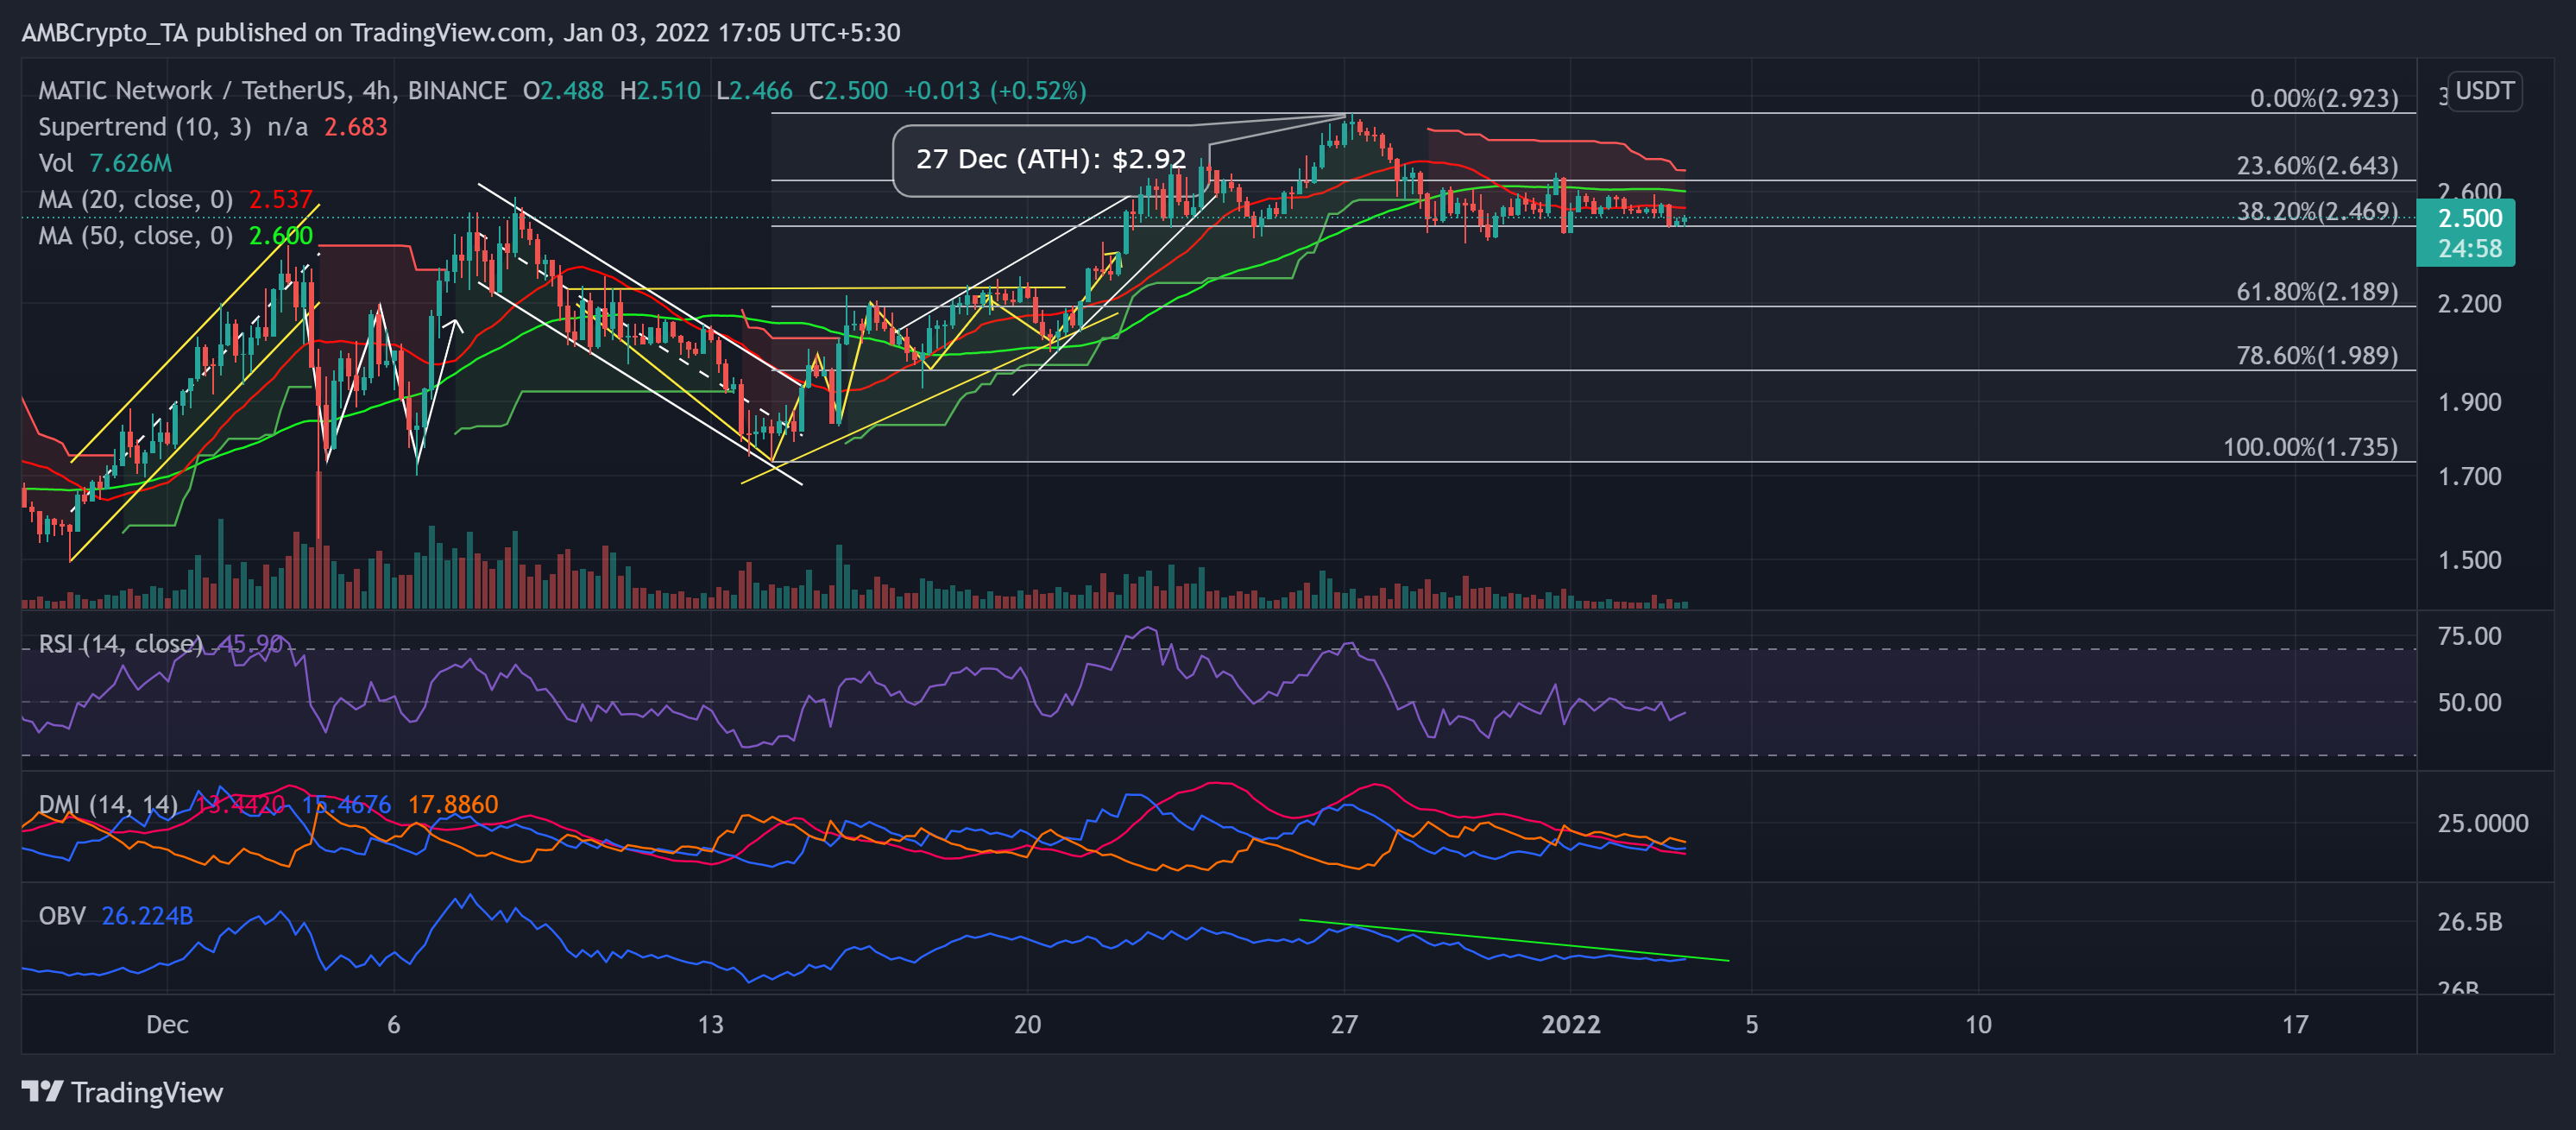
After breaking out of the rising wedge (white), MATIC bounced back from its 38.2% Fibonacci support to encounter its price discovery phase. The alt registered a nearly 70% ROI (from 14 December low) after a powerful rally toward its ATH on 27 December.
Since then, after an over 14.9% retracement, MATIC found support at the 38.2% Fibonacci level once again. Now, the Supertrend flashed sell signals after nearly three weeks. Also, the OBV indicated a decreasing buying power after it saw a gradual descent.
While the trading volumes declined in the last four days, it became difficult for the alt to commit to a sustained trend.
At press time, MATIC traded 14.6% below its ATH at $2.5. Since 28 December, the RSI failed to convincingly close above the half-line. Further, the DMI preferred the sellers but depicted a weak directional trend.
The Sandbox (SAND)
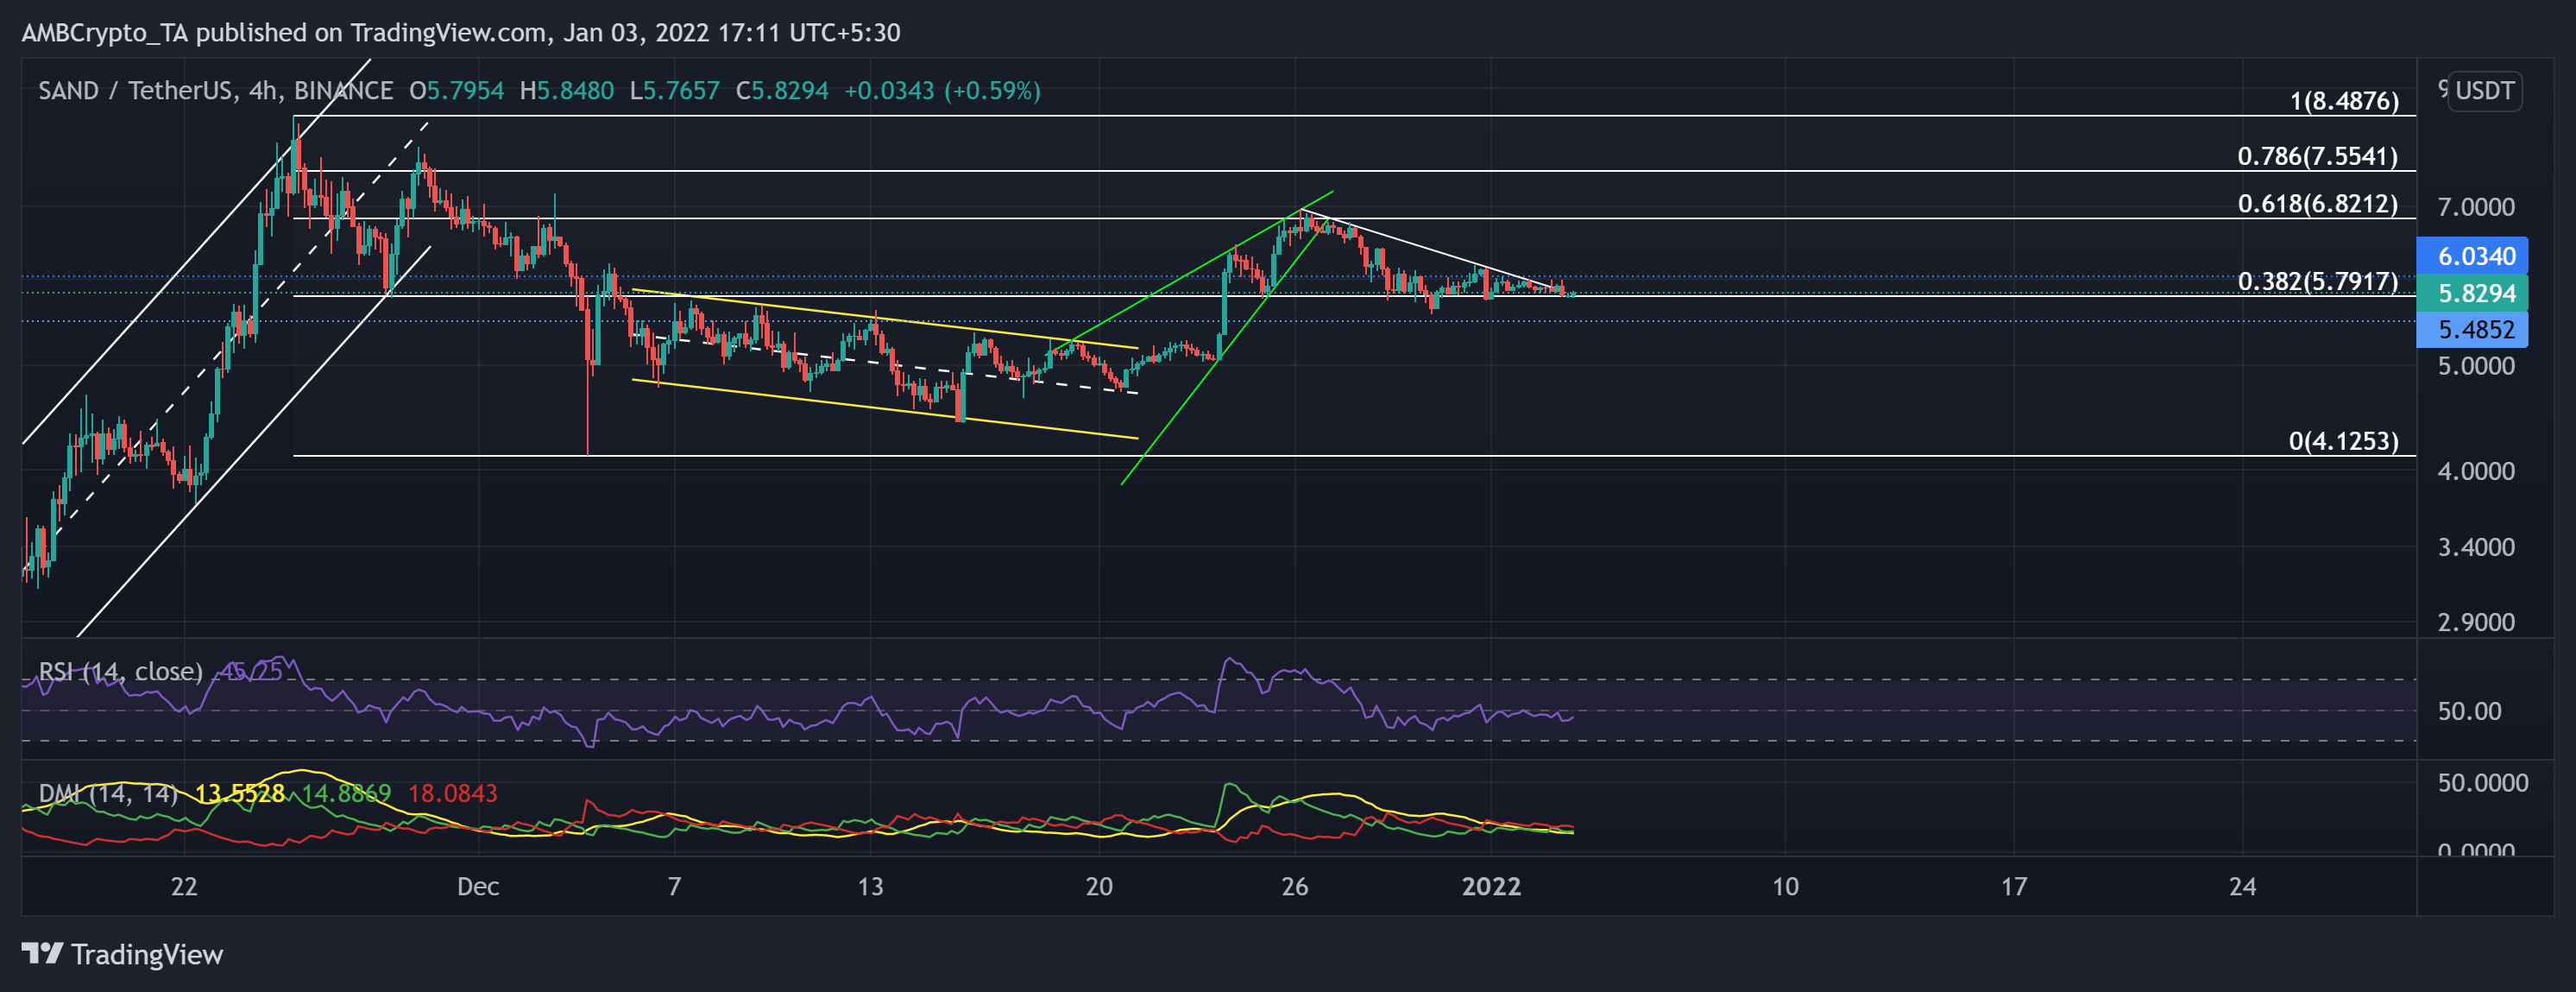
SAND bulls crossed the 38.2% Fibonacci resistance as it reclaimed the crucial $6.03 support after forming a rising wedge (green, reversal pattern).
As the 61.8% Fibonacci stood as a strong resistance, an expected breakdown occurred from the reversal pattern. Since then, SAND saw a 20.39% retracement until it poked its weekly low on 30 December. Any further pullout would find support at the $5.4-mark.
At press time, the alt traded at $5.8294. The RSI was at the 45-mark and continued to find resistance near the equilibrium for the past five days. While the DMI hinted at a bearish preference as well, the ADX displayed a weak directional trend for SAND.