XRP might eye another surge but short-sellers could play spoilsport

Disclaimer: The findings of the following analysis are the sole opinions of the writer and should not be taken as investment advice
A golden cross, symmetrical triangle formation, and a bullish bottom trendline all lined up favorably for XRP. Although the alt’s consolidation between $1.23-$1.26 could extend for a few more days, the chart was paving the way for the next rally. A few risks came in the form of a weakening MACD and a double top pattern on the daily timeframe, but bullish sentiment can be expected to supersede such signals.
At the time of writing, XRP was trading at $1.25 and held the sixth spot on crypto-rankings.
XRP 4-hour Chart
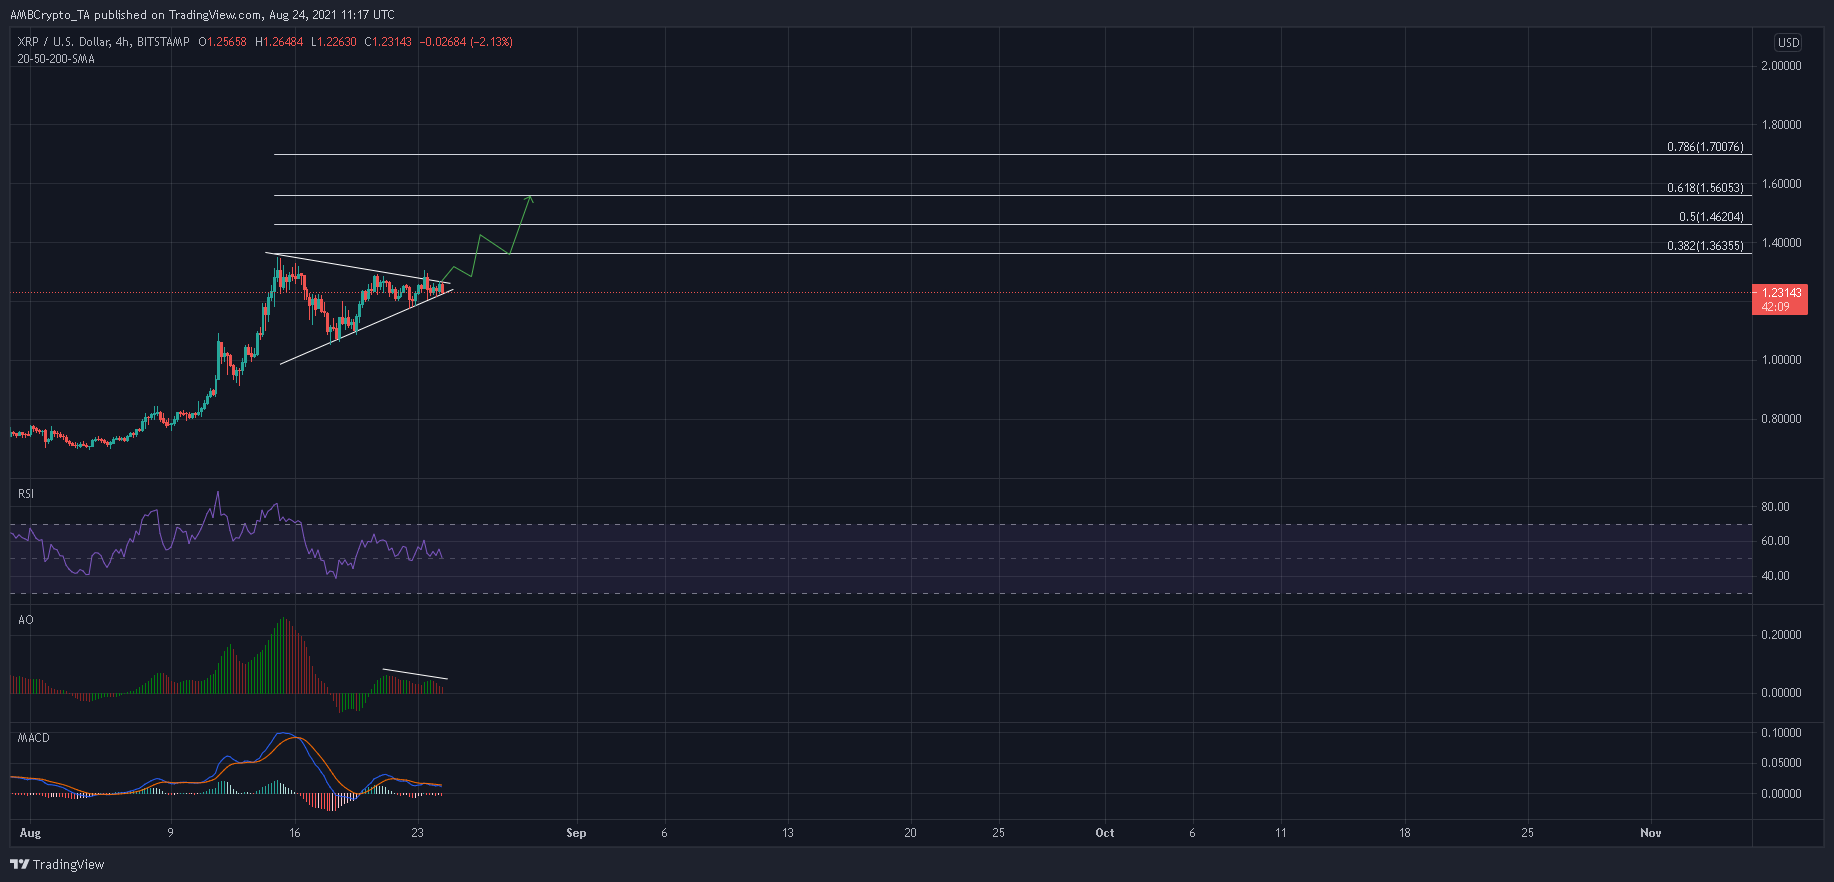
Even though XRP’s recent movement has been stagnant, the formation of a symmetrical triangle presented chances of a sharp northbound move. The Fibonacci Extension plotted potential targets around the 50% and 61.8% Extensions of XRP’s impulsive retracement from a near 3-month high $1.35 to a swing low of $1.05.
In such a case, a close above $1.28-1.30 would provide confirmation of a bullish outcome. Over here, its important to mention that XRP’s golden cross transpired 10 days ago. This can be expected to play out positively for XRP bulls in the coming days as well.
On the other hand, short sellers would be interested in case XRP dips below the $1.18-mark. Another potential threat may rear its head in case XRP forms a high at $1.35 but fails to move higher. This would lead to a double top formation- a bearish setup.
Reasoning
It is important to assess XRP’s indicators on both timeframes (4-hour and daily) to gauge a better understanding of their positions. The daily RSI was trading below the overbought zone and paved the way for another impulsive move to the upside.
On the lesser timeframe, the RSI formed lower peaks but was expected to find support around 50. Such a development is normal in an uptrend. The 4-hour Awesome Oscillator threatened to fall below the half-line on the back of a bearish twin peak. However, the same was at conformable levels on the daily chart.
What’s more, the daily MACD was on the verge of a bearish crossover while the 4-hour noted lower highs. A move below the half-line often functions as a sell signal in the market.
Conclusion
Considering XRP movement of late, the scale was tipped in favor of an upwards breakout. The daily RSI traded in a bullish position and lent credence to another price swing. While chances of such an outcome seemed to be high, they were not a certainty. XRP does need to combat some warning signals to avoid a possible sell-off.


