Analysis

XRP needs to fulfil these conditions to confirm a bullish bias
Posted:
| Last updated: January 30th, 2024
Journalist

Disclaimer: The findings of the following analysis are the sole opinions of the writer and should not be considered investment advice
Last month, a report found that XRP supply distribution charts showed whales were accumulating more of the token, even as the XRP lawsuit dragged on. Over the last few weeks, Bitcoin Dominance has been climbing slowly from the 40% mark to 44.2% at press time.
This metric showed that Bitcoin has been steadily absorbing more of the capital in the crypto-sphere. This capital is flowing out of altcoins and into Bitcoin. A trend of rising BTC Dominance does not make for a good buying opportunity on altcoins.
XRP- 1 day chart

Source: XRP/USDT on TradingView
On the price charts, XRP has been trading within a descending channel (white) since mid-August last year. There was a deviation beneath the channel lows in late January. The mid-point of the range has been respected as support and resistance in the past. This lent credence to the notion of the channel pattern.
Over the past month, the price has been compressing within the yellow trendlines. This price action is generally followed by a break upward or downward, which would only be confirmed once one of the trendlines is broken and retested.
The $0.76 and $0.88-levels offer immediate resistance, while the $0.8 area can also act as a supply zone in the days to come.
Rationale
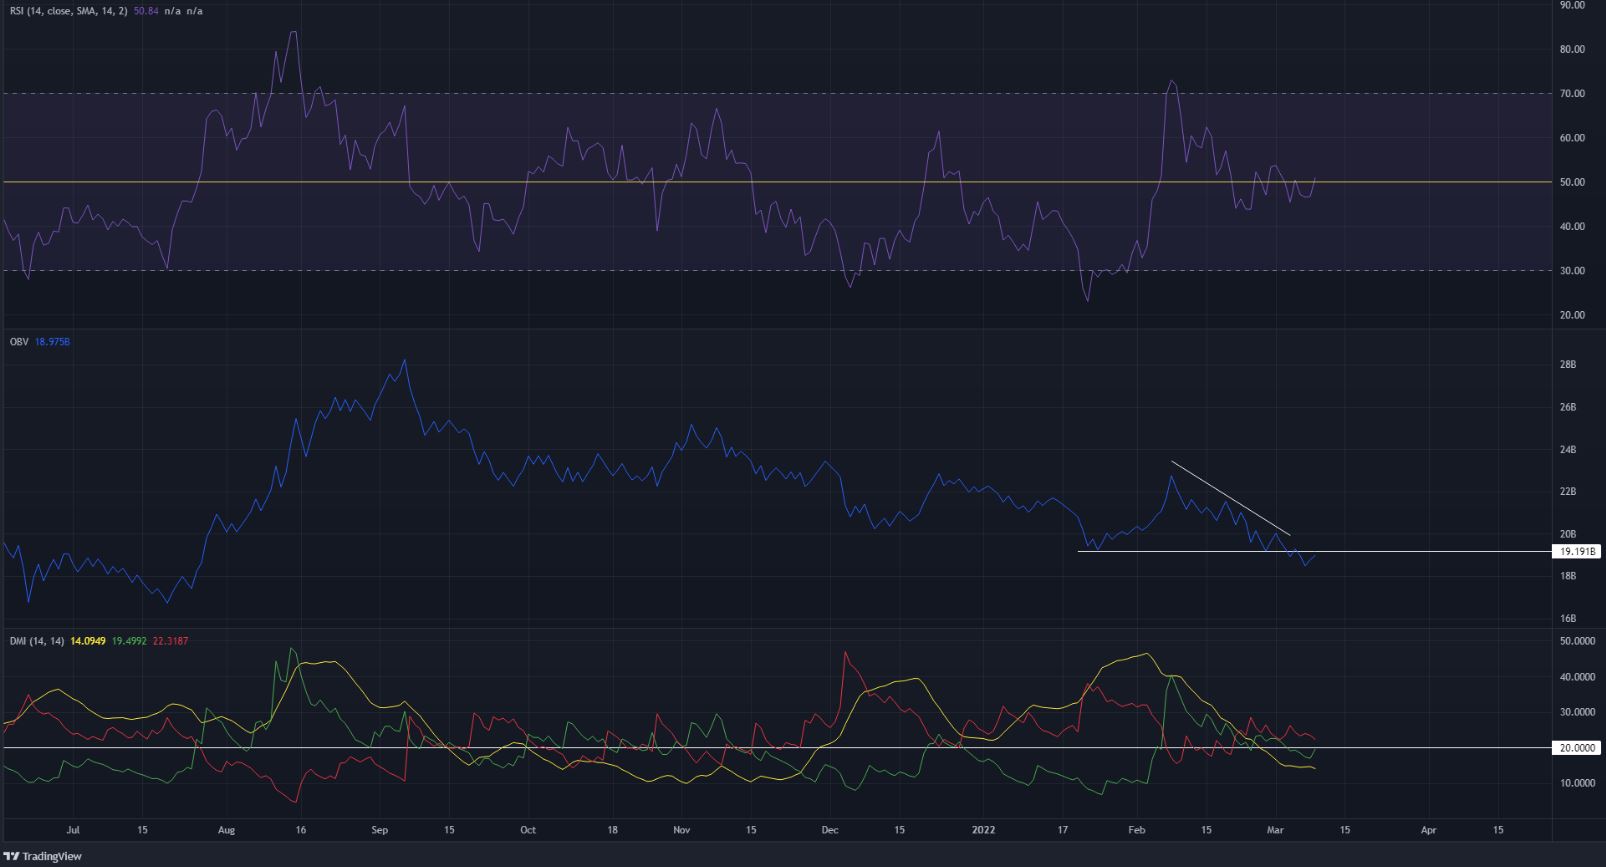
Source: XRP/USDT on TradingView
Alongside the compressing price action, the RSI has also hovered about the neutral 50 line indecisively over the past few days. At press time, it stood at 50.8. The OBV has been declining in the past couple of weeks and slipped below a low it reached in January. This indicated that selling volume has steadily increased.
The Directional Movement Index did not show any strong trend in progress – which was in agreement with the compression in recent days.
Conclusion
The indicators showed that sellers were likely to remain the dominant force. The long-term market structure looked to have been broken in the early-February rally. As things stand, XRP would need to flip the $0.8 area from supply to demand in order to have a longer-term bullish bias.
Even in that scenario, $0.88 and $1-levels could pose significant resistance to the bulls on the way up. To the south, $0.69 and $0.64 levels would offer support but unless demand is seen, these levels might not offer a buying opportunity.