XRP, Polkadot, Decentraland Price Analysis: 5 November

While the market heavy-weights witnessed a slight surge, altcoins like XRP, Polkadot, and MANA were in the red, over the past day.
XRP followed a bullish price trajectory and hit its two-month high while Polkadot touched its ATH on 4 November. Decentraland’s MANA saw exponential gains and touched its ATH on 31 October. However, near-term technical indications for all the aforementioned altcoins show possible ease in bullish momentum.
XRP
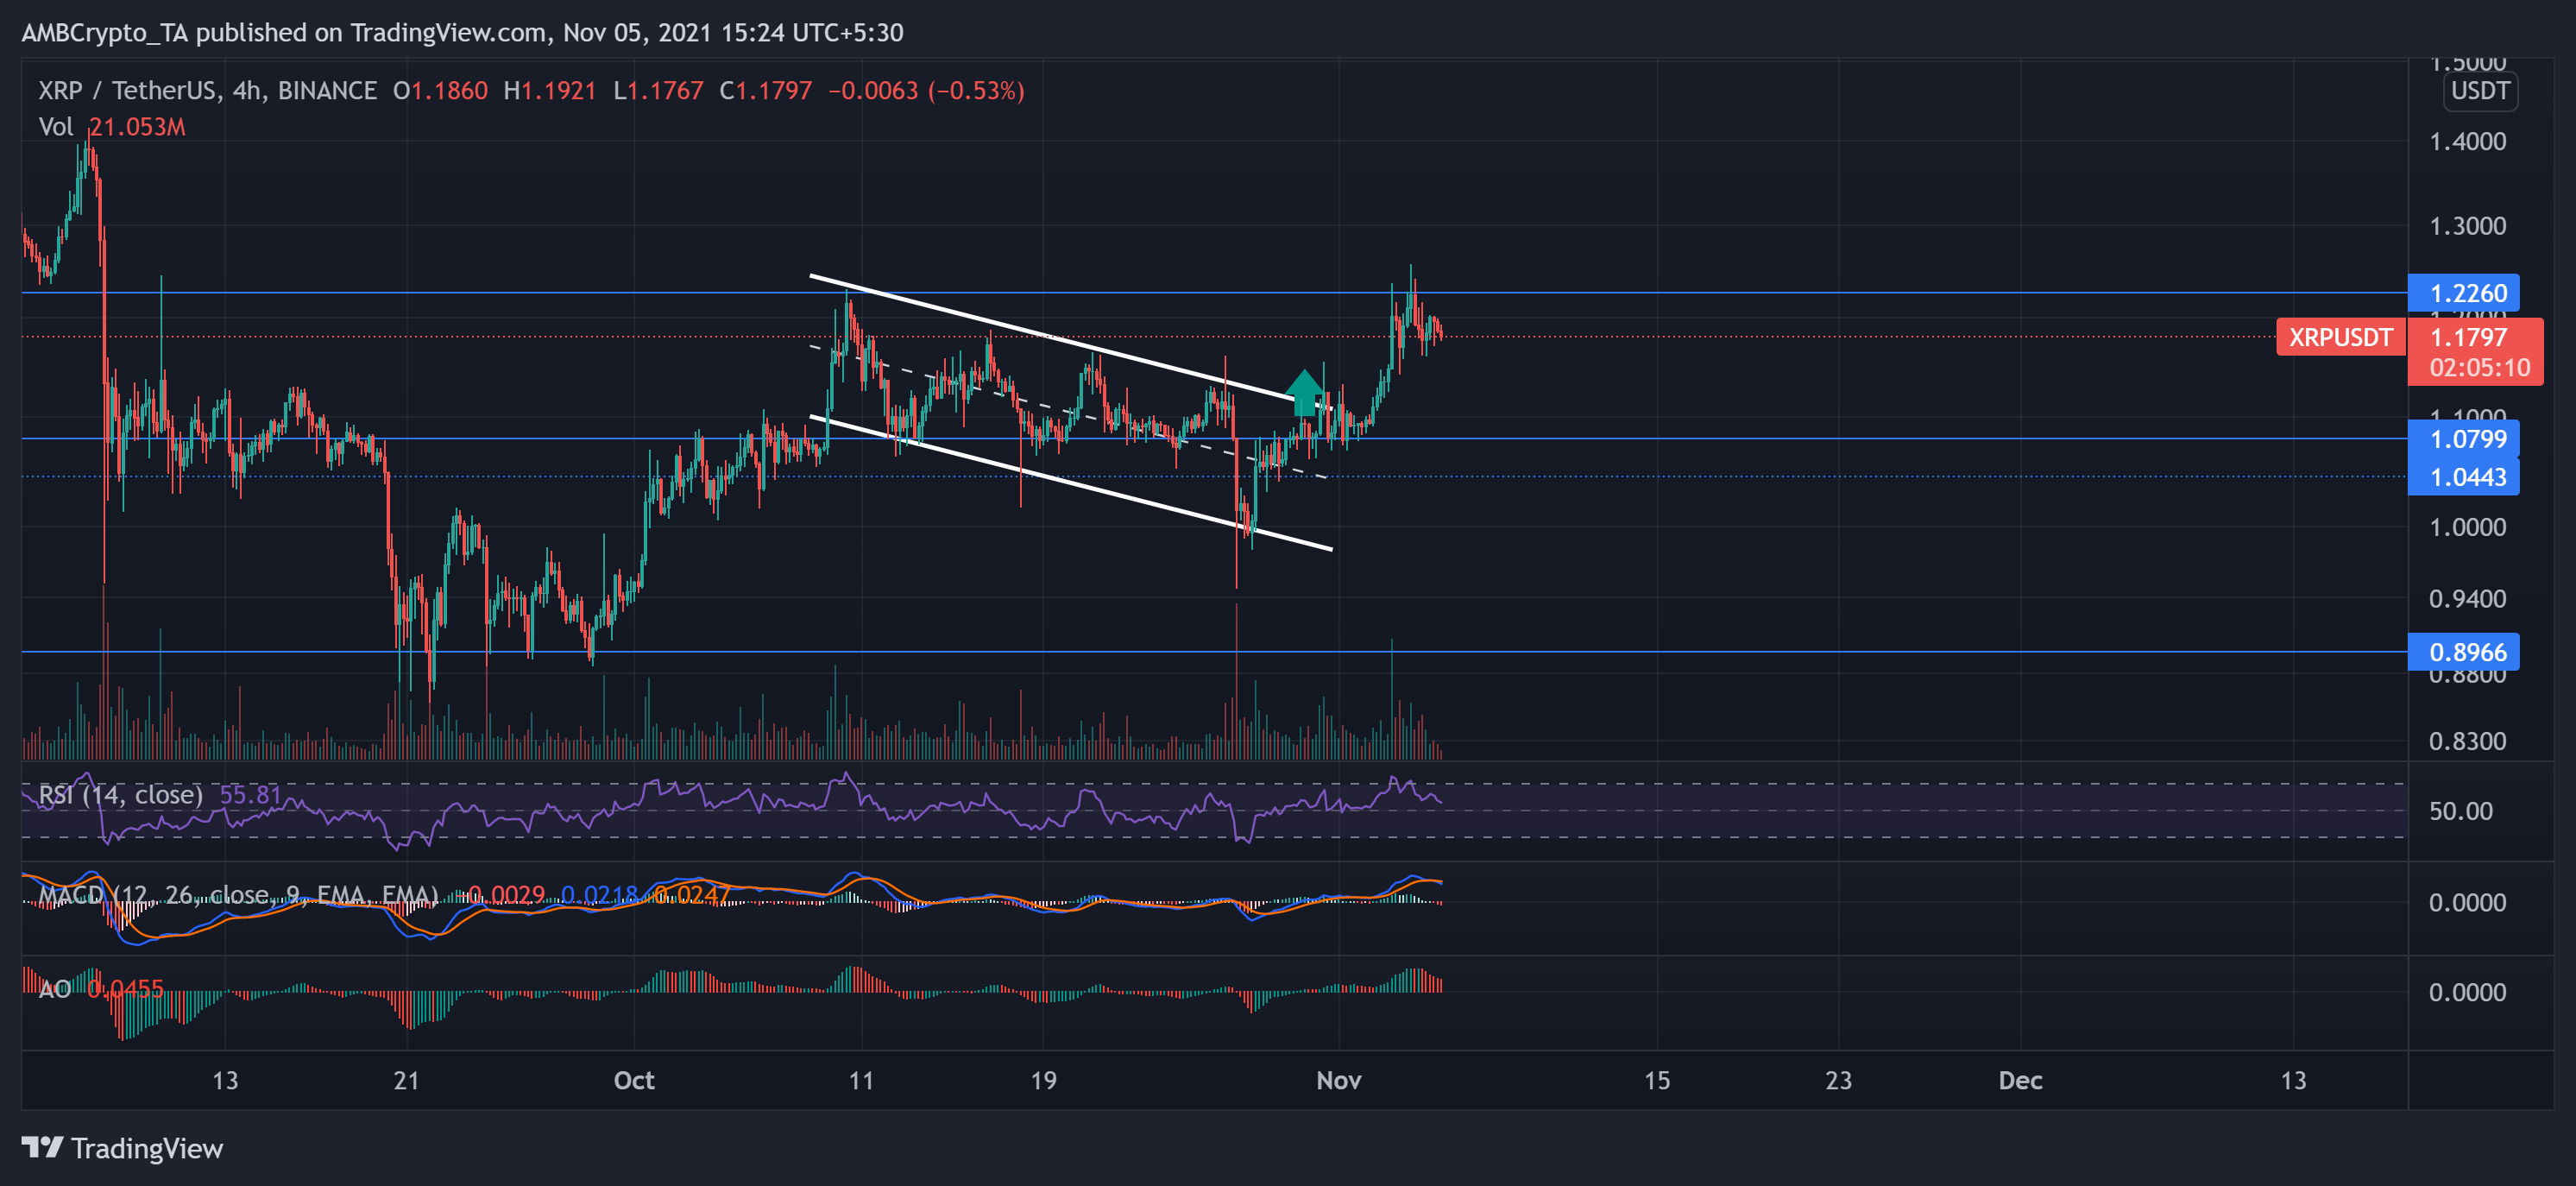
Until 31 October, Ripple’s XRP oscillated in a downtrend between two parallel lines by noting decreasing highs. After plunging to its four-week low on 27 October, XRP bulls triggered an uptrend as the price action witnessed a nearly 10% Weekly ROI.
As a result, the price ruptured its upper trendline to touch its two-month high on 4 November. Now, the price action saw a slight pullback as the digital currency noted a 0.93% loss in the past 24 hours and traded at $1.1797. XRP bears displayed resistance at $1.2260 while the bulls exerted constant pressure.
The near-term technical indicators suggested a preference for buyers but pointed at decreasing buying momentum.
Thus, the Relative Strength Index (RSI) rushed south after diving from above the overbought territory toward the midline. Additionally, MACD Histogram and the Awesome Oscillator (AO) flashed red signals and indicated decreasing buying power.
Polkadot (DOT)

After a sustained bullish rally of nearly three months, DOT registered a 150.07% three-month ROI. Since 8 September, DOT saw exponential growth and noted an approximately 90% gain until date. As a result, the price breached all the immediate support points and touched its ATH on 4 November at $55.09.
However, the near-term technical indications and decreased trading volumes visibly indicated a decrease in buying momentum. Consequently, DOT traded at $52.26, near its resistance level after noting a nearly 0.60% decline in 24 hours.
The RSI was southbound after it plunged from above the overbought territory toward the half-line over the last day. Additionally, MACD Histogram and the Awesome Oscillator (AO) flashed red signals and indicated decreasing buying power.
Decentraland (MANA)
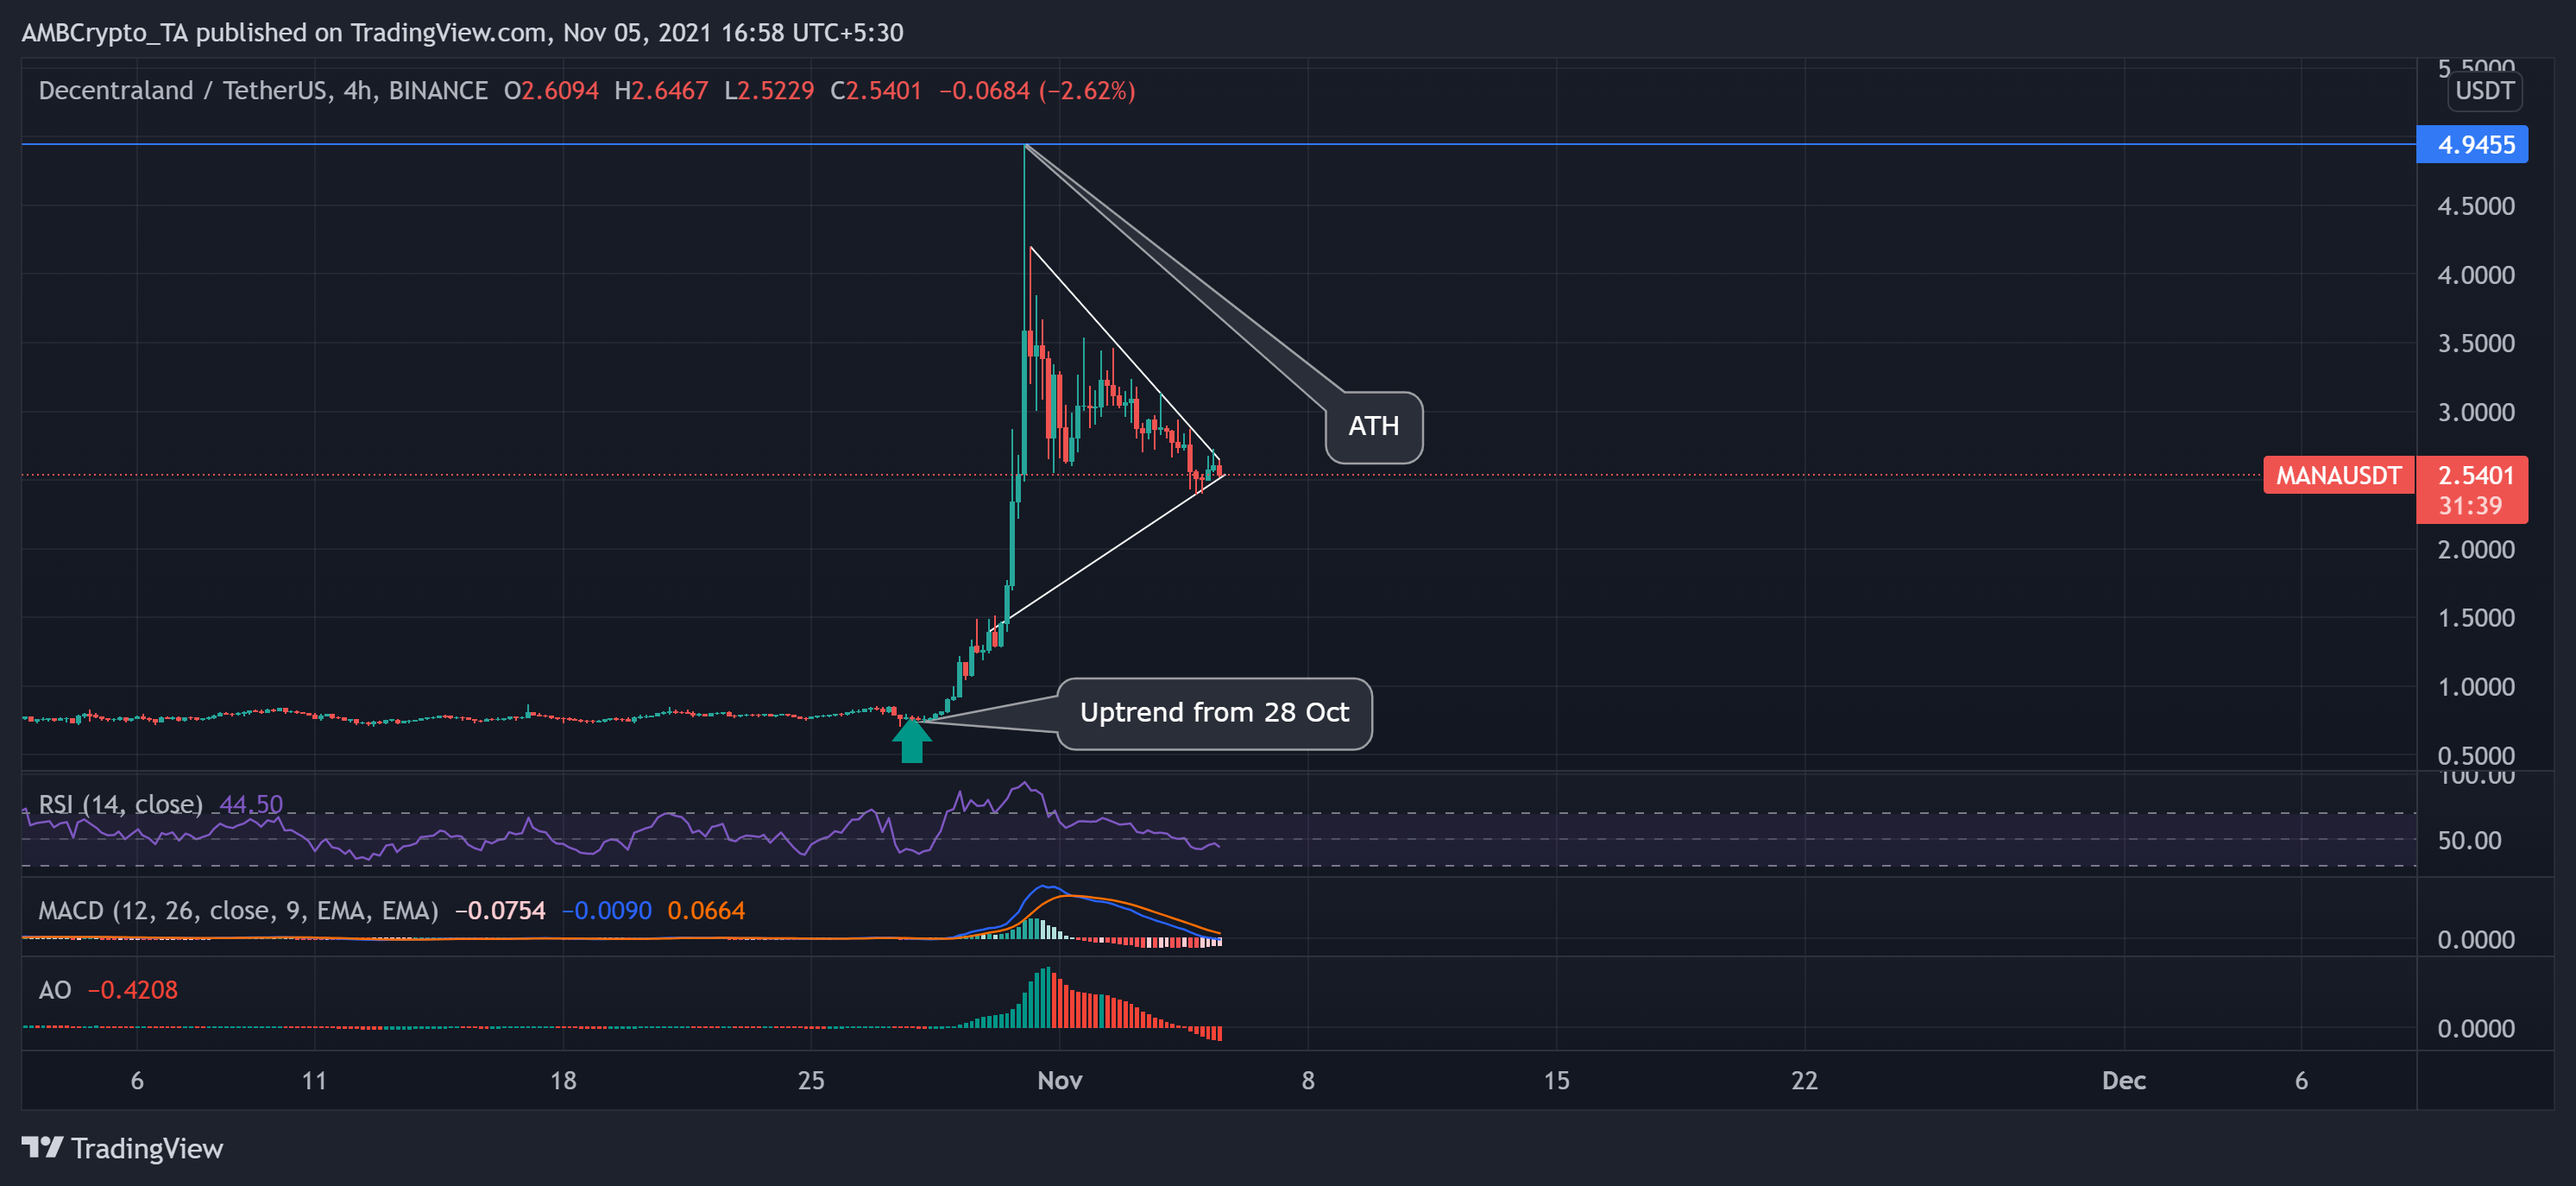
Ethereum-powered Decentraland, the 3D VR platform’s native token, witnessed exponential gains from 28 October. After Facebook’s rebranding to Meta, MANA’s price rallied by over 520% to touch its ATH on 31 October at the $4.9-mark. Since then, the price action has been heading south as the buying momentum eased.
Near-term technical indicators suggest a decreasing buying power. As a result, MANA traded at $2.5401 after noting a 9.3% loss in 24 hours.
The RSI was in a downtrend at the 44-mark, suggesting a preference for the sellers. Also, the AO marked lower peaks while the histogram flashed red signals. This reading corresponded with the RSI. Additionally, the MACD headed south and reaffirmed the selling strength.
However, the MACD histogram flashed shorter light red bars, hinting at a possible revival of the bulls if they sustain their pressure.