Analysis

XRP, Polkadot, Terra Price Analysis: 19 September
Posted:
| Last updated: January 30th, 2024

Altcoins such as XRP, DOT and Terra have all shown lateral trading with minor losses over the last 24 hours. XRP’s continued consolidation could push it below the dollar mark, to trade near $0.94. DOT was inching towards its immediate price floor of $33.37. Lastly, Terra was moving towards its one-week low of $25.93 after recording a minor loss.
XRP
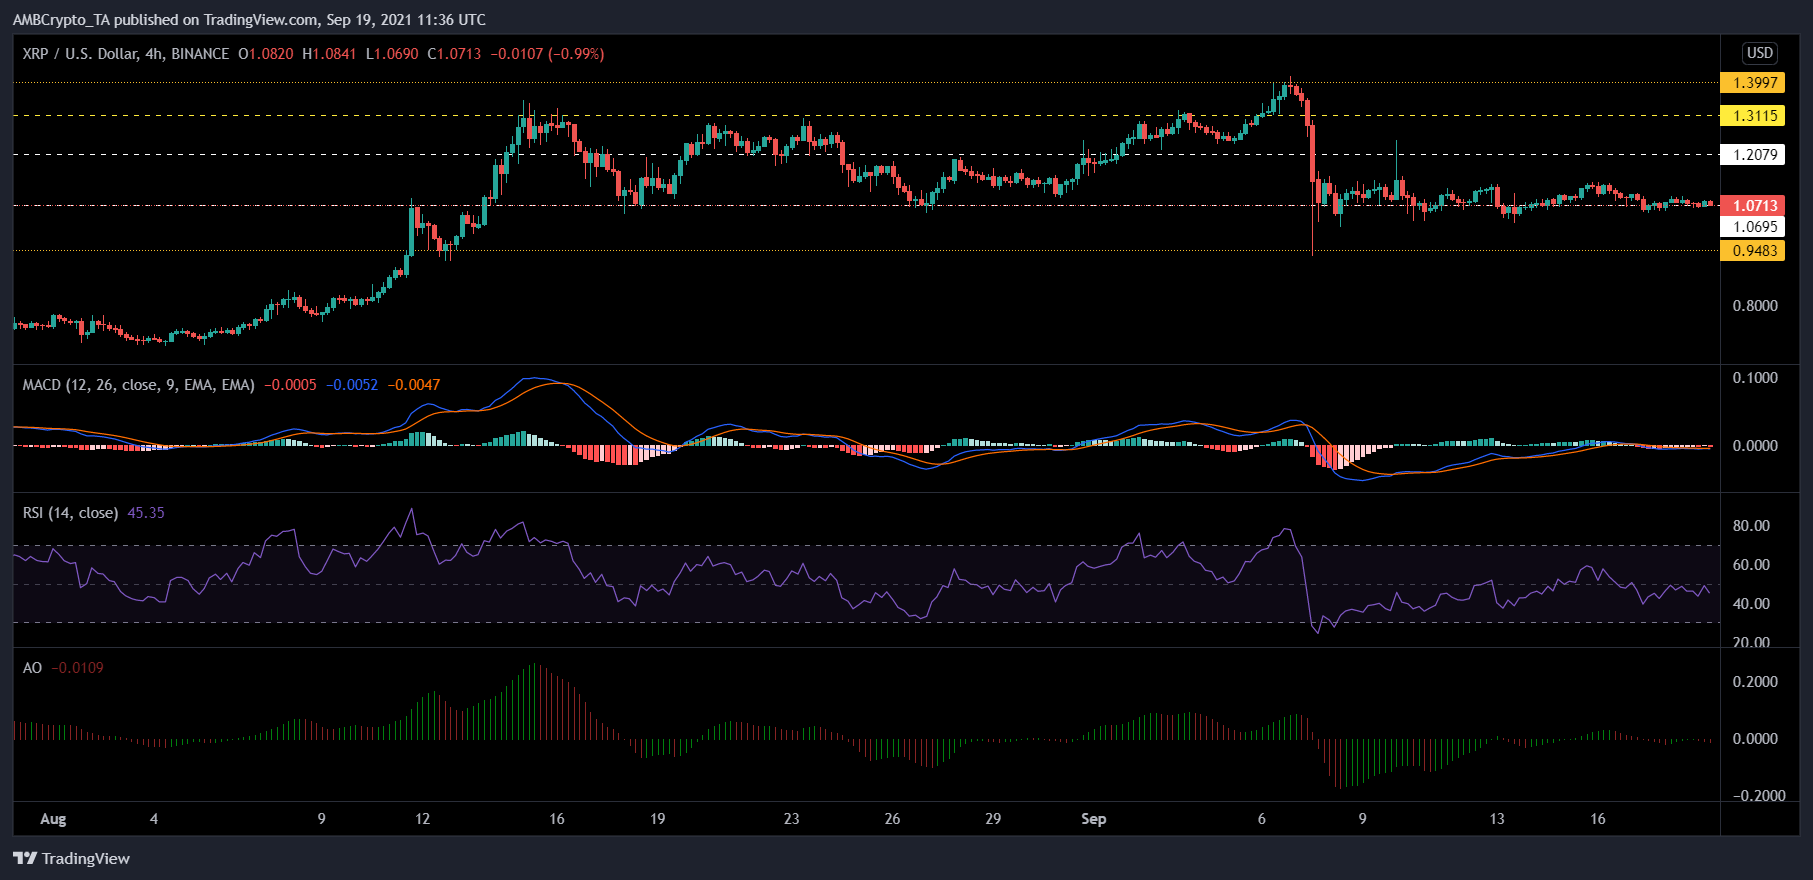
XRP/USD, TradingView
XRP’s prices declined by 0.9% over the last 24 hours. It was trading at $1.07 at press time. Nearest support level was at $0.94, which the altcoin last touched, over a month ago.
Technicals for XRP pointed towards bearish price action. MACD flashed small red bars on its histogram. Relative Strength Index was below the 50-mark, indicating the presence of selling pressure. Awesome Oscillator displayed red signal bars.
If XRP manages to break its consolidation on the upside, it could touch $1.20. Additional resistance levels stood at $1.31 and then at the coin’s multi-month high of $1.39.
Polkadot (DOT)
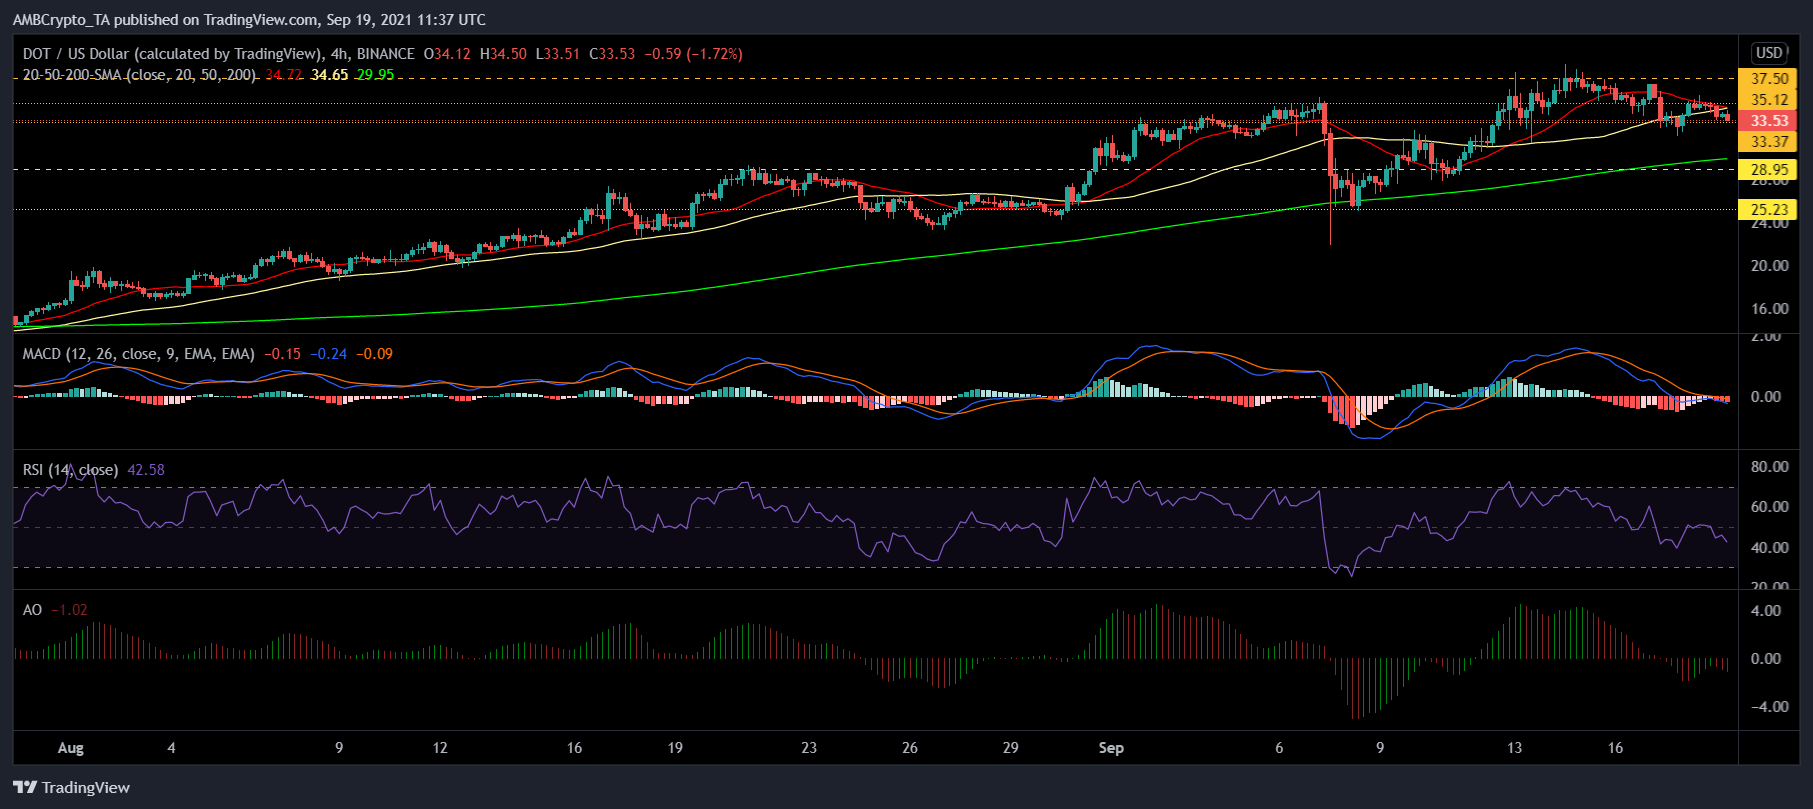
DOT/USD, TradingView
Polkadot was trading at $33.53 after it declined by 2.7% over the last 24 hours. The immediate price floor for DOT stood at $33.37. Other support lines rested at $28.95 and then at its one-week low of $25.23.
On the four-hour chart, the price of DOT was seen below the 20-SMA. This reading indicated that momentum was with the sellers. Relative Strength Index corresponded to the same, as it was below the half-line.
MACD continued to depict red bars on its histogram. The Awesome Oscillator also flashed red signal bars. On the flip-side, resistance levels stood at $35.12 and then at $37.50.
Terra (LUNA)
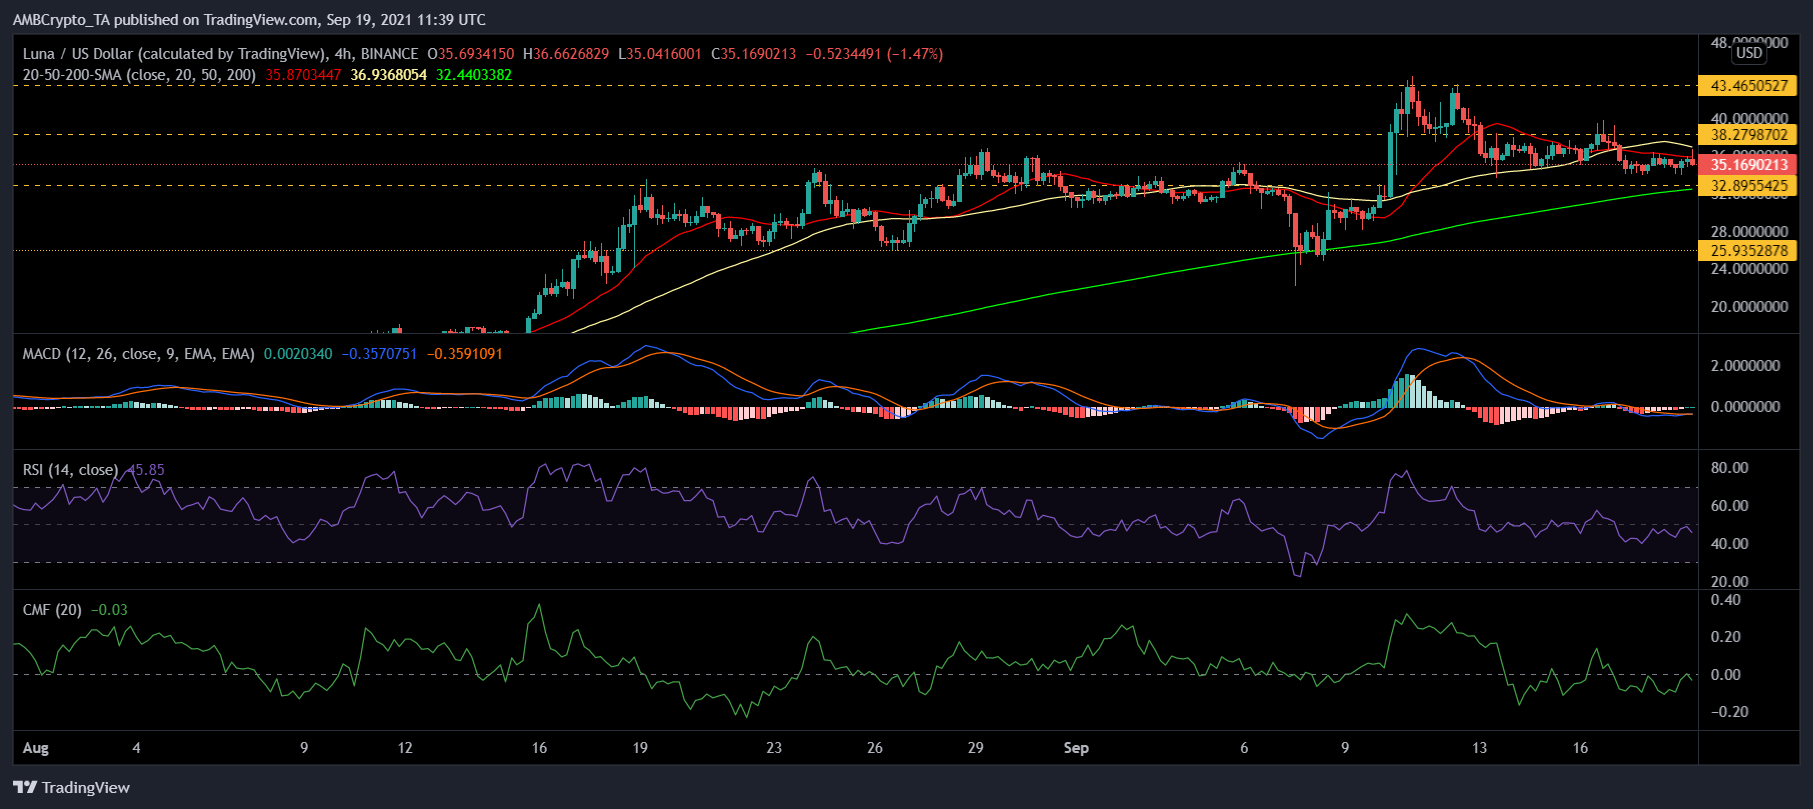
LUNA/USD, TradingView
Luna was seen consolidating and was priced at $35.16. The coin lost 0.2% of its valuation over the last 24 hours. Immediate support line of Luna was at $32.89 and then at the coin’s one-week low of $25.93.
On the four-hour chart, the price of Luna was below its 20-SMA line. This reading suggested that price momentum favoured the sellers. Relative Strength Index was below the half-line. Chaikin Money Flow was also seen below the midline as capital inflows remained low.
MACD however, displayed green bars on its histogram. If buying pressure increases, Luna could topple over the $38.27 price level and then revisit $43.46. Moreover, in recent news, Luna is expecting to launch its Columbus 5 upgrade on 30 September.