XRP, Shiba Inu, EOS Price Analysis: 9 December

While the broader market remained stable, several cryptos displayed promising recovery signs. XRP managed to cross the 38.2% Fibonacci level and noted a double-digit 24-hour gain.
Contrarily, EOS saw a pullback from the aforestated level as the bulls again strive to retest it. Shiba Inu, on the other hand, projected a slight bearish bias.
XRP
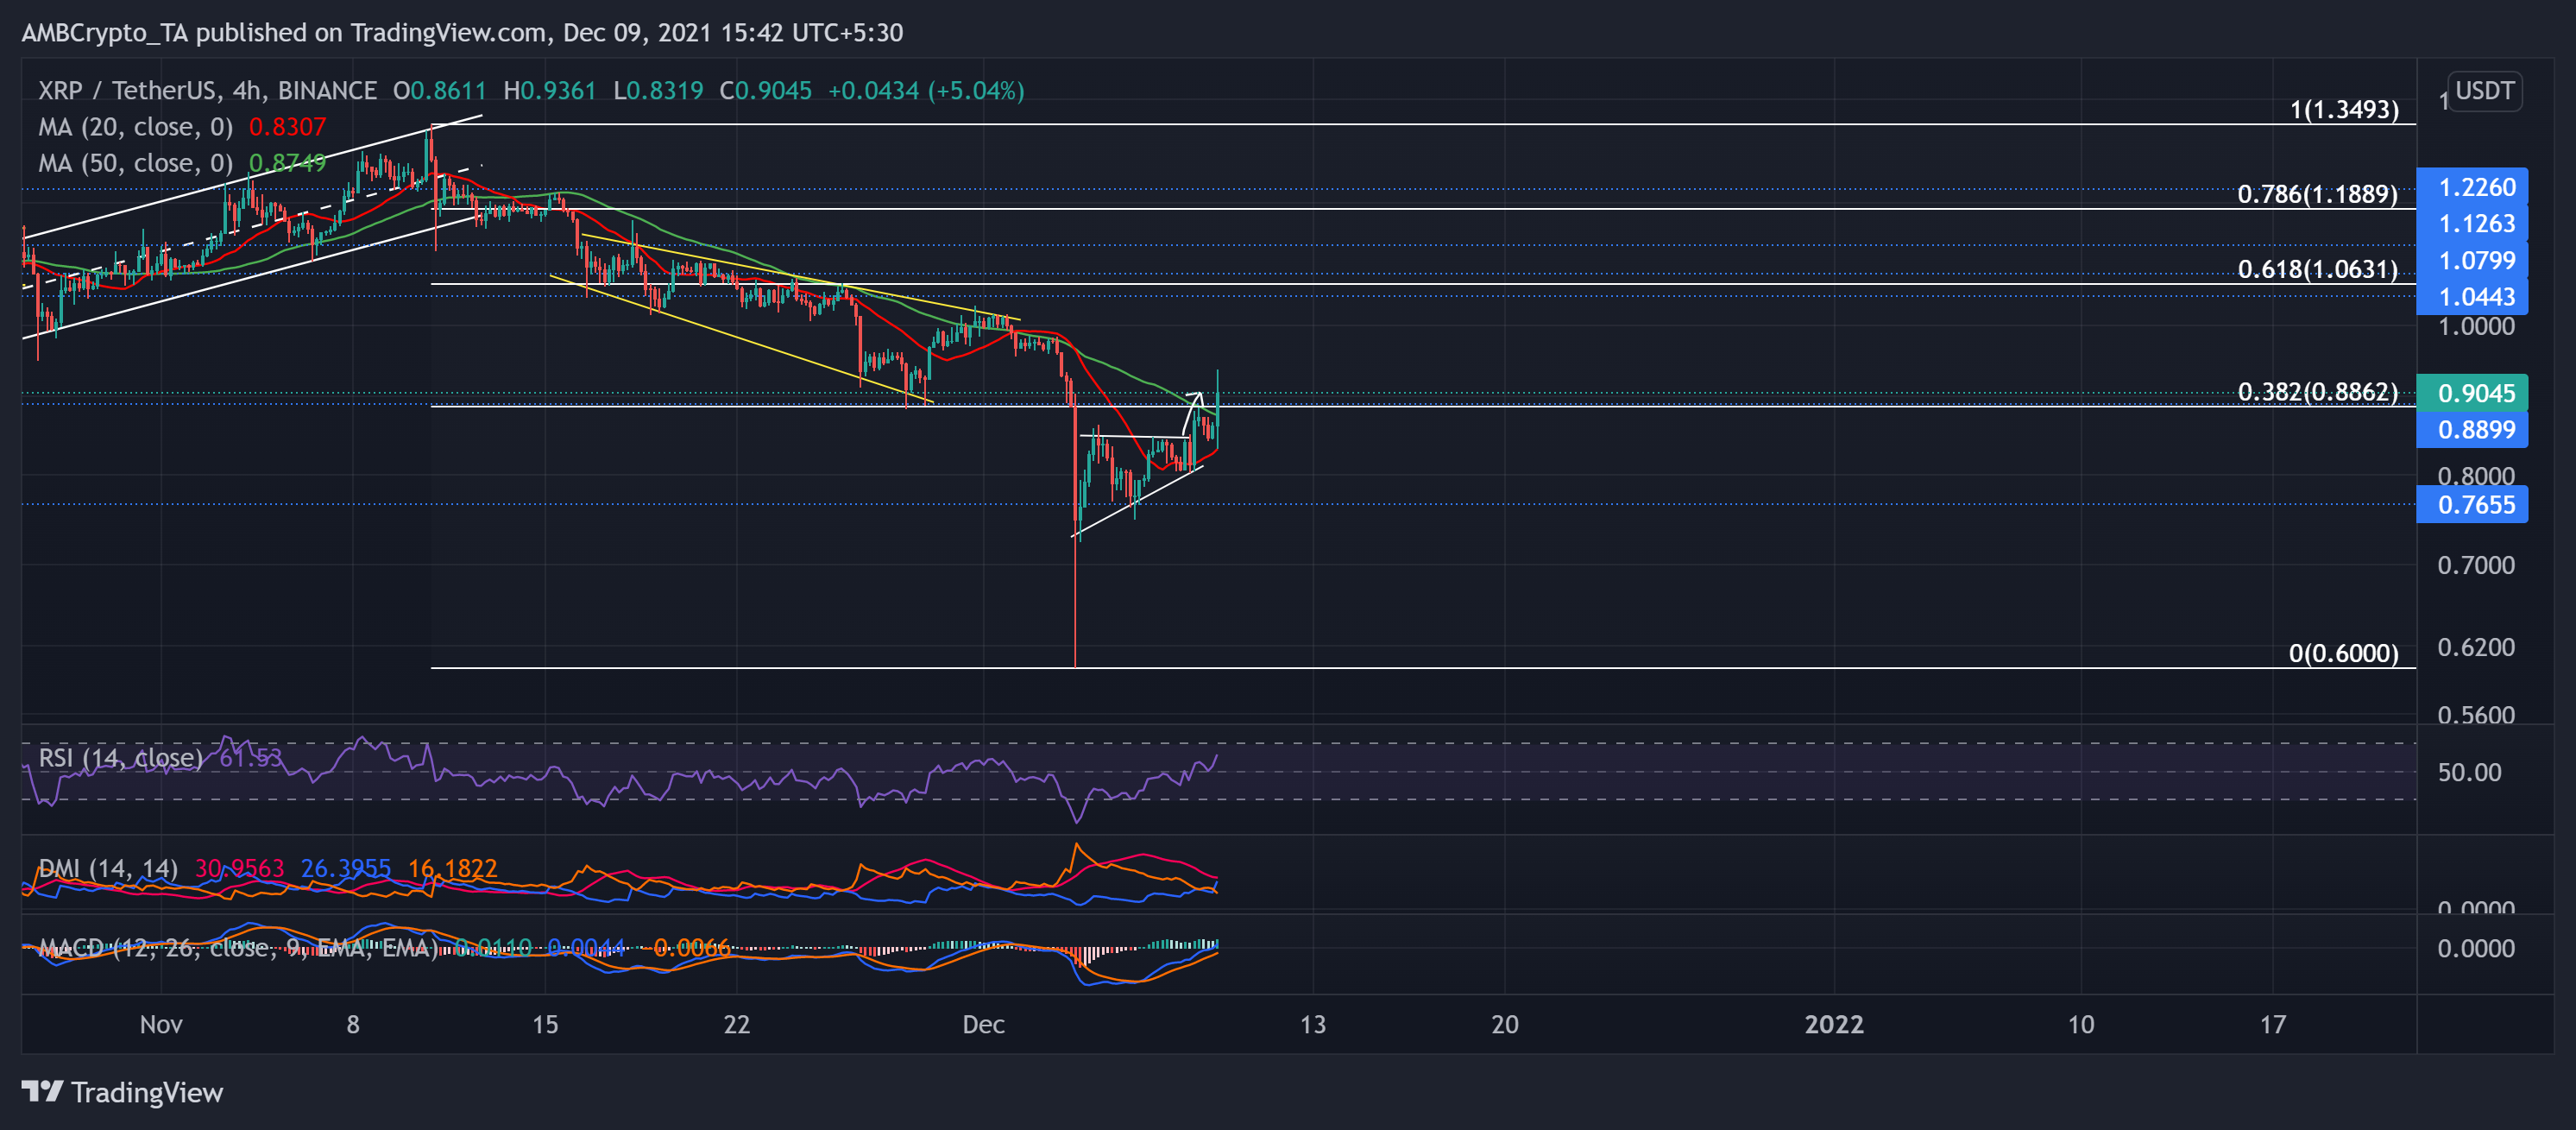
Post an ascending triangle breakout, Ripple’s XRP crossed the 38.2% Fibonacci hindrance after noting an 11.5% 24-hour gain. The alt diligently revived after poking its four-month low on 3 December. After hitting its monthly milestone on 10 November, the alt steadily took a back seat as the bears took over. A further breakout occurred below the 16-week long resistance at the $0.88-mark.
However, as the bulls ensured the $0.765-support, the alt traded at $0.9045 after an over 40% gain from the 3 December low. Thus, the price moved above its 20 (red) and 50(green) SMA.
The RSI managed to reach near the 60-mark after preferring the bulls. Also, the DMI and MACD depicted the increased bullish force. Now, if the bulls can sustain their rally, the immediate resistance stands at the golden Fibonacci level ($1.06-mark).
Shiba Inu (SHIB)
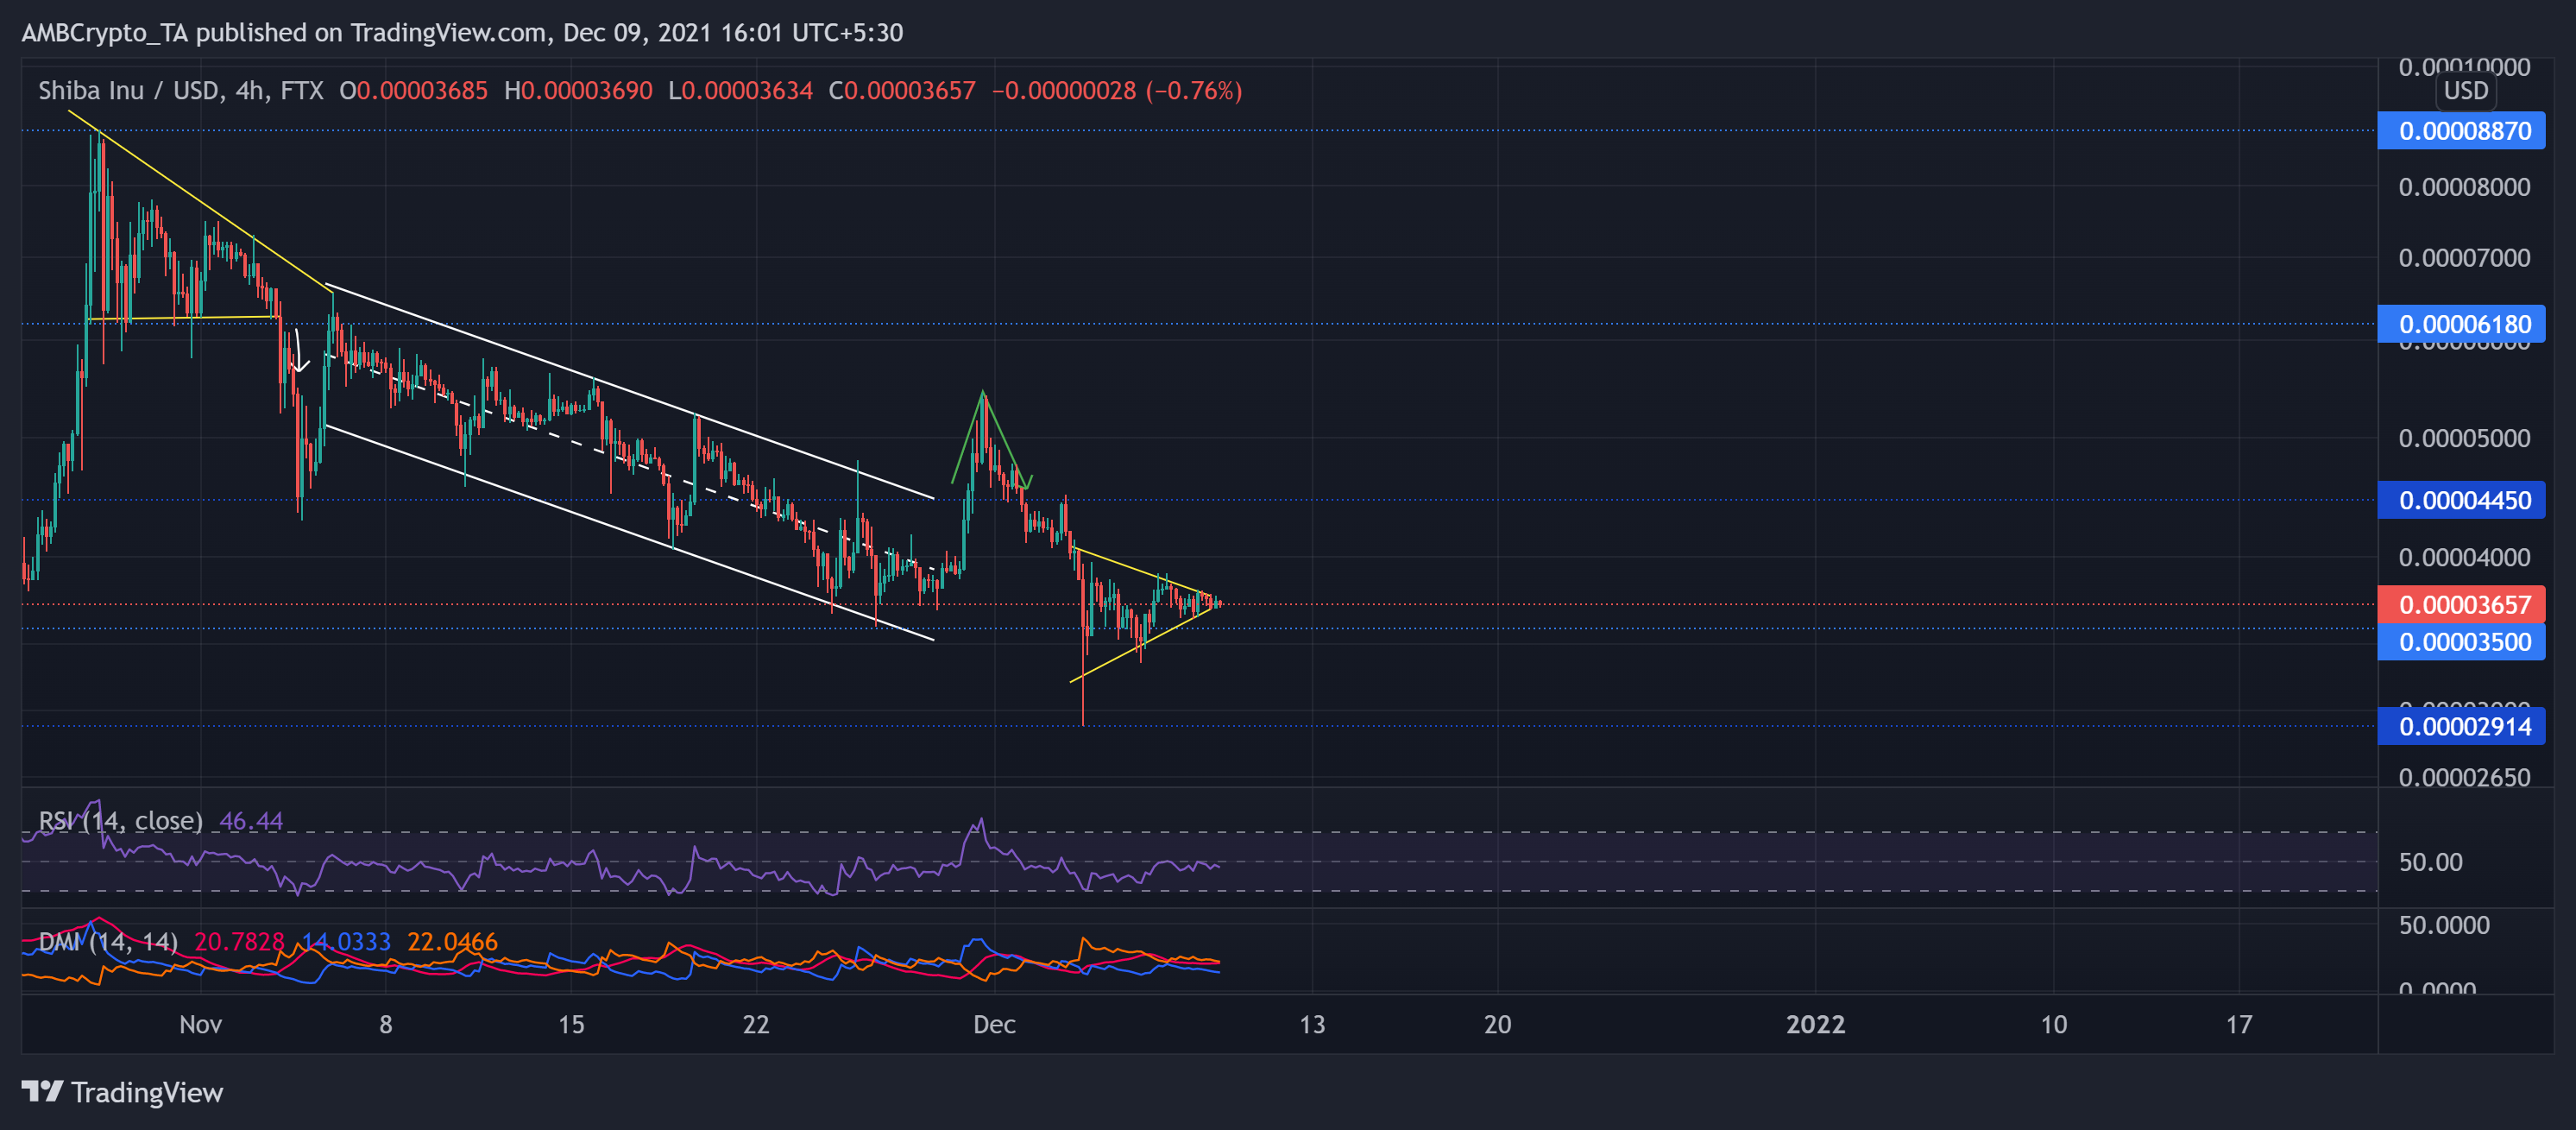
SHIB continued with its Symmetrical triangle post a V-top breakdown on the 4-hour timeframe. After attaining its lifetime milestone, the meme token steadily fell in a down-channel after a descending triangle breakdown. As s result, SHIB registered a 33.3% 30-day and 16.7% weekly decline in its value.
As the coin bounced back from its six-week low on 3 December, the bulls ensured the one-month support at $0.000035-mark. At press time, SHIB traded at $0.00003657.
Since 2 December, the RSI failed to cross the midline, depicting a powerful bearish influence. Also, the DMI preferred the sellers while the ADX displayed a weak trend.
EOS
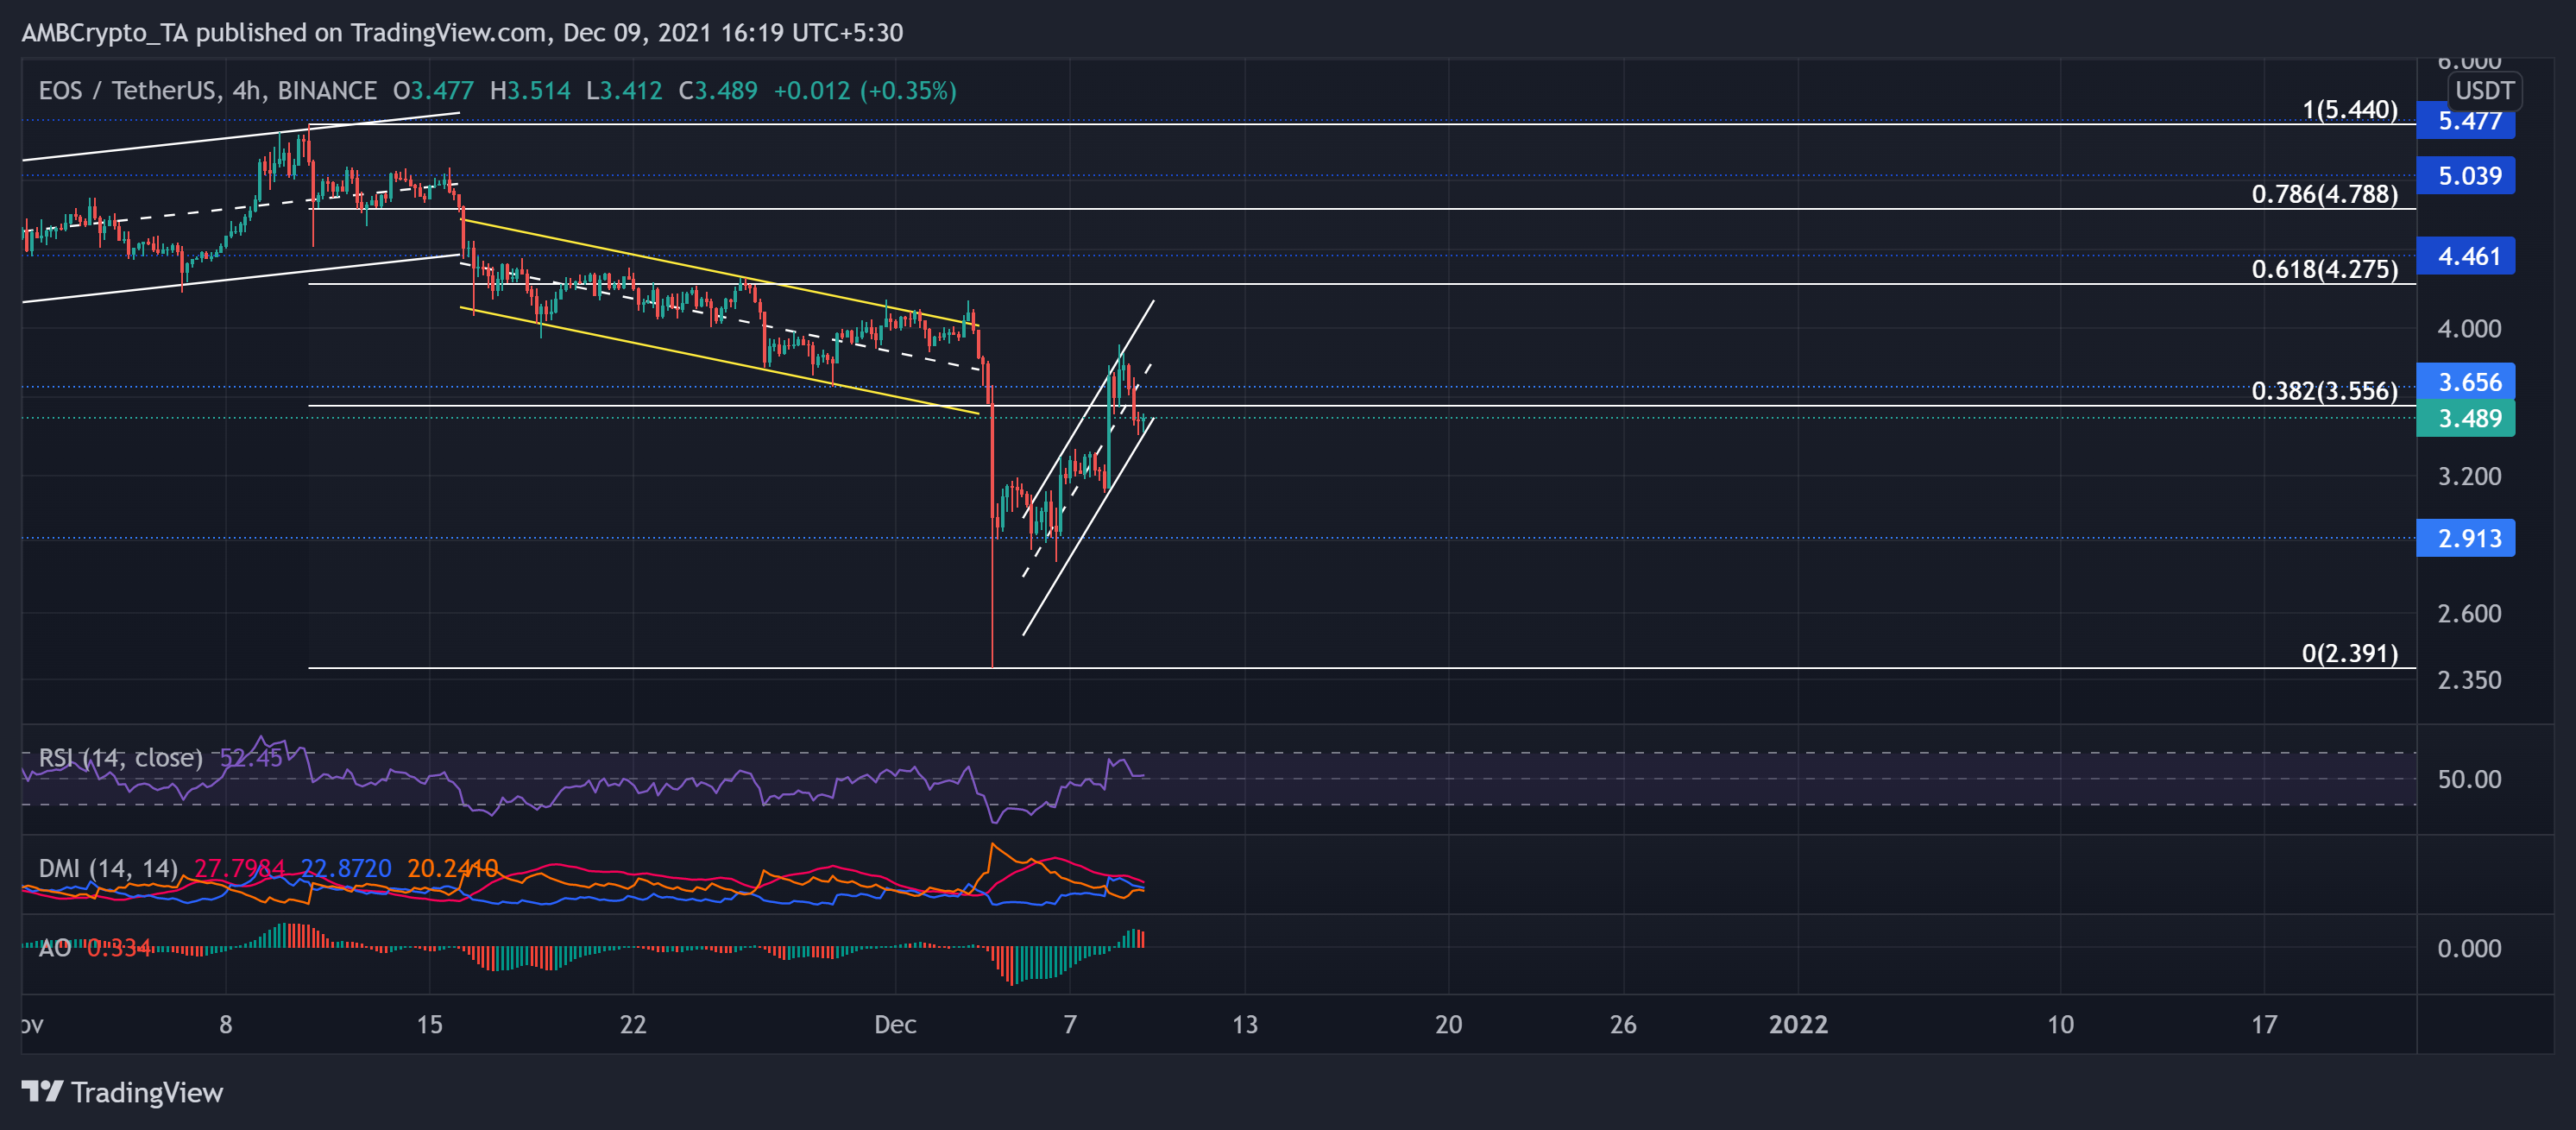
After breaching the 38.2% Fibonacci level, the altcoin saw a pullback below it after it noted a 5.82% 24-hour loss. Despite the fall, EOS formed an ascending channel after poking its 46-week low on 3 December.
Conversely, EOS poked its seven-week high on 10 November. As it obliged the 12-week-long resistance (at the $5.4 mark), it witnessed an up-channel breakdown and oscillated in a down-channel (yellow).
At press time, EOS traded at $3.46. Now, the bulls will again try to restest the 38.2% level before a possible upturn. The near-term technicals for the coin flashed mixed signals.
The RSI was just above the midline, indicating a slight bullish preference. Additionally, the DMI displayed an increasing bullish force. Nevertheless, the 24-hour pullback is reflected on the AO as it flashed red signs.