XRP, Solana, Tron Price Analysis: 4 December

While the global crypto market hits the $2.2 trillion mark, altcoins like XRP, Solana, and Tron noted over 15% losses in the past 24 hours.
Consequently, the bearish thrust led XRP and Tron’s price action to poke their four-month low on 3 December. Further, Solana touched its six-week low on the same day.
XRP
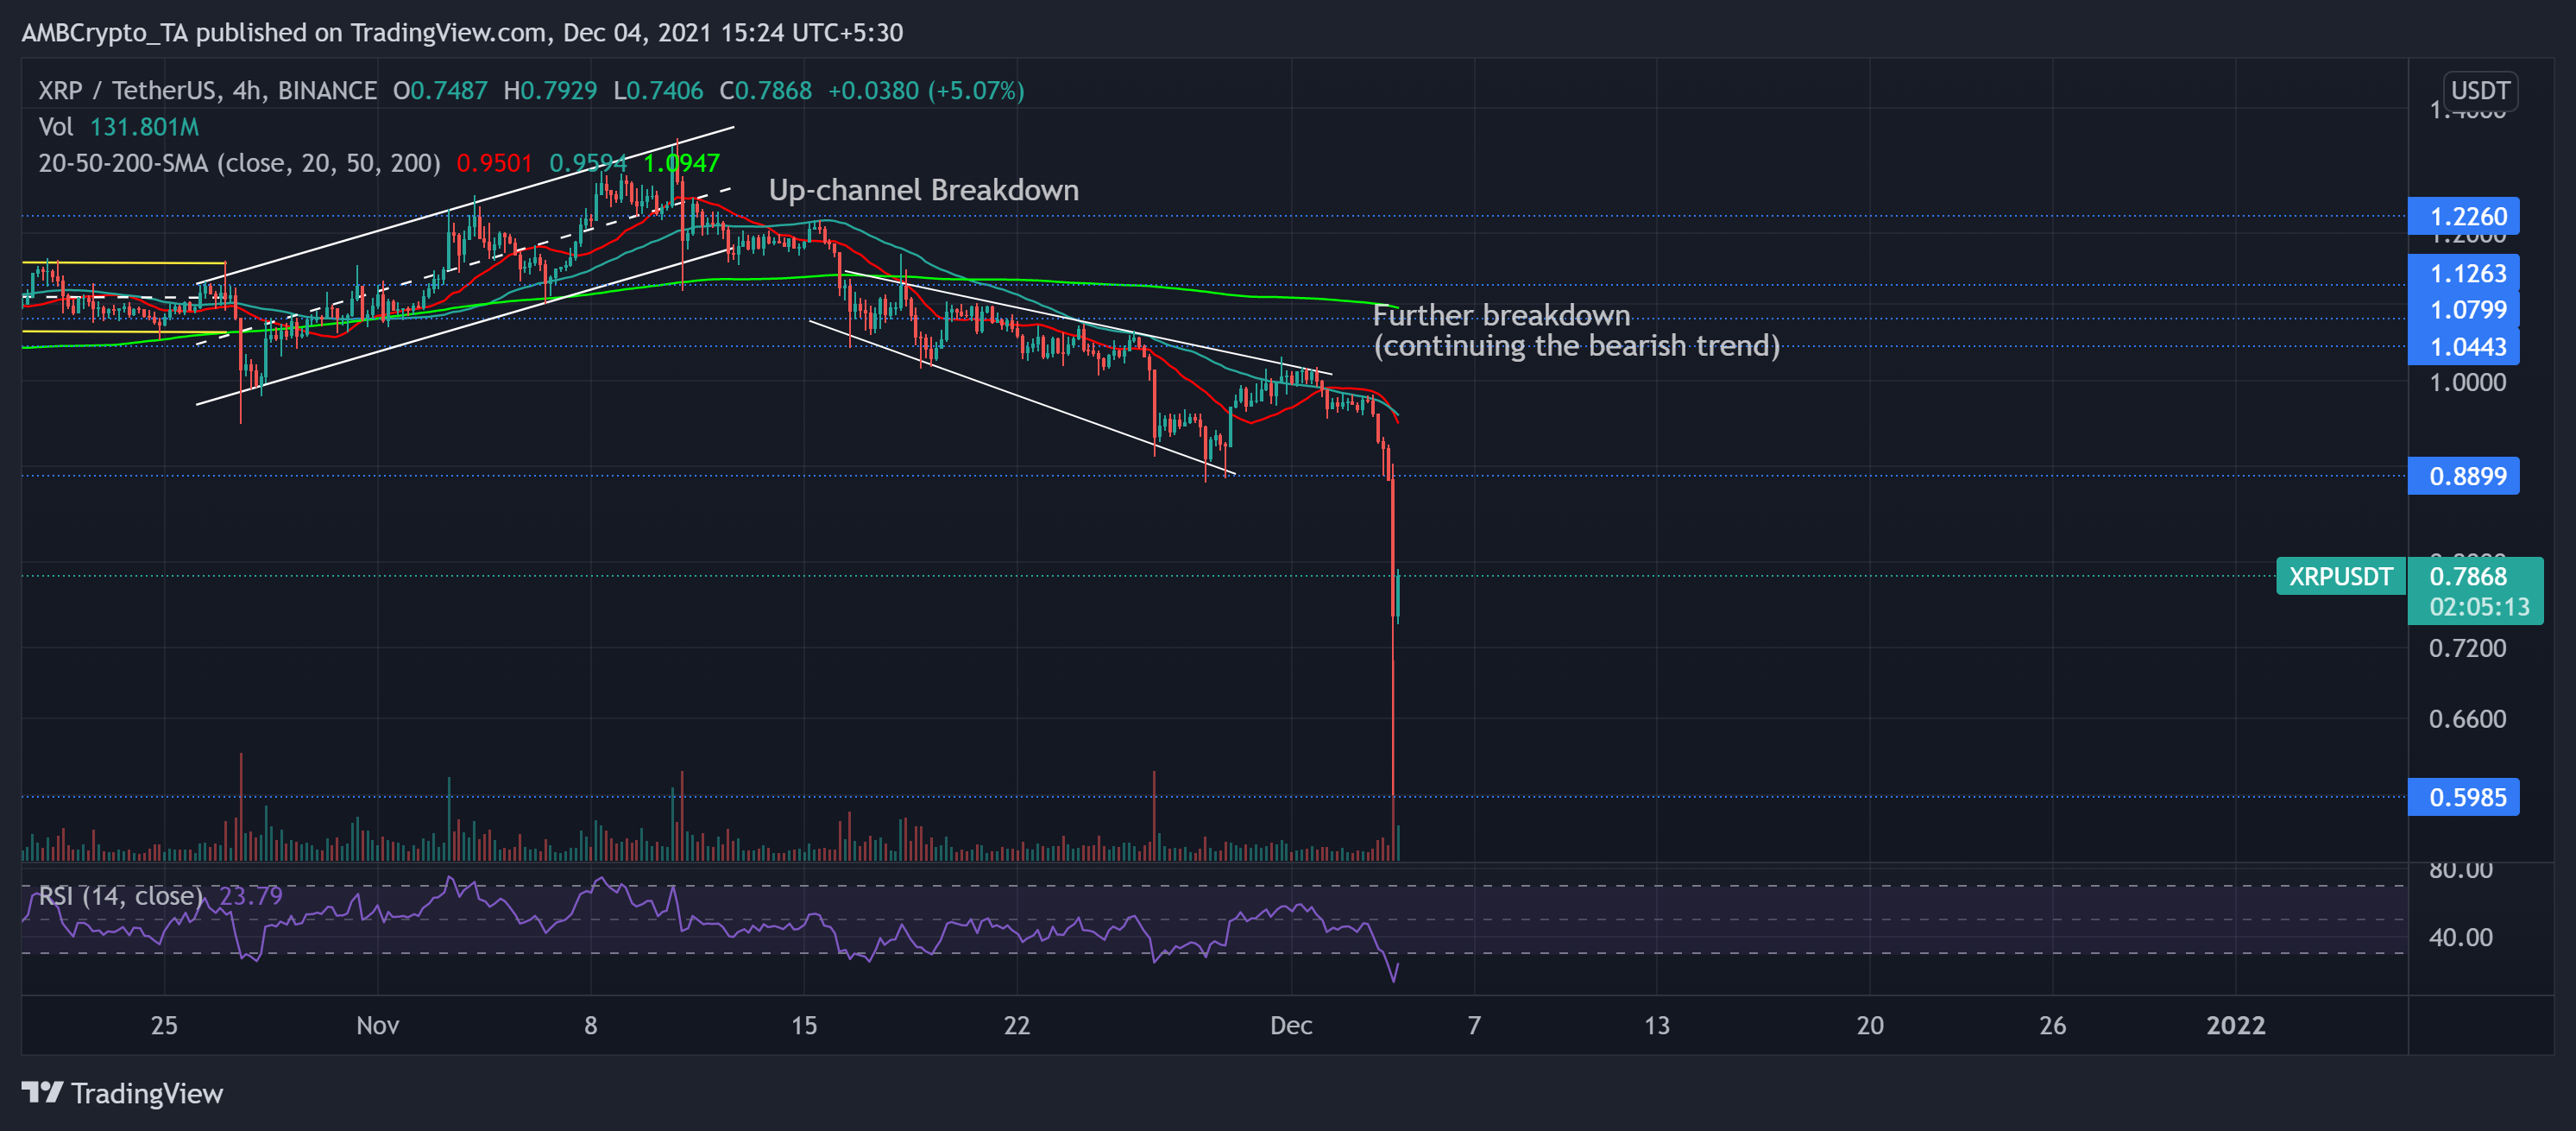
After striking its two-month high on 10 November, XRP correlated with the market trend by steadily declining since then. Post an up-channel breakdown, XRP price action marked a falling broadening wedge.
Since then, the bulls retested the upper trendline multiple times but failed to propel an upswing. As the bears induced a massive sell-off, a further breakdown occurred, resonating with the broader trend.
XRP lost over 19% of its value in the past day. Accordingly, it touched its four-month low on 3 December. As a result, the bulls failed to uphold the 16-week-long support at the $0.889-mark.
The alt traded much below its 4-hour 20-50-200 SMA at $0.786 at press time. The RSI practically struggled to cross the midline for the past three weeks. It stood deep into the oversold region, also hinting at good chances of a near-term trend reversal.
Solana (SOL)
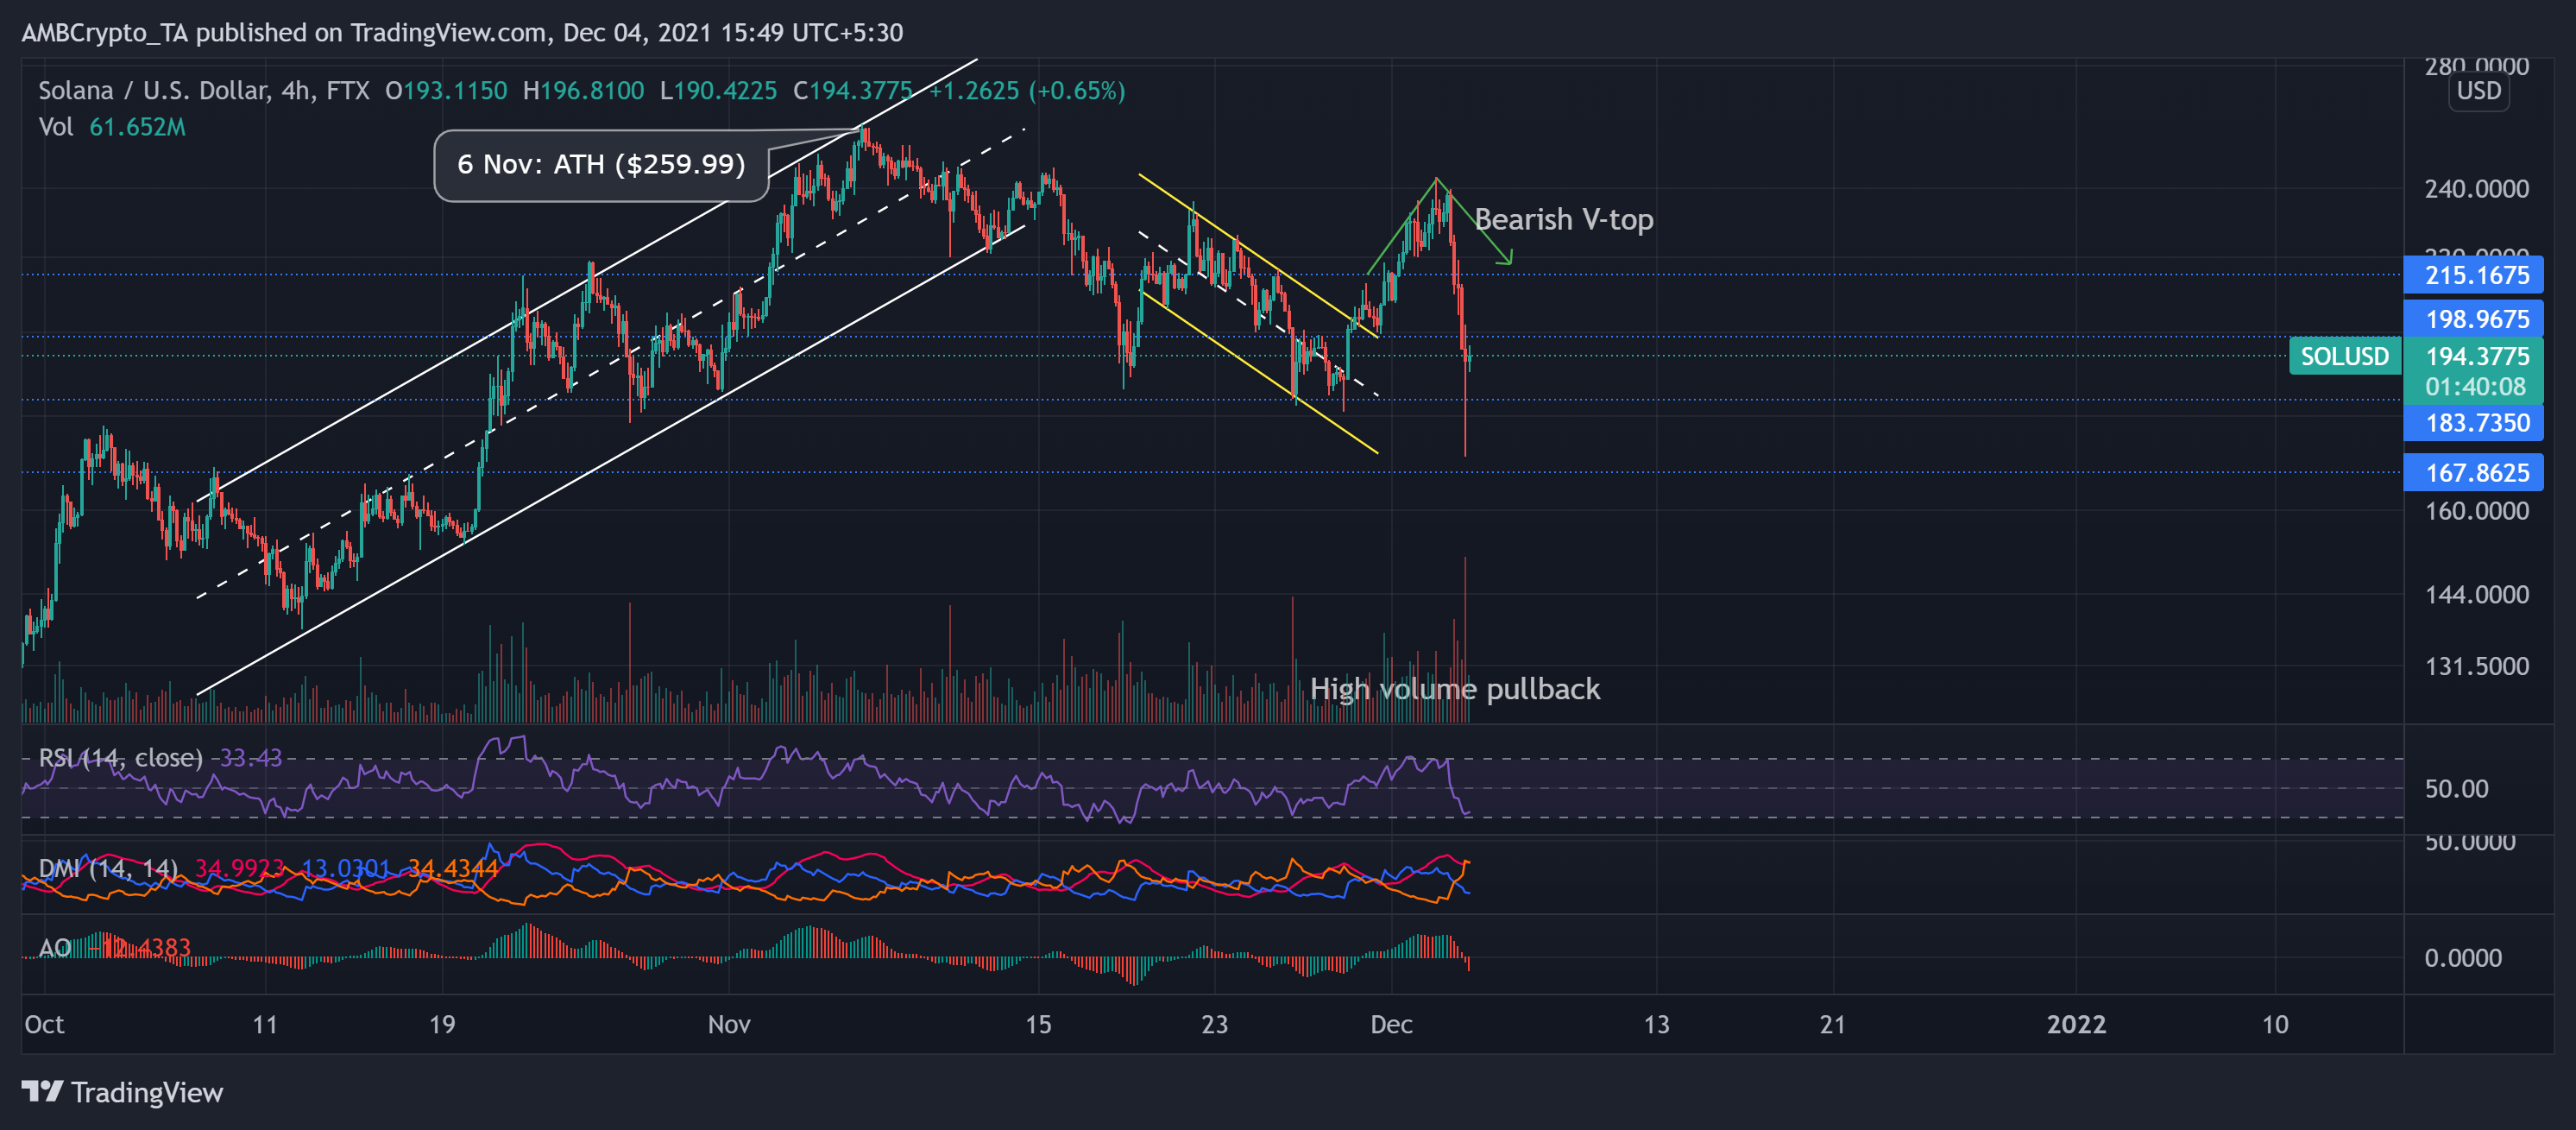
SOL saw soaring gains as it rallied by over 85% from 12 October to 6 November. With this upturn, the altcoin struck its ATH on 6 November.
Since then, however, the price steadily declined in a descending channel as bulls failed to counter the sell-off. During the downfall, SOL lost over one-fourth of its value until it touched its one-month low on 28 November.
After which, the bulls triggered a down-channel breakout but eventually failed to counter the monstrous sell-off as SOL noted an 18% 24-hour loss. The immediate pullback marked a bearish V-top, after which the price swiftly breached the six-week support at the $183-mark.
As a result, the RSI dipped from the overbought region to the oversold territory over the past day. However, it showed some near-term revival signs. Further, AO and DMI visibly depicted superior bearish strength.
Tron (TRX)
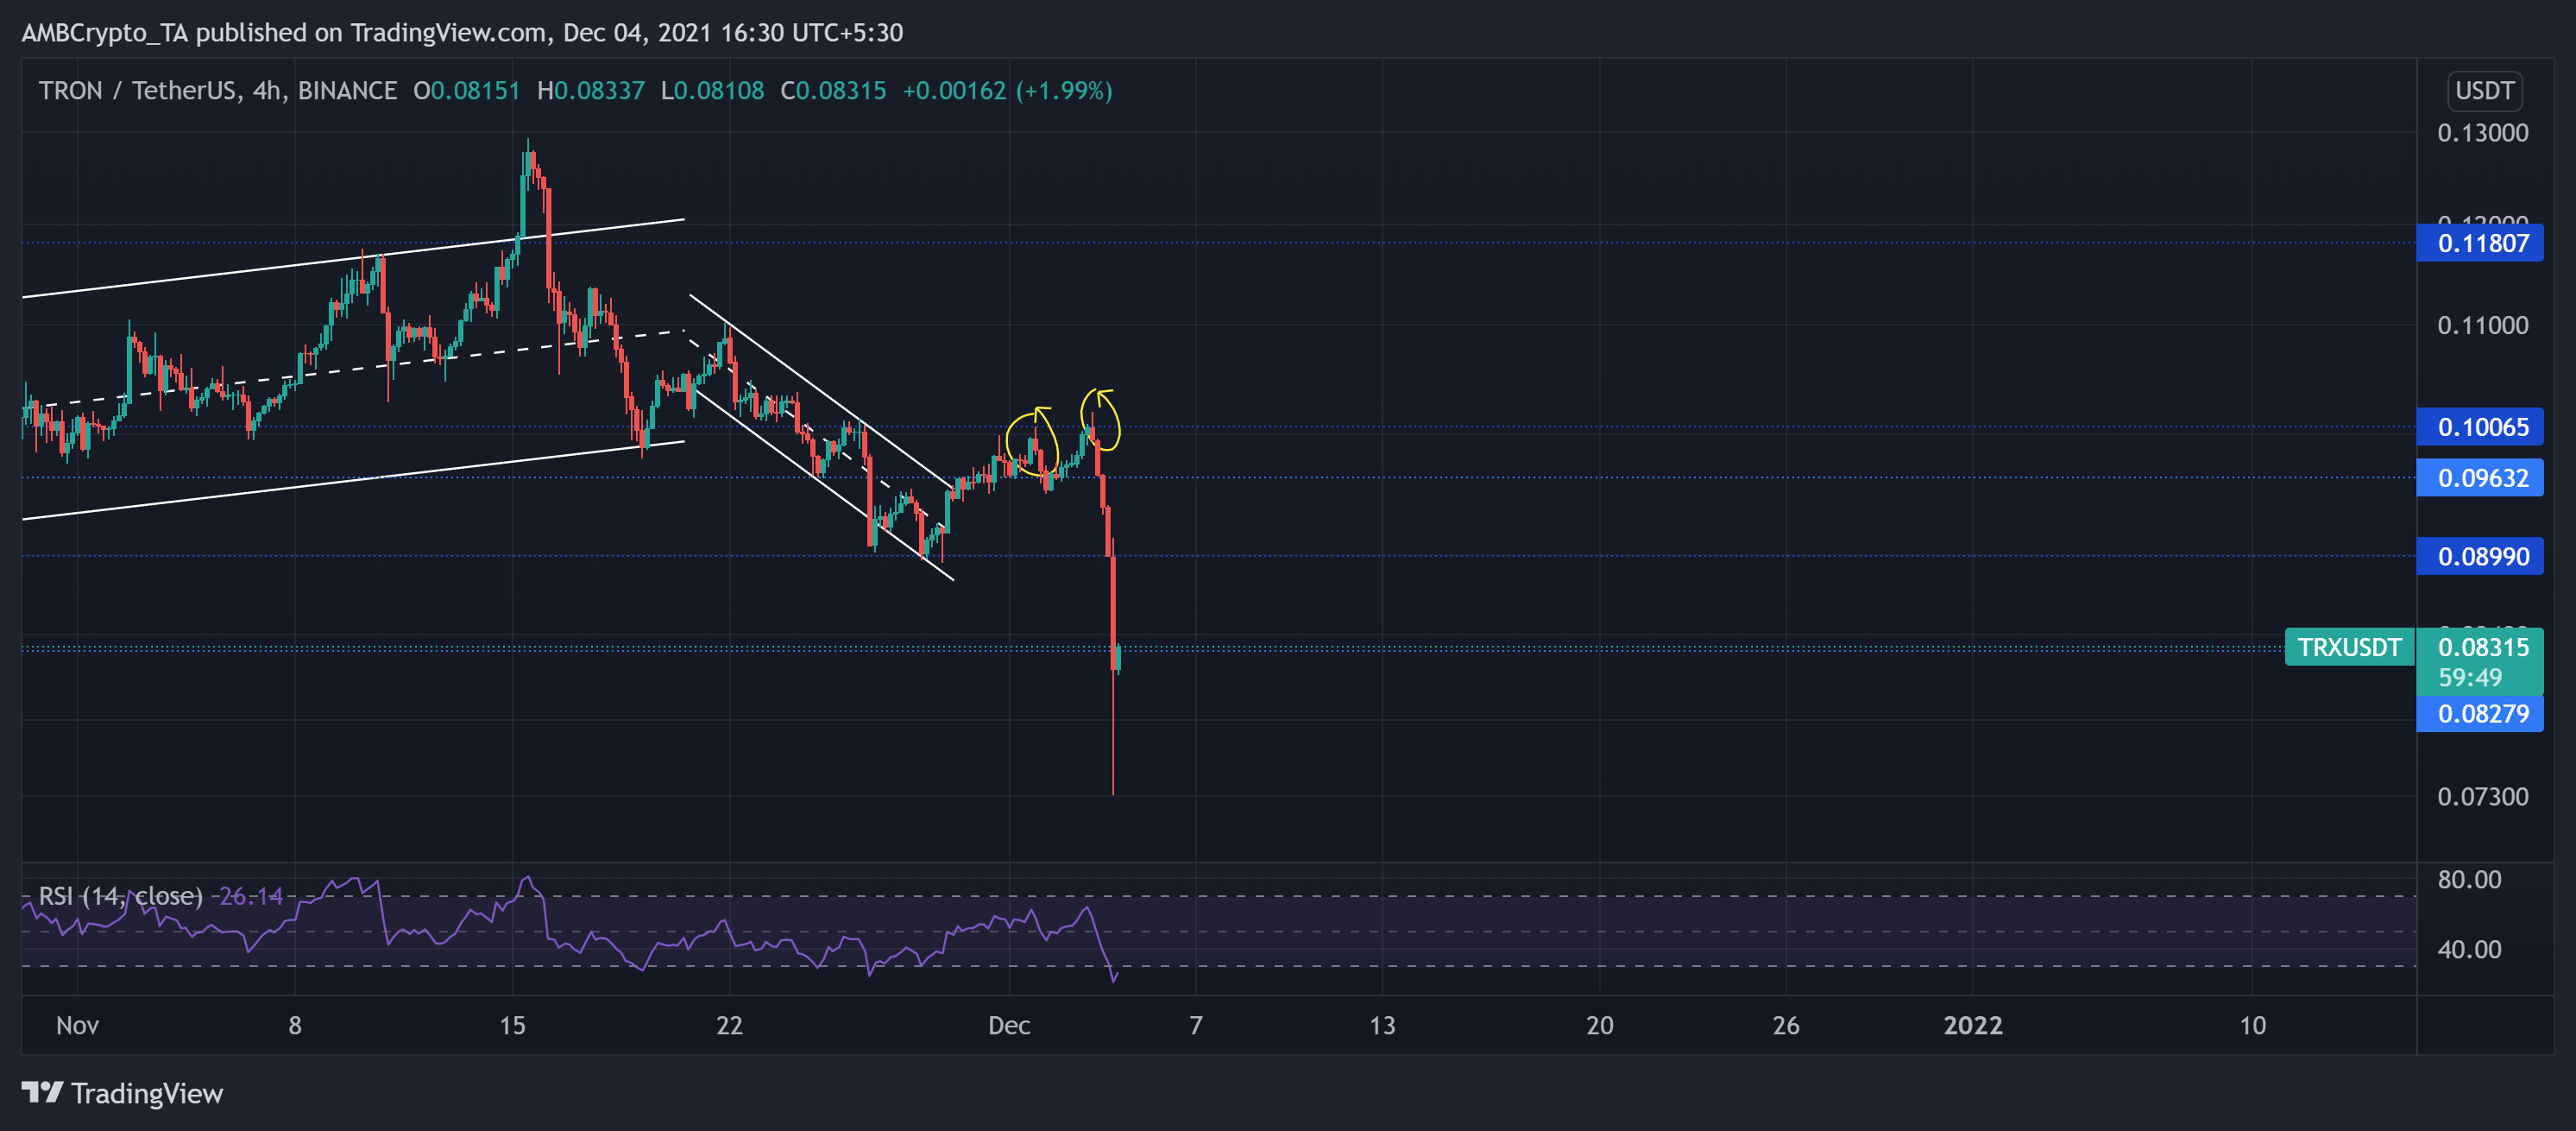
After attaining its six-month high milestone on 15 November, the alt steadily declined following an up-channel breakdown. Also, the bears have shown resistance at the $0.118-mark for the past six months. Consequently, TRX lost over a third of its value in the downfall and poked its one-month low on 28 November.
Then, as bulls attempted a comeback, a down-channel breakout occurred on 29 November. Afterwhich, they retested the $1.0065-mark twice over the past three days. But they failed to sustain their edge as the bears instigated a pullback and poked TRX’s 16-week low on 3 December.
At press time, TRX traded at $0.08315 after noting a 17.2% loss in 24 hours. The weak readings on the RSI depicted an oversold situation in the market. This reading also hinted at a possible near-term reversal as the price action observed a slight recovery.


