XRP, Solana, VeChain Price Analysis: 23 October

As the Bitcoin season eyed a prolonged time period, extending into November, altcoins like Solana and Vechain got off their ground to touch their 6-week high. However, XRP noted a 4.62% seven-day loss, continuing on a bearish note. Solana started to show signs of correction, and Vechain continued its spree of gains.
XRP
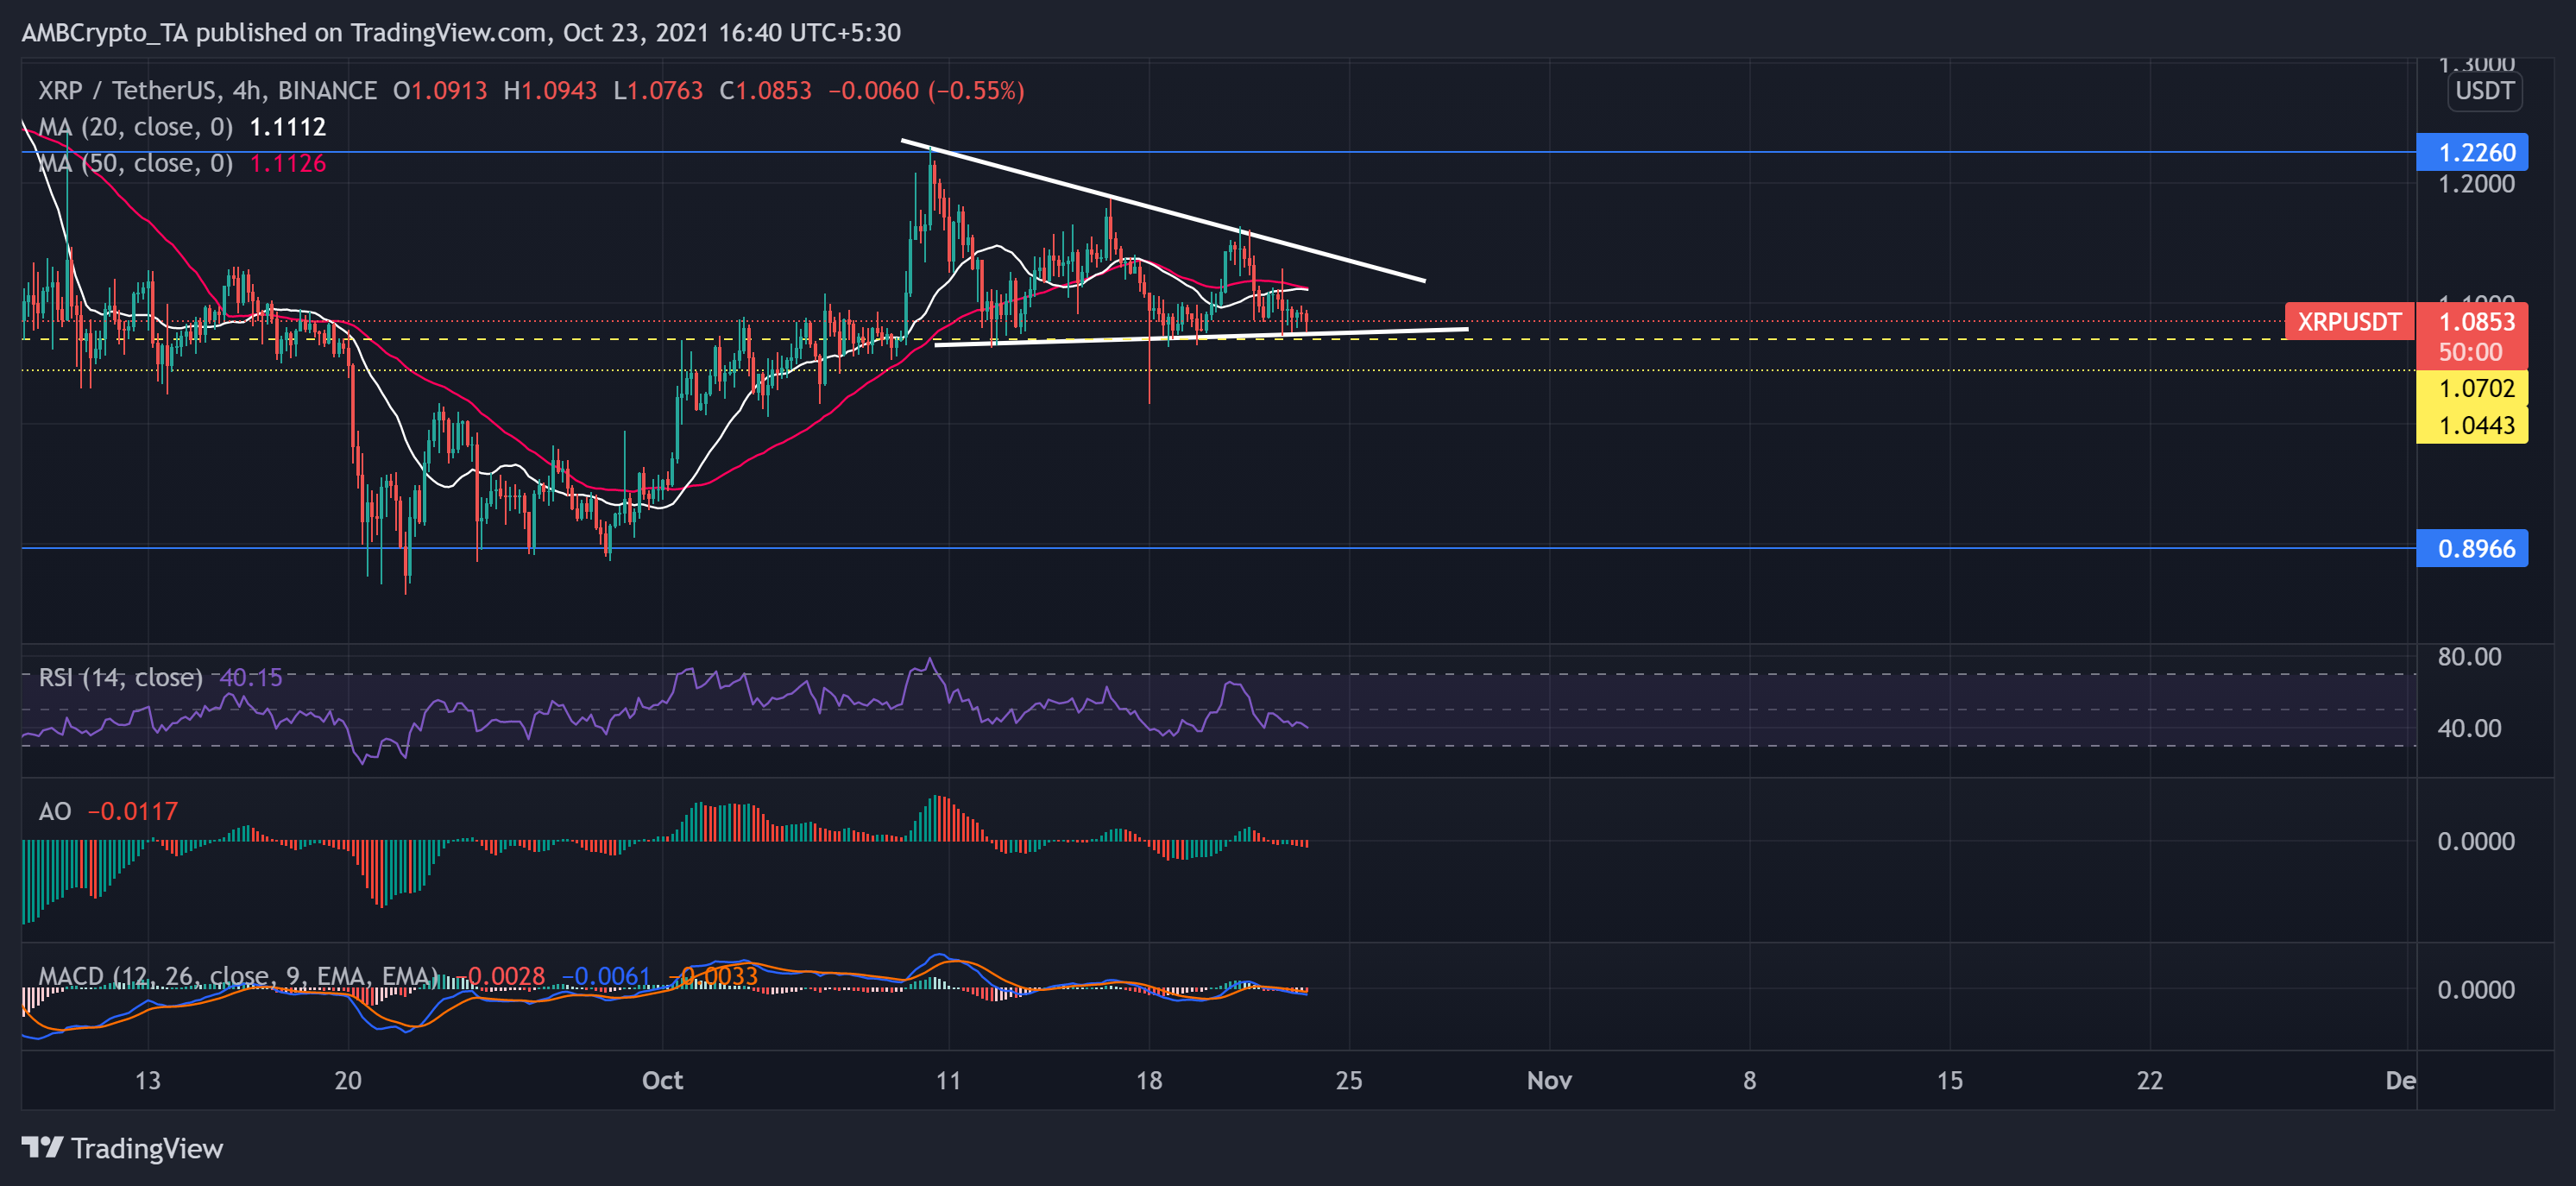
XRP witnessed a gradual decline in its value over the last week. The altcoin fell by nearly 1.92% over the past day. XRP oscillated within the triangular range starting from its resistance point at $1.2260 until the $1.07-mark, as displayed by the trendlines.
Key technicals hinted at bearish tendencies. With the current trading price below the 4-hour 20-SMA (white) and 50-SMA (red). With the continued selling pressure, the bears aimed to find new support at the $1.04-mark.
The Relative Strength Index remained well under the half-line. Unless the XRP bulls find a catalyst, the RSI was headed south. Also, the Awesome Oscillator and MACD histogram flashed red signal bars. Additionally, the MACD corresponded with previous readings and suggested a bearish trend as it headed downwards.
Solana (SOL)
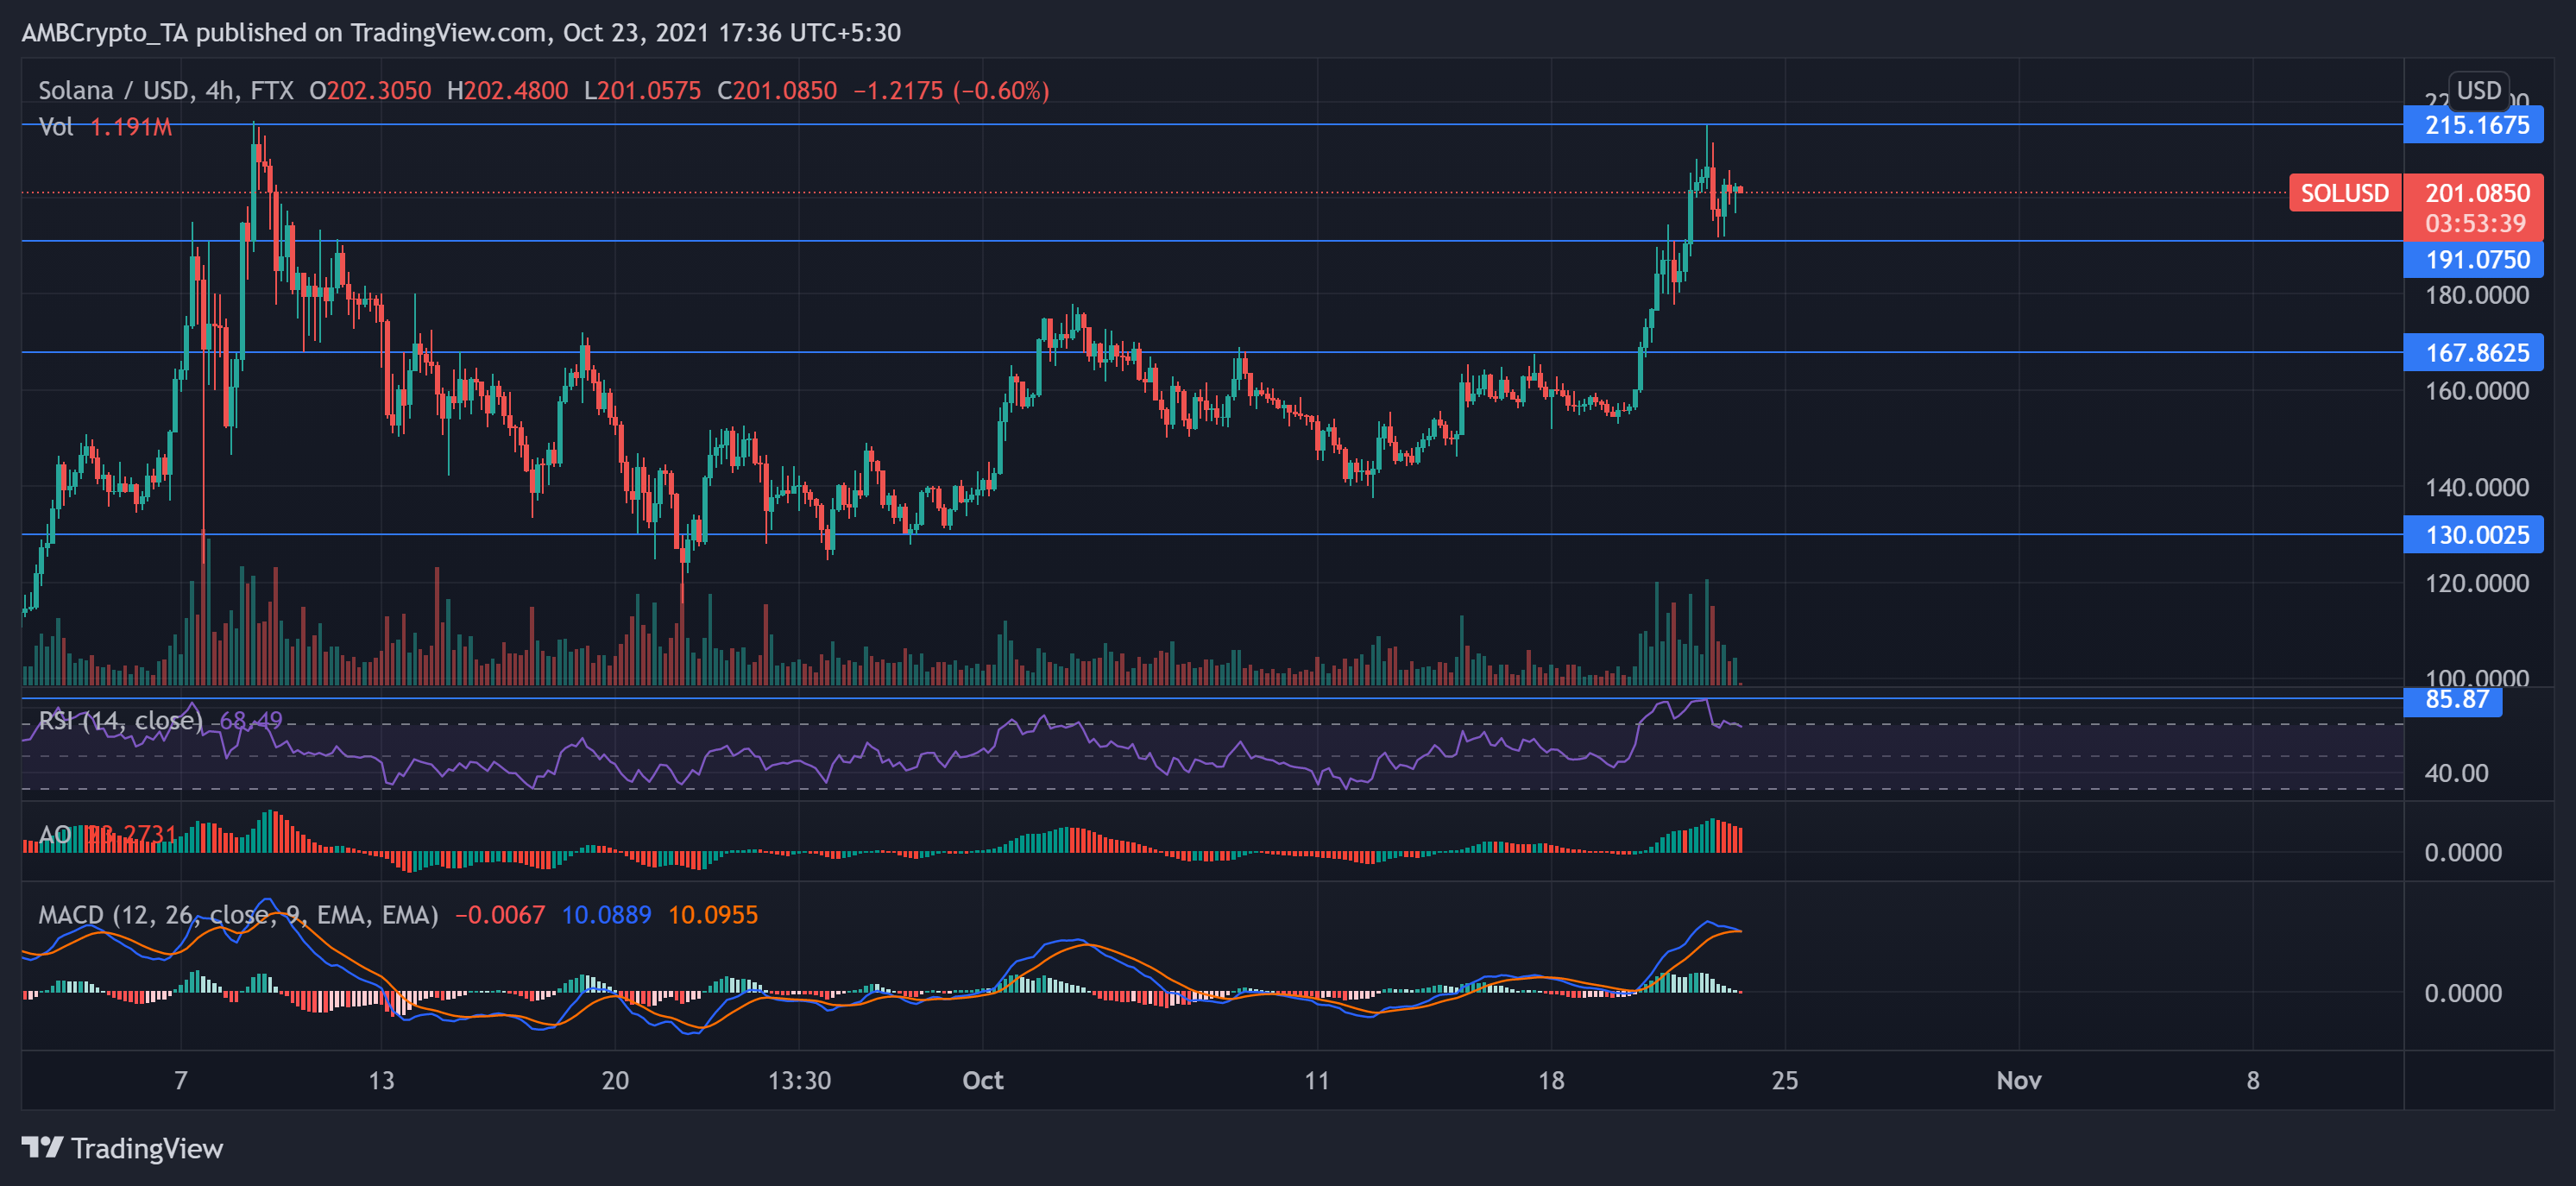
Solana undertook an interesting price trajectory by hitting its 6-week high at the $215-mark and then marked a retracement by falling nearly 2% over the last day near its immediate support at the $191-mark.
The digital currency traded at $201.08 and registered a 23.63% seven-day increase on its charts. The altcoin seemed in a pullback phase as key technicals seemed to head in a bearish direction. The Relative Strength Index reached the 85-mark, after which it plunged and stood near the overbought territory.
This plunge hints at a possible reversal in the near term. Furthermore, The Awesome Oscillator flashed red signal bars and headed south, approaching the zero line. Also, the MACD, after a bearish crossover, depicted a downward trend.
VeChain (VET)
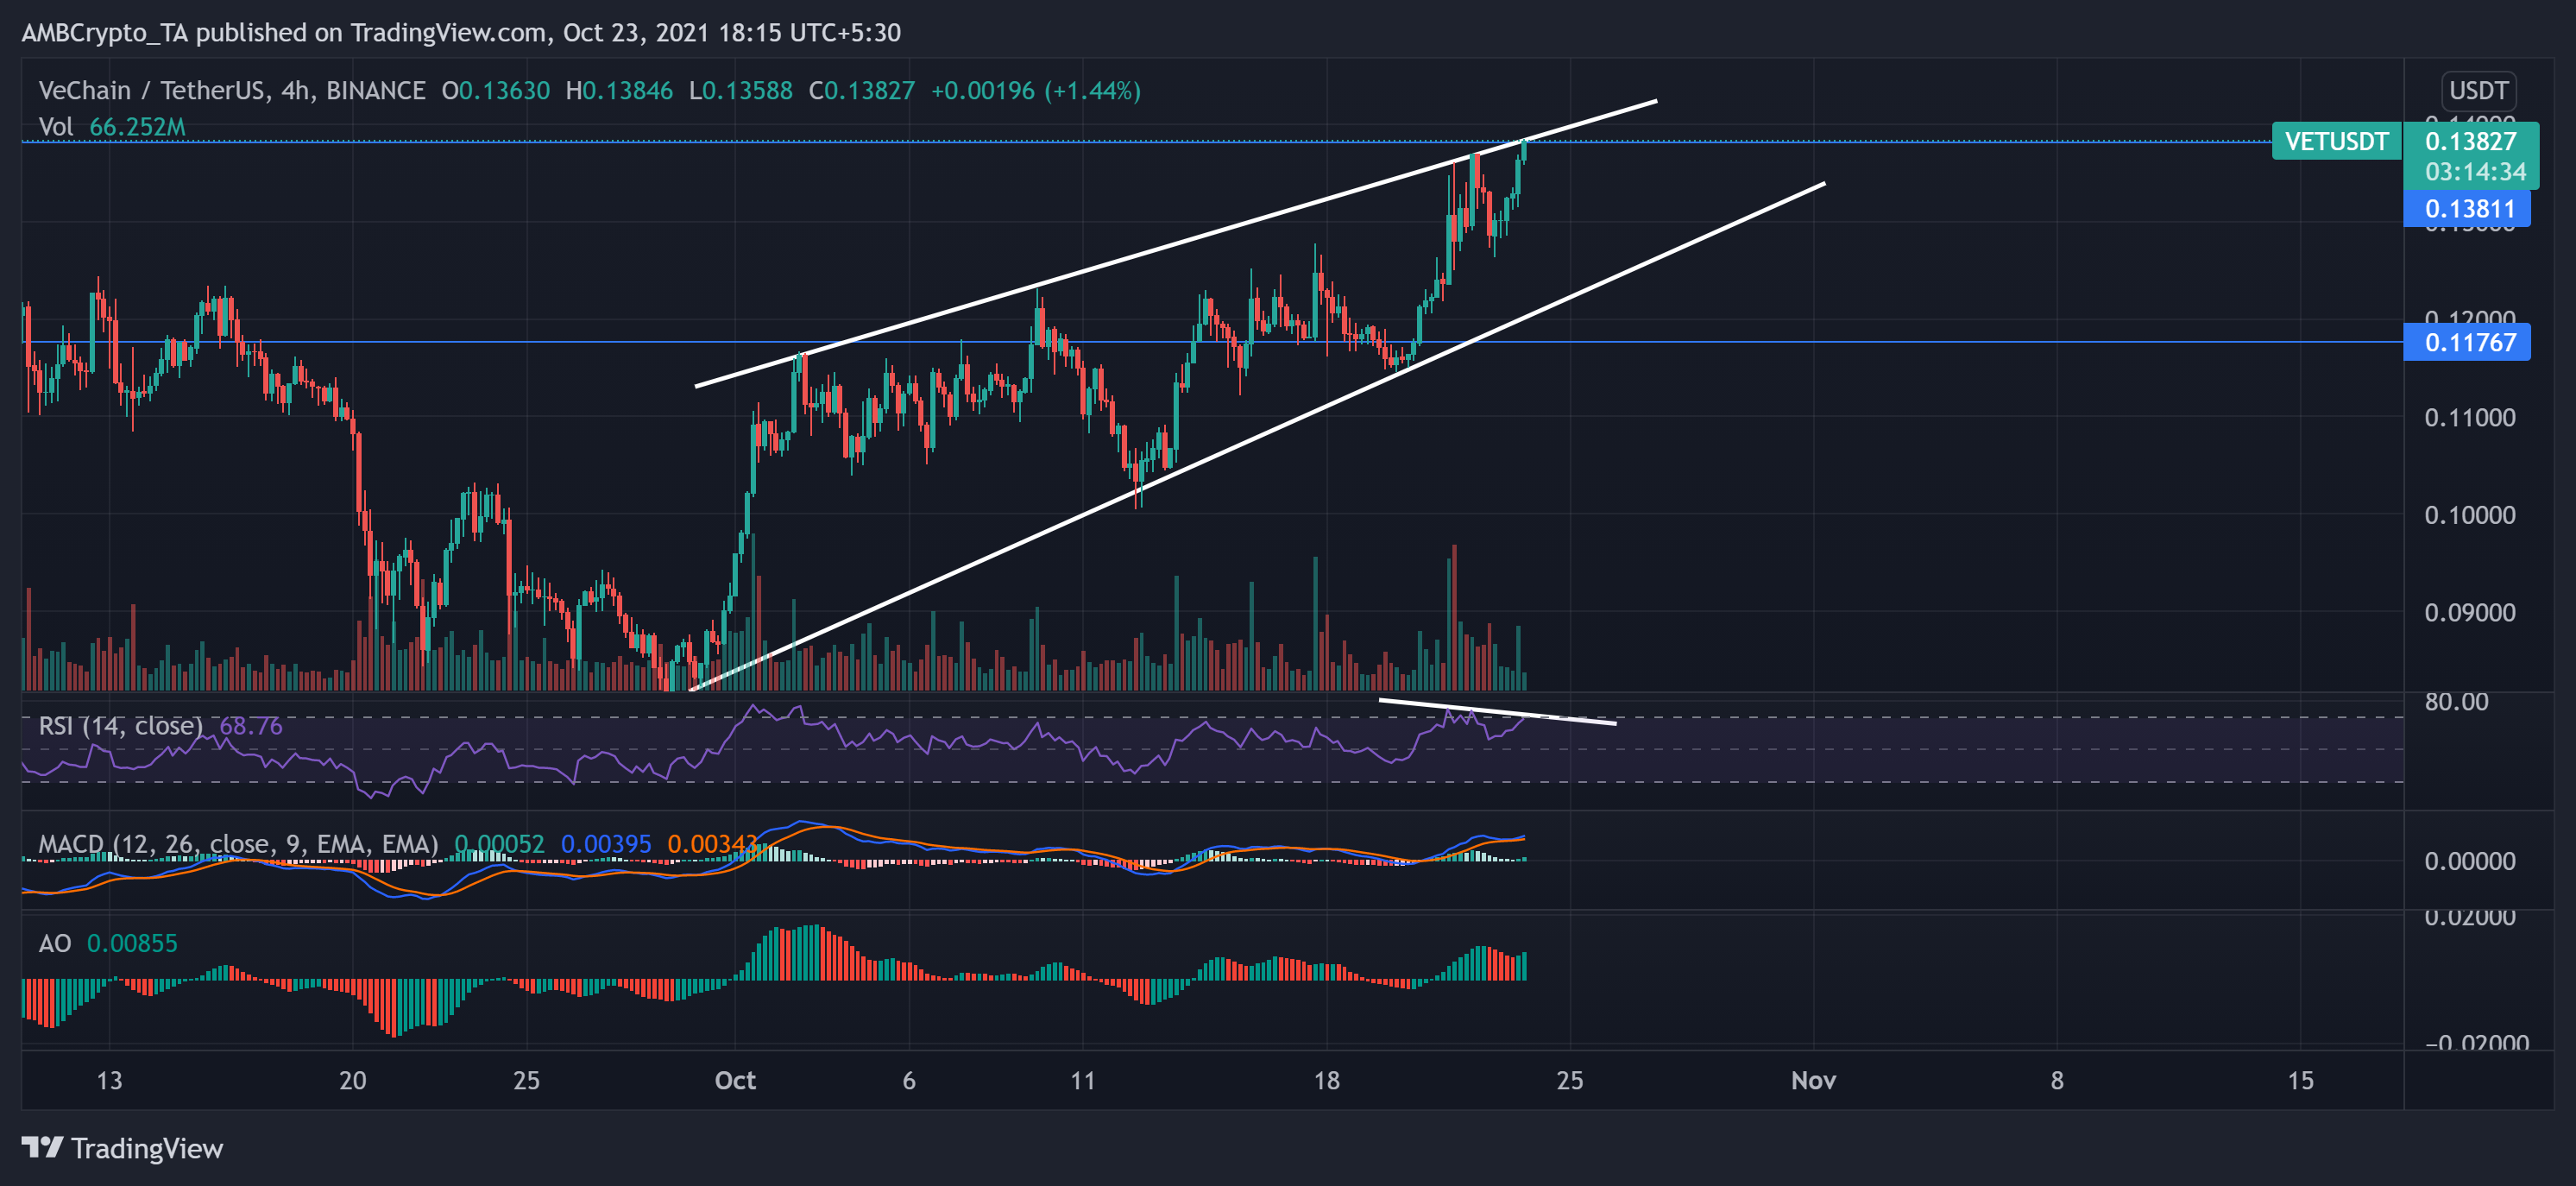
VET was on a bullish trajectory, noting 4.10% and 11.14% gains on its daily and weekly charts, respectively. As of press time, the digital currency traded at a notable 6-week high at $0.13827 at its resistance point.
The immediate support stood at $0.11767. Bullish trendlines and key technicals indicated an inclination for the bulls in the near term. The Relative Strength Index stood near the overbought mark, visibly indicating the superior bullish strength.
Besides, MACD and the Awesome Oscillator both flashed green signal bars, favoring the bulls. However, the RSI trendline and a significant decrease in trading volumes possibly point towards a near-term reversal.


