XRP, Terra, Dogecoin Price Analysis: 26 December

While the market seemingly hopped onto the recovery bandwagon, XRP’s 20 SMA crossed its 50-200 SMA forming a golden cross. Now its technicals flashed mixed near-term signs.
Dogecoin blipped but continued its recovery with increasing buying pressure. Terra, however, noted exponential gains and struck its ATH on 24 December.
XRP
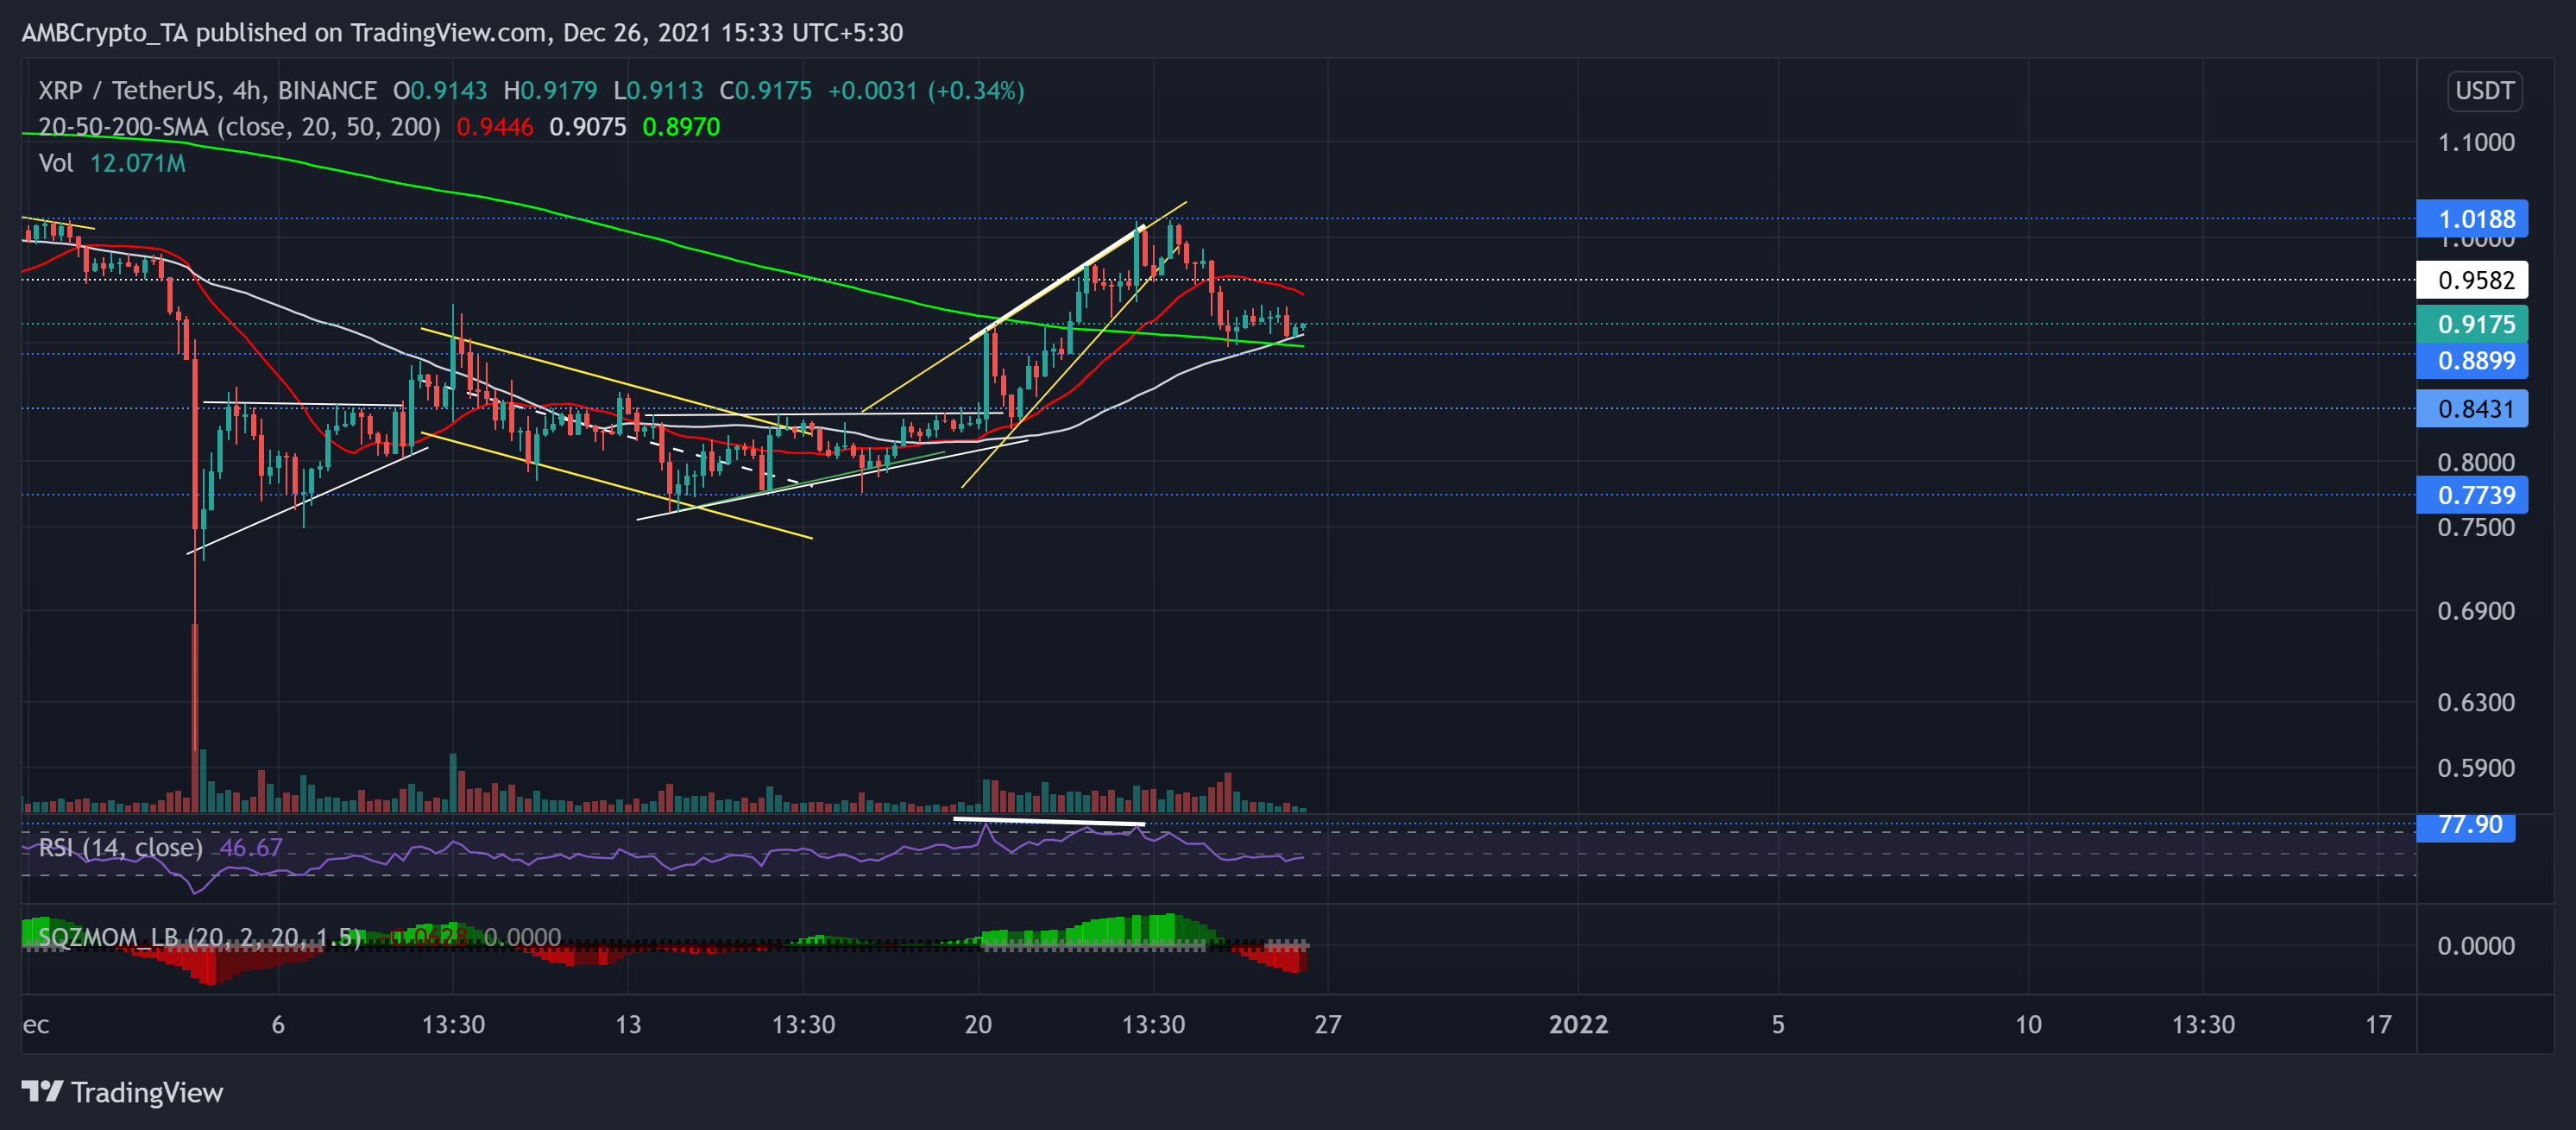
As we saw in the previous analysis, XRP continued to oscillate in a rising wedge (green, reversal pattern) after the ascending triangle (white) breakout. The alt saw a 21.3% ROI during this phase as it poked its three-week high on 23 December.
Meanwhile, the 20-SMA (red) crossed the 50-SMA (grey) and the 200-SMA (green), depicting a strong trend reversal for bulls. However, with a bearish divergence (white trendline) and strong resistance at the $1.01-level, the price action saw a breakdown toward the $0.88-mark.
Now, the 50-SMA stood as immediate testing support as the price action bounced back from it.
At press time, XRP was trading at $0.9175. The RSI swayed near the 46-mark after a sharp plunge but did not lose its power. The pullback volumes (red) seemed higher than the recovery volumes recently. The Squeeze Momentum Indicator flashed grey gots and hinted at a high volatility phase.
Terra (LUNA)
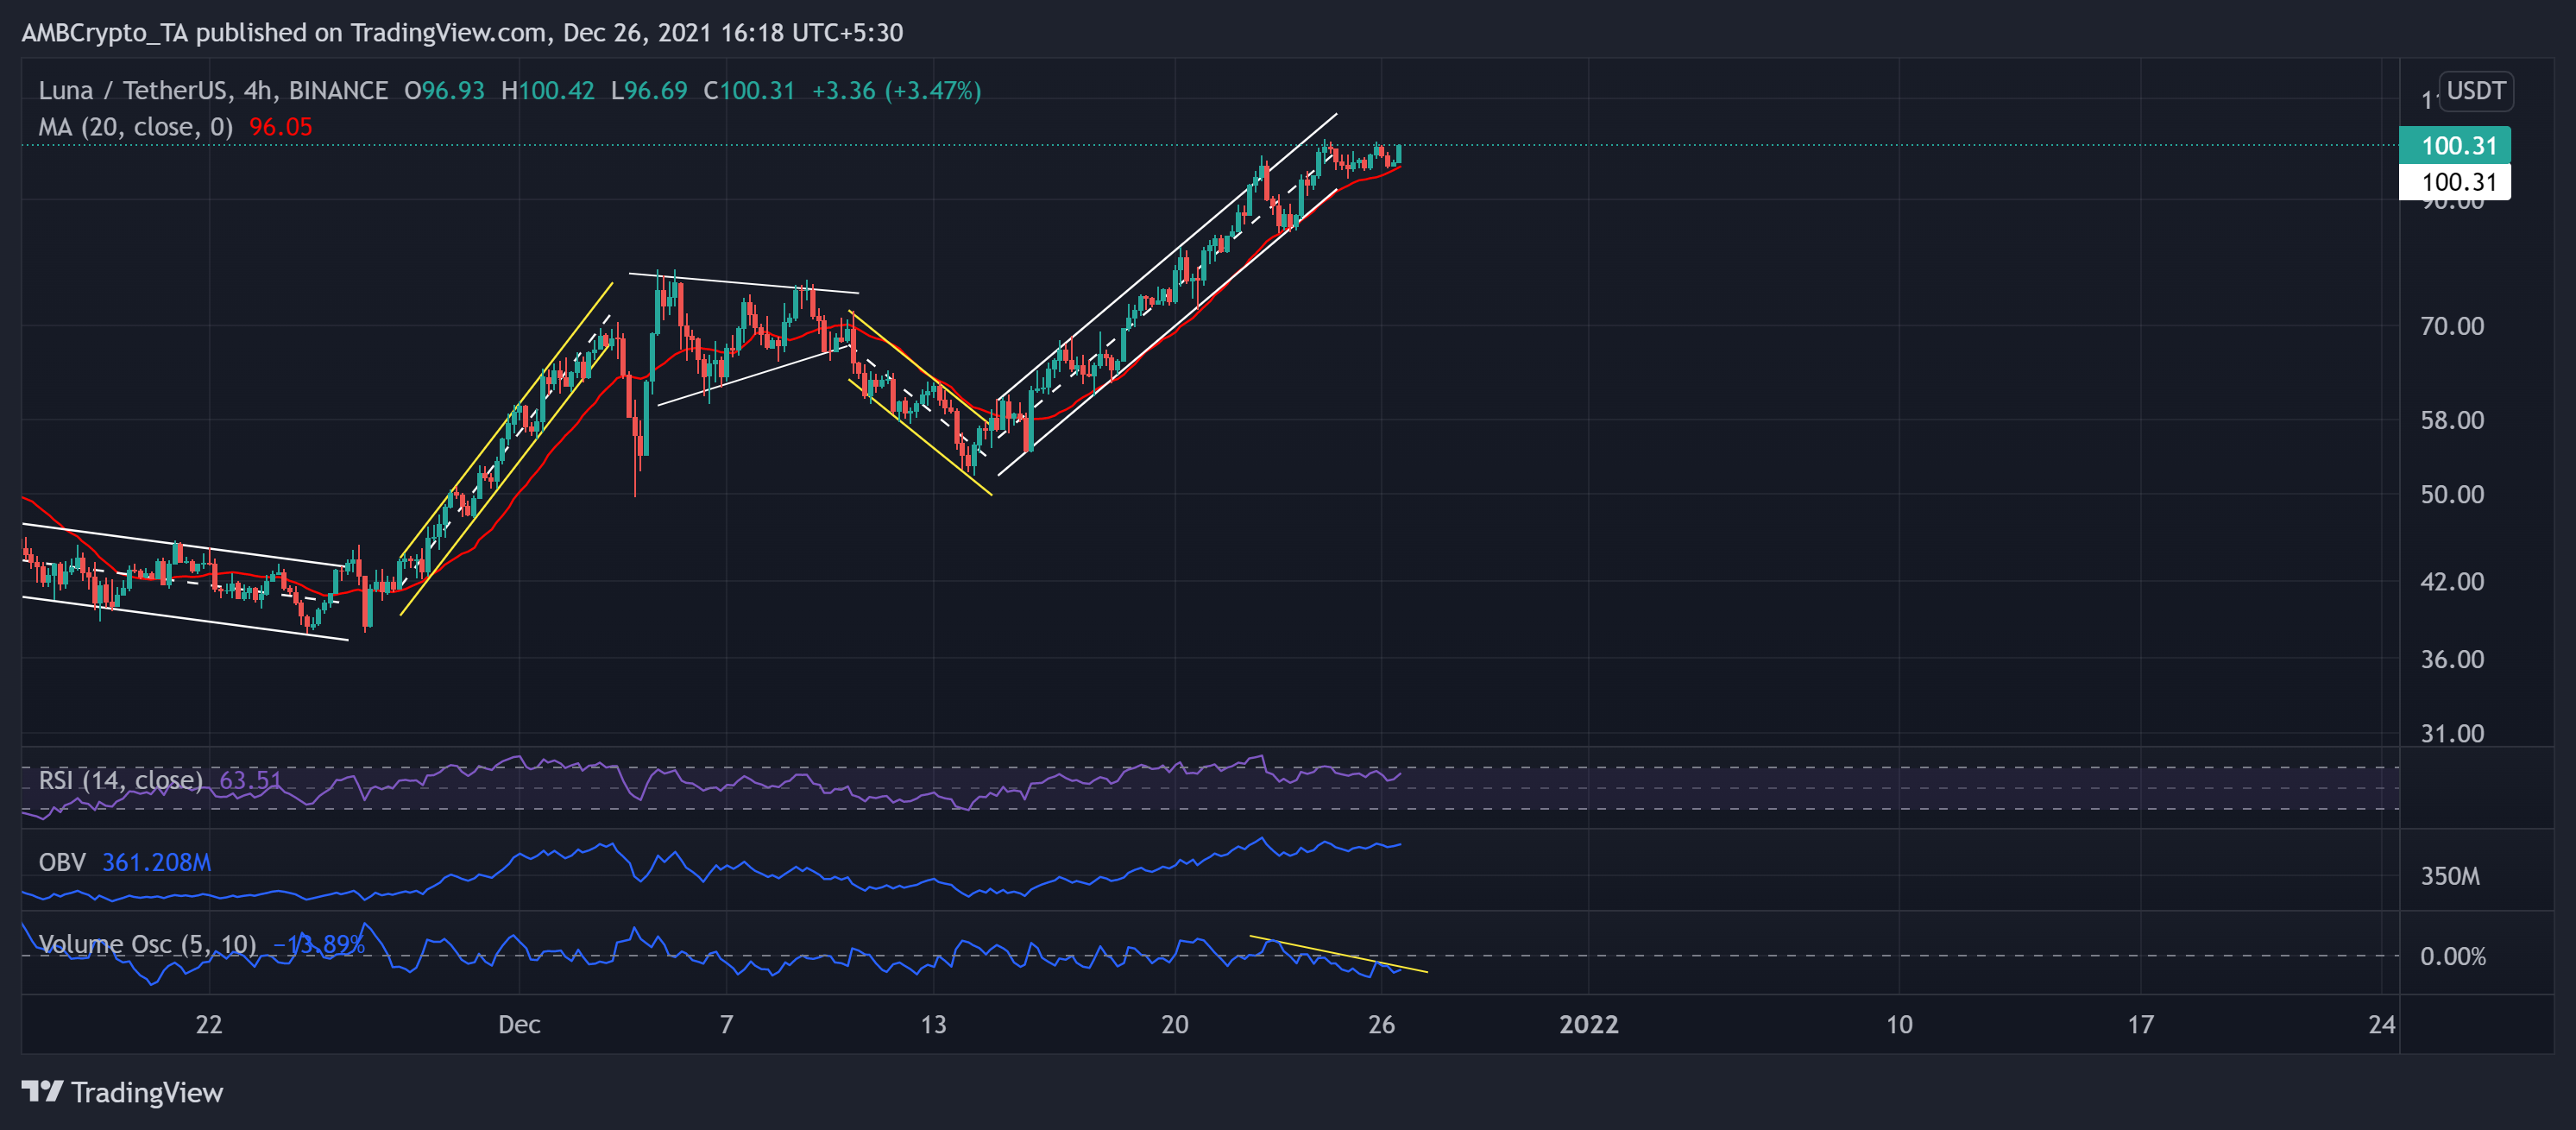
LUNA witnessed a massive upturn after a down-channel breakout on 14 December. Since then, the alt aggressively rose between two parallel channels heading north and showed no correction signs at press time. It saw an over 96.89% ROI (from 14 December low) until it touched its ATH on 24 December.
The 20-SMA (red) stood as excellent support for the alt during the upturn. Over the past two days, the bulls tested the $100-level thrice after depicting a one-sided buying power.
At press time, LUNA traded at $100.31. The RSI wavered around the 63-mark and showed no slowing signs at press time. Also, the OBV visibly affirmed the buying power. However, the Volume Oscillator started to mark lower highs, not eradicating the possibility of a near-term setback.
Dogecoin (DOGE)

Over the past day, DOGE saw a slight pullback after finding strong resistance at $0.1919-level. After retesting this level five times in the past two days, the alt succumbed to a broader sellout and blipped.
The bulls seemingly gained force as the alt noted a 16.61% five-day gain (from 20 December low). This upturn marked an up-channel (yellow) on its 4-hour chart.
The recent blip found support at the 20-SMA (red). Now, the meme-coin approached the $0.1919-mark (three-week resistance) to perform a retest. The trading volumes and OBV saw a corresponding spike, hinting at a healthy trend reversal.
At press time, DOGE traded at $0.1887. The RSI plunged from the overbought region but sustained itself above the 59-point, depicting a strong bullish influence. The Squeeze Momentum Indicator now flashed black dots, hinting at a low volatility phase.