XRP, VeChain, Ethereum Classic Price Analysis: 24 January

XRP formed a bullish reversal pattern in the short-term but did not confirm a move to the upside yet. VeChain failed to reclaim the channel it was trading in and a rejection at the upper level opened the door for a possible drop. Ethereum Classic showed short-term strength from sellers but defended a level of support well.
XRP

Source: XRP/USD on TradingView
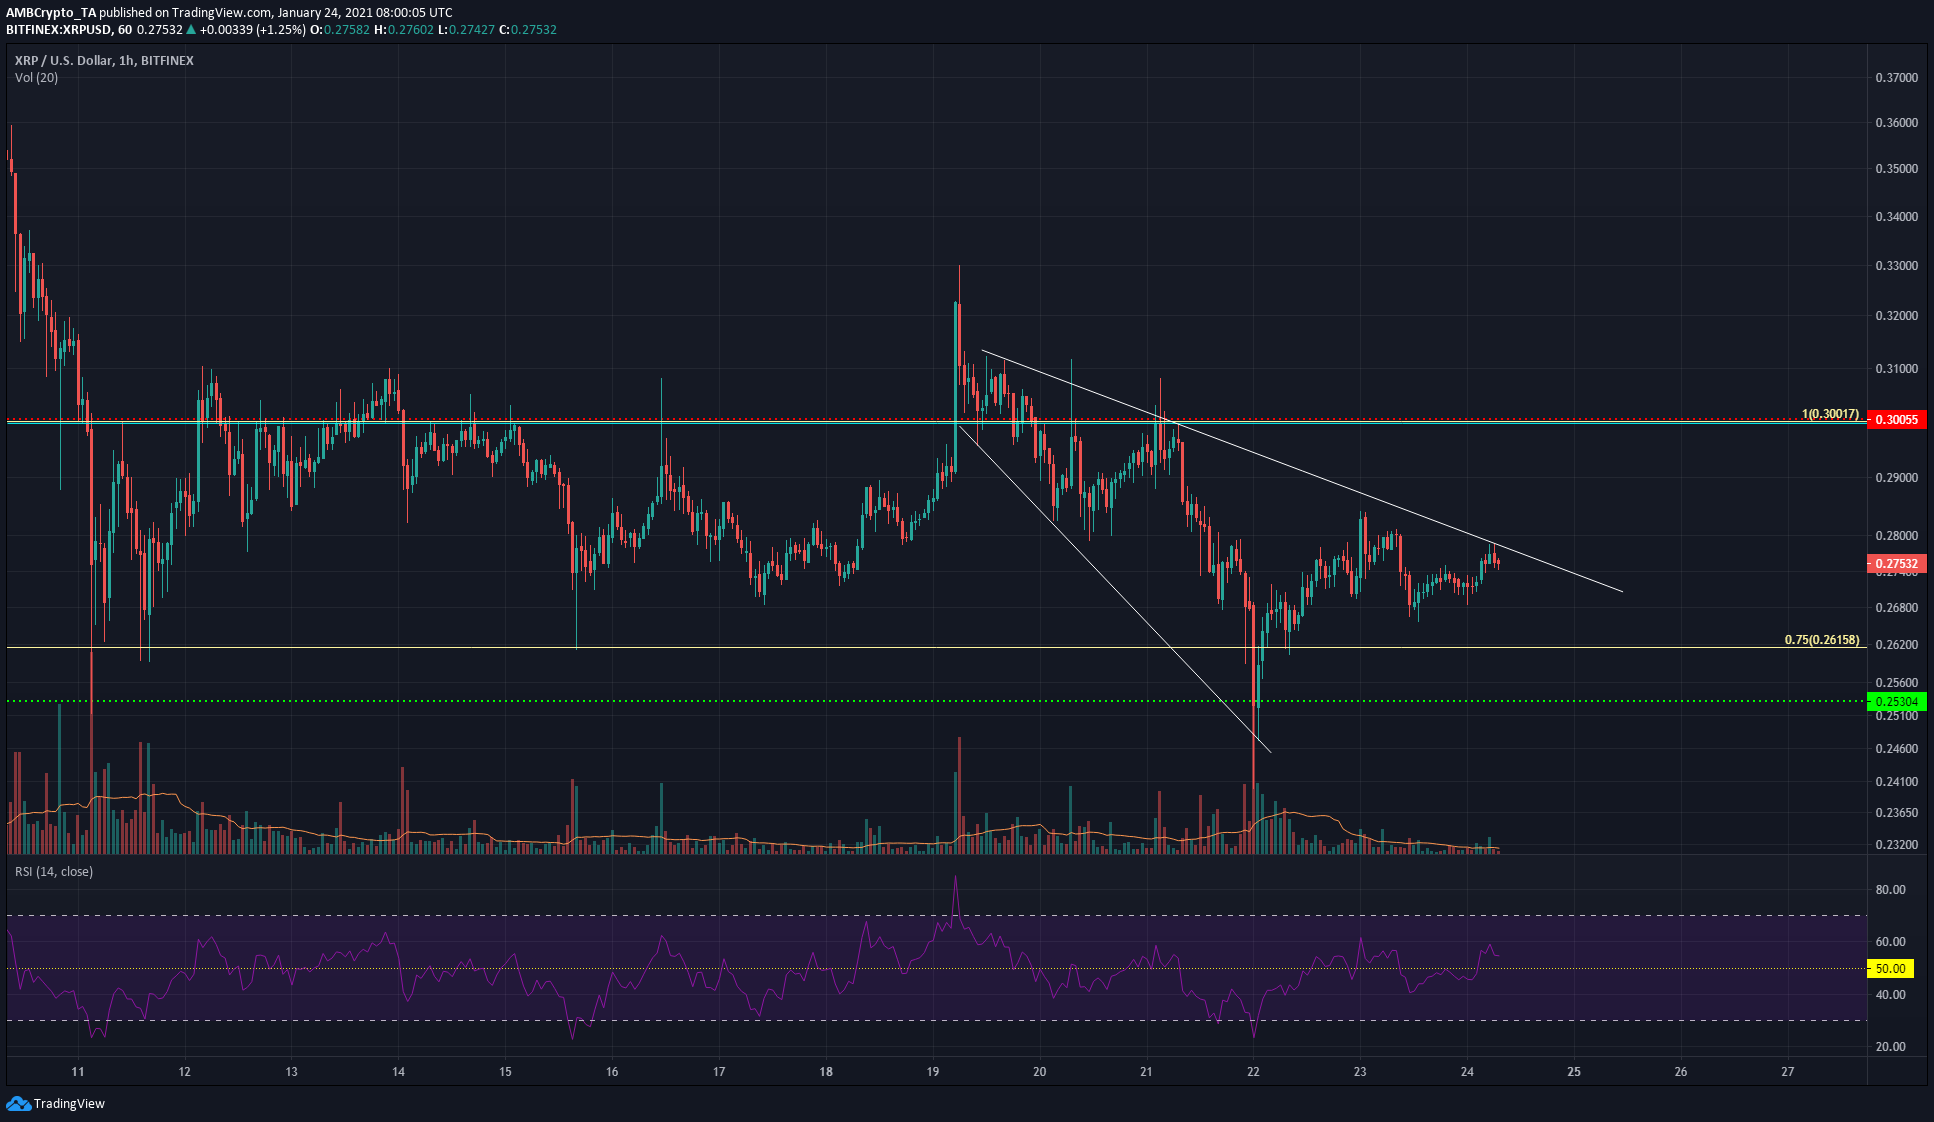
XRP formed a descending broadening wedge as it fell to test the $0.25 support and bounced to the $0.275 mark, where it was trading at the time of writing. This pattern generally sees the trading volume move upward, but that has not been the case here, as the trading volume has in fact diminished.
The $0.28 region can be expected to serve as resistance to XRP in the short-term. The 1-hour chart showed that the RSI is rising above the neutral 50 – which is not yet a bullish development, as price first has to rise past the $0.28 mark and make a steady series of higher lows.
The wedge pattern generally sees the price reach the peak from where the price starts to descend – hence a move to the upside will target the $0.3-$0.31 for XRP.
VeChain [VET]

Source: VET/USDT on TradingView
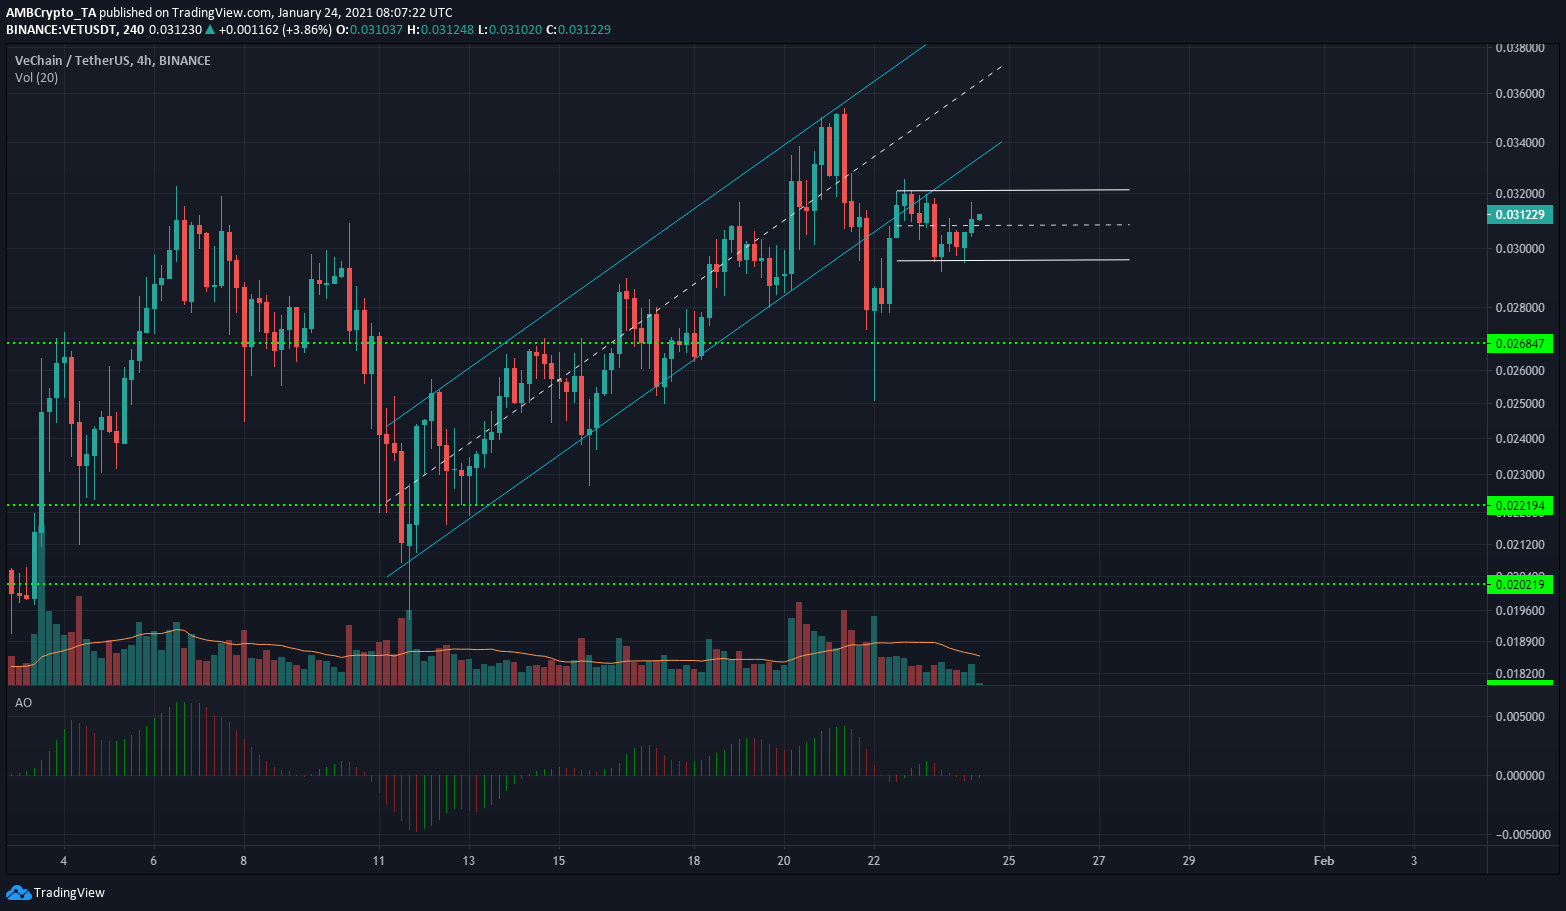
VeChain moved beneath the ascending channel and retested the vicinity of the lower boundary as resistance. The price was unable to move back within the channel (cyan) and appeared to trade sideways within the $0.0296-$0.0321 boundaries (white).
The Awesome Oscillator showed neutral momentum behind VET, while the trading volume was also low.
A move outside the sideways channel will likely decide the next direction for VET, with support at $0.0268 and resistance from the ascending channel’s lower boundary.
Ethereum Classic [ETC]

Source: ETC/USDT on TradingView
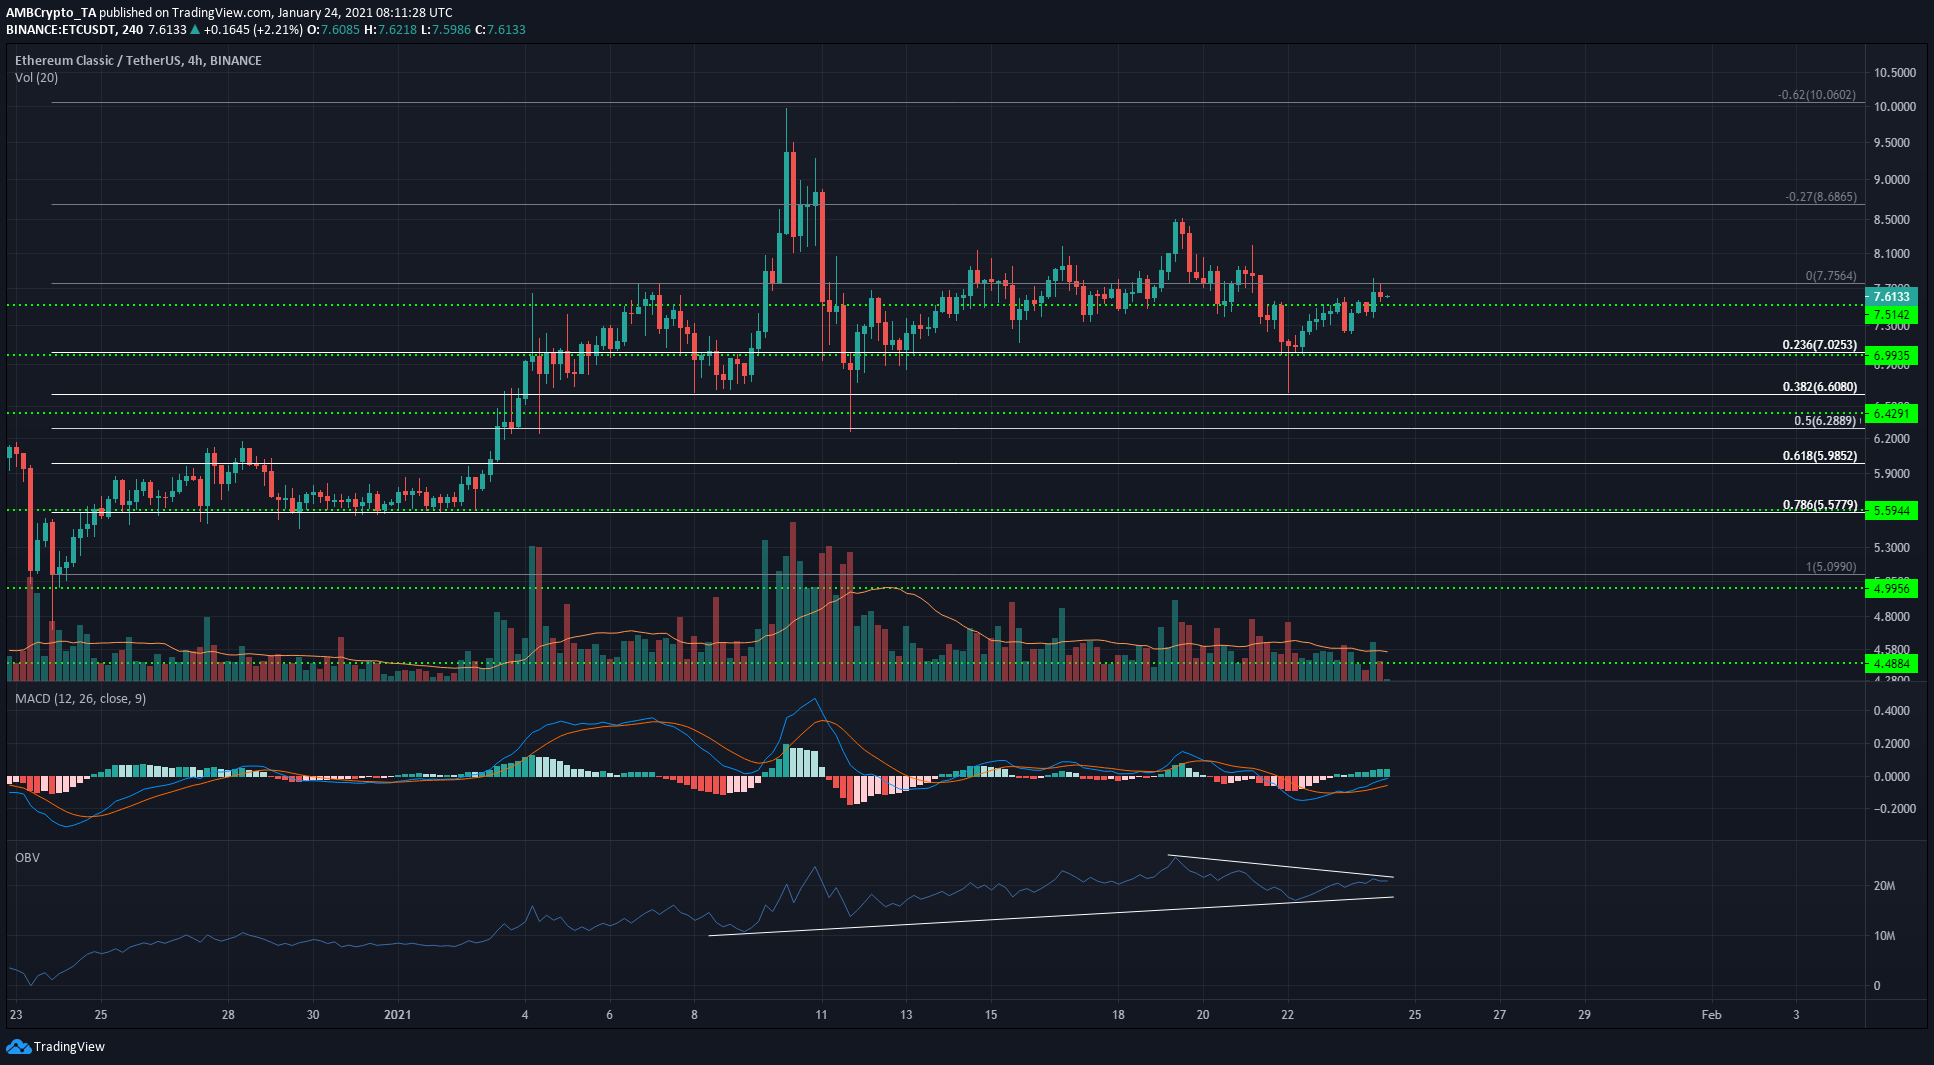
ETC saw a candlewick touch the $6.6 level but did not close the trading session beneath the $7 level of support. This defense by the buyers gave some short-term bullish momentum as ETC rose to $7.64 – the MACD saw a bullish crossover and was on the verge of climbing above the zero line.
The $7.9-$8 region has rejected ETC bulls multiple times over the past two weeks- ETC bulls need to flip this region to one of demand in order to recover towards the $9.5 highs it made earlier this month.


