Zilliqa, Kusama, Loopring, ROSE Price Analysis: 05 April

With Bitcoin hovering above its 4-hour 20/50/200 EMA, ROSE displayed a bullish edge on its technicals. But it also witnessed a bearish divergence that may lead to a near-term slowdown in its bullish rally.
On the flip side, Zilliqa and Kusama depicted a slight bearish edge on their near-term technicals. Whereas Loopring was still on the neutral side, it needed to ensure the RSI equilibrium to prevent a bullish setback.
Zilliqa (ZIL)
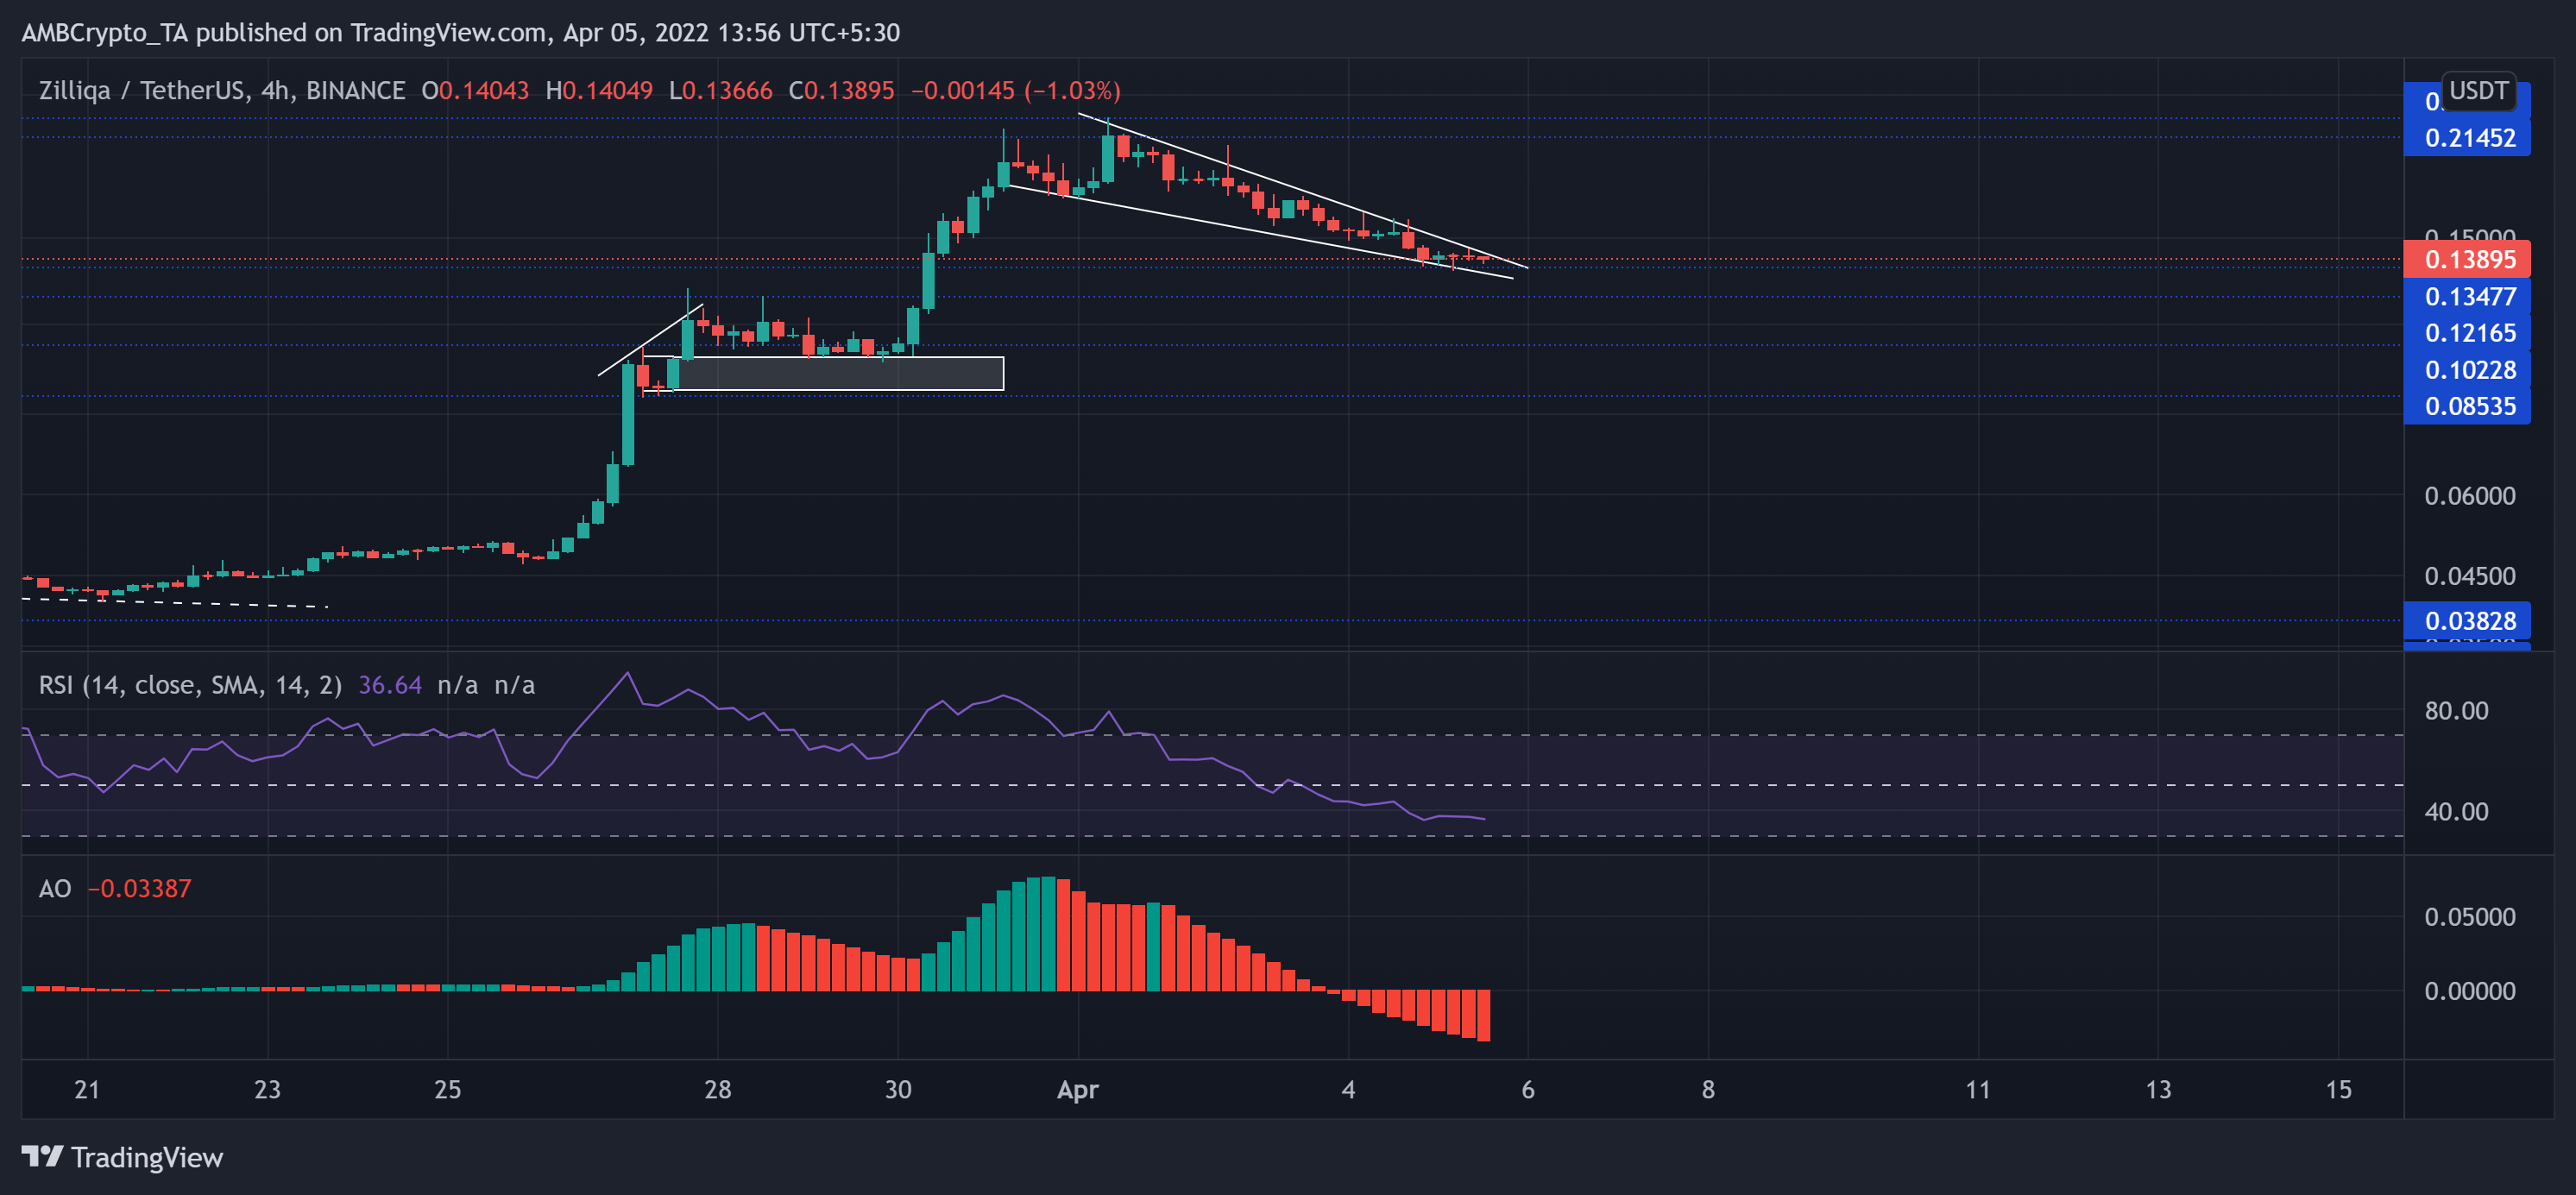
For nearly seven months, ZIL faced resistance at the $0.12-mark as the sellers kept adding fuel to the alt’s bearish fire. Thus, it marked a trendline resistance (white, dashed) and plunged towards its 14-month low on 24 February.
But as the bulls were adamant about defending the $0.03-level, they turned the tide in their favor. With a stunning 414% rally from 23 March to 1 April, the alt poked the $0.22-resistance. Following this, the bulls took a back foot as the price withdrew in a falling wedge (white).
At press time, ZIL traded at $0.13895. The bearish RSI saw a swift fall from its 1 April high in the overbought region. Consequently, it lost the midline support to find a base at the 35-mark. Also, the AO touched its record low on 5 April. A potential reversal from here could be likely.
Kusama (KSM)
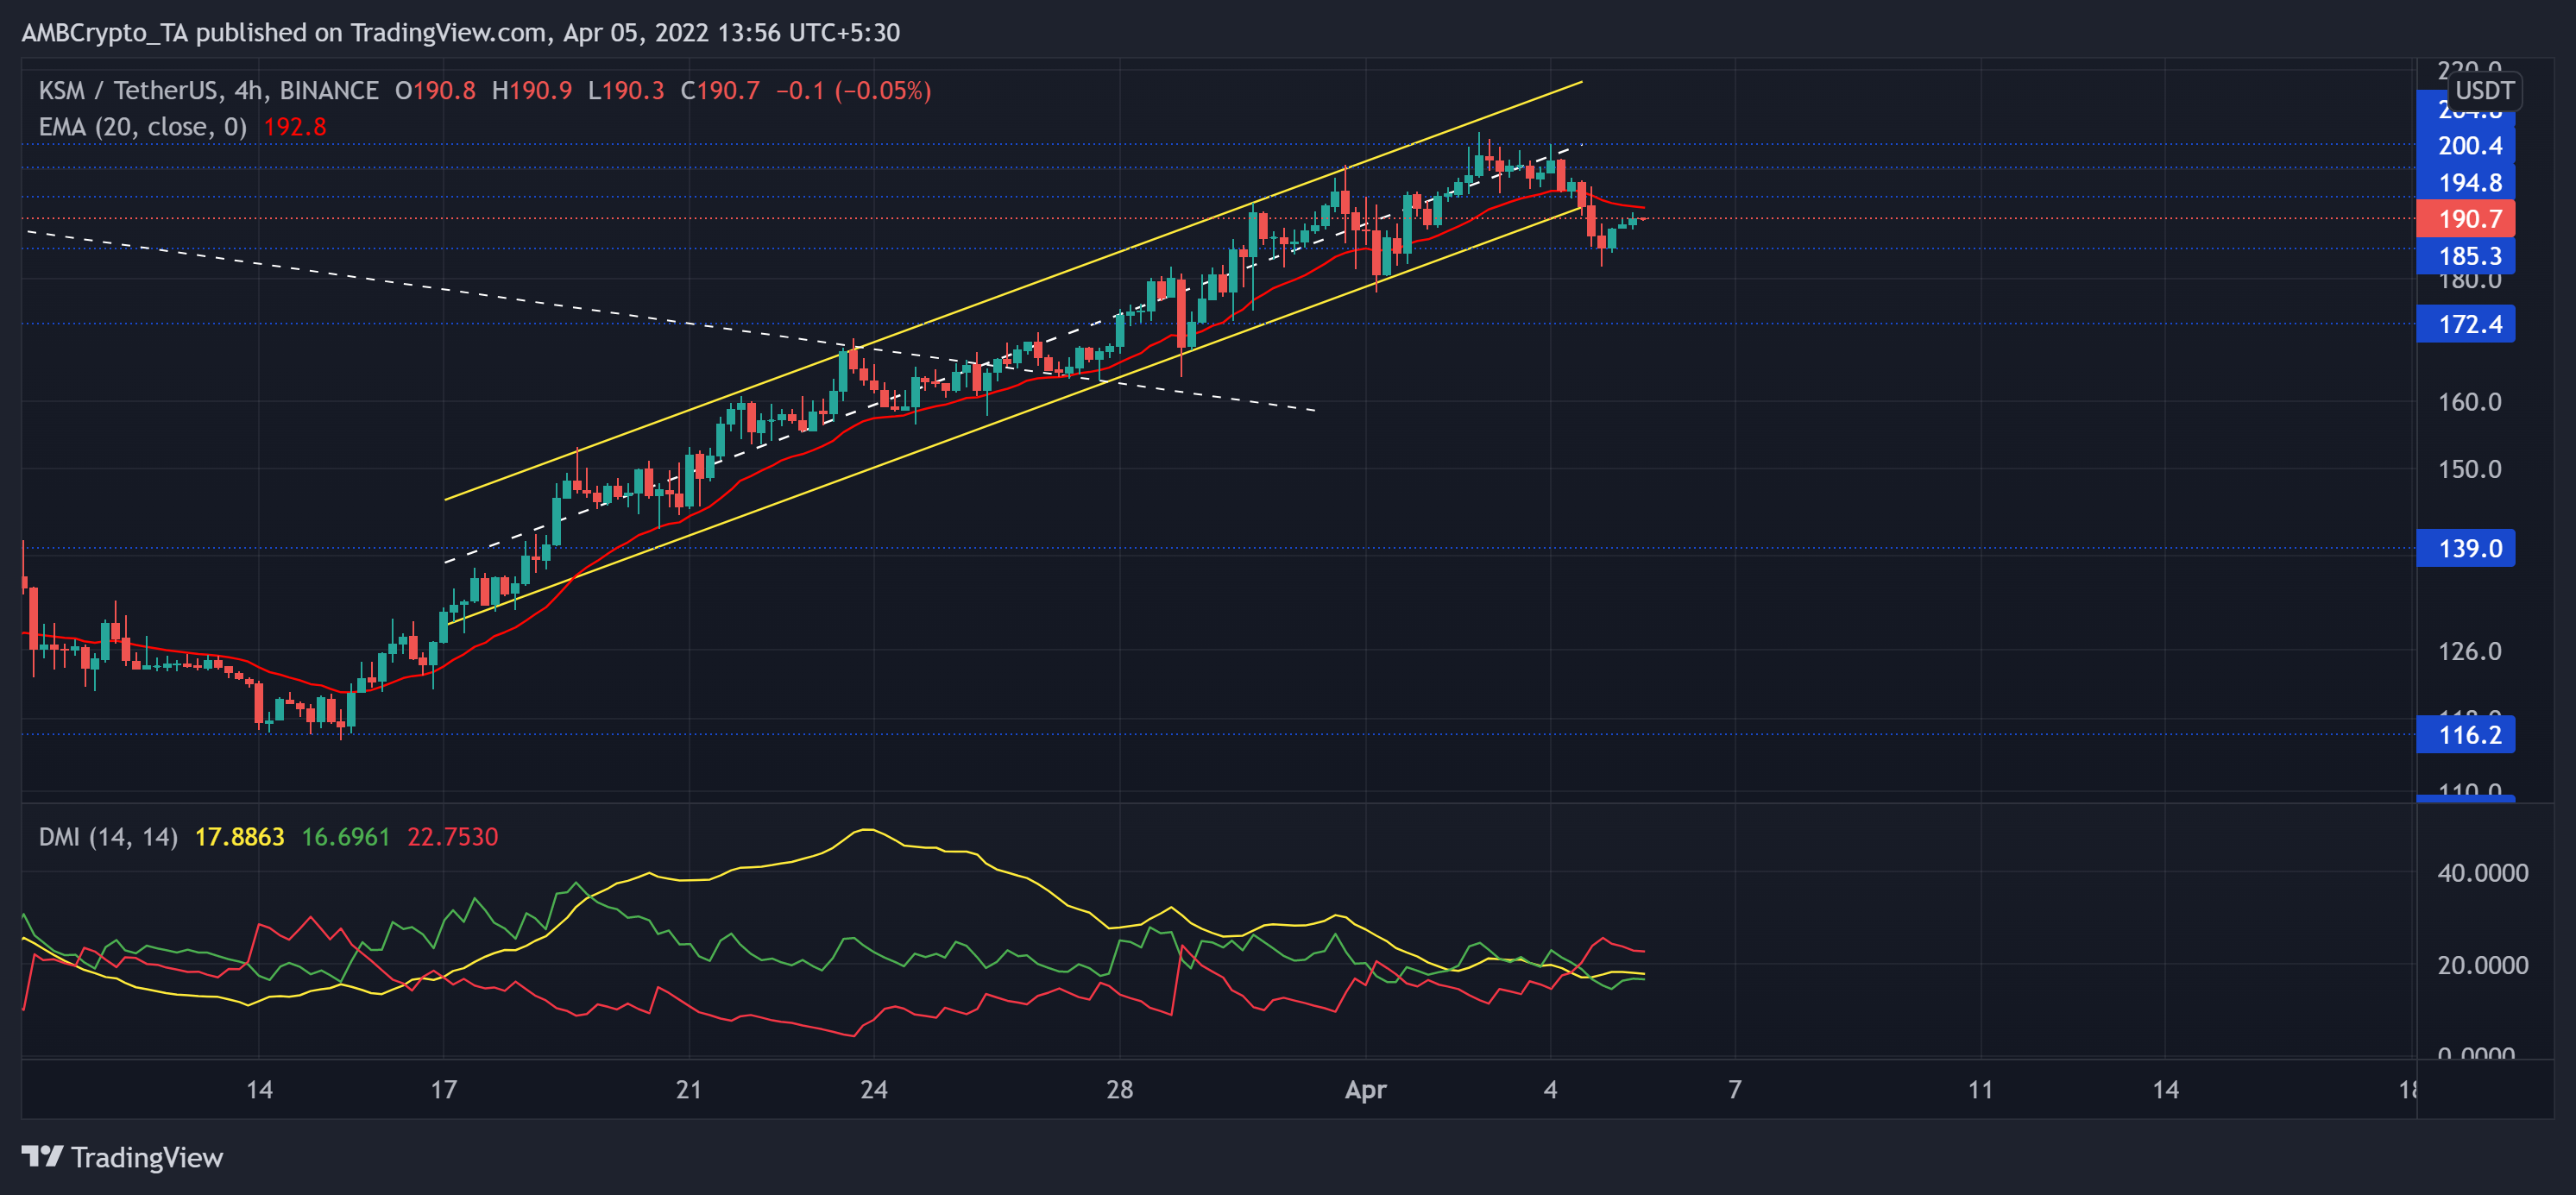
The recent bullish rally finally toppled its four-month-long bearish streak marked by the trendline resistance (now support, white, dashed). The selling splurge led the alt towards its yearly low on 24 February.
Since then, bulls kept testing the $139-level and entered into price discovery. As a result, it saw over 66% in the last three weeks as the bulls initiated a trend-altering rally. Now, the 20 EMA (red) offered near-term resistance for bulls.
At press time, KSM traded at $190.7. The DMI lines visibly depicted a bearish edge as the -DI line refrained from looking south. But the ADX revealed a substantially weak directional trend for KSM. Thus, the bulls can capitalize on this opportunity to continue their rally while the overall sentiment slightly supported them.
Loopring (LRC)
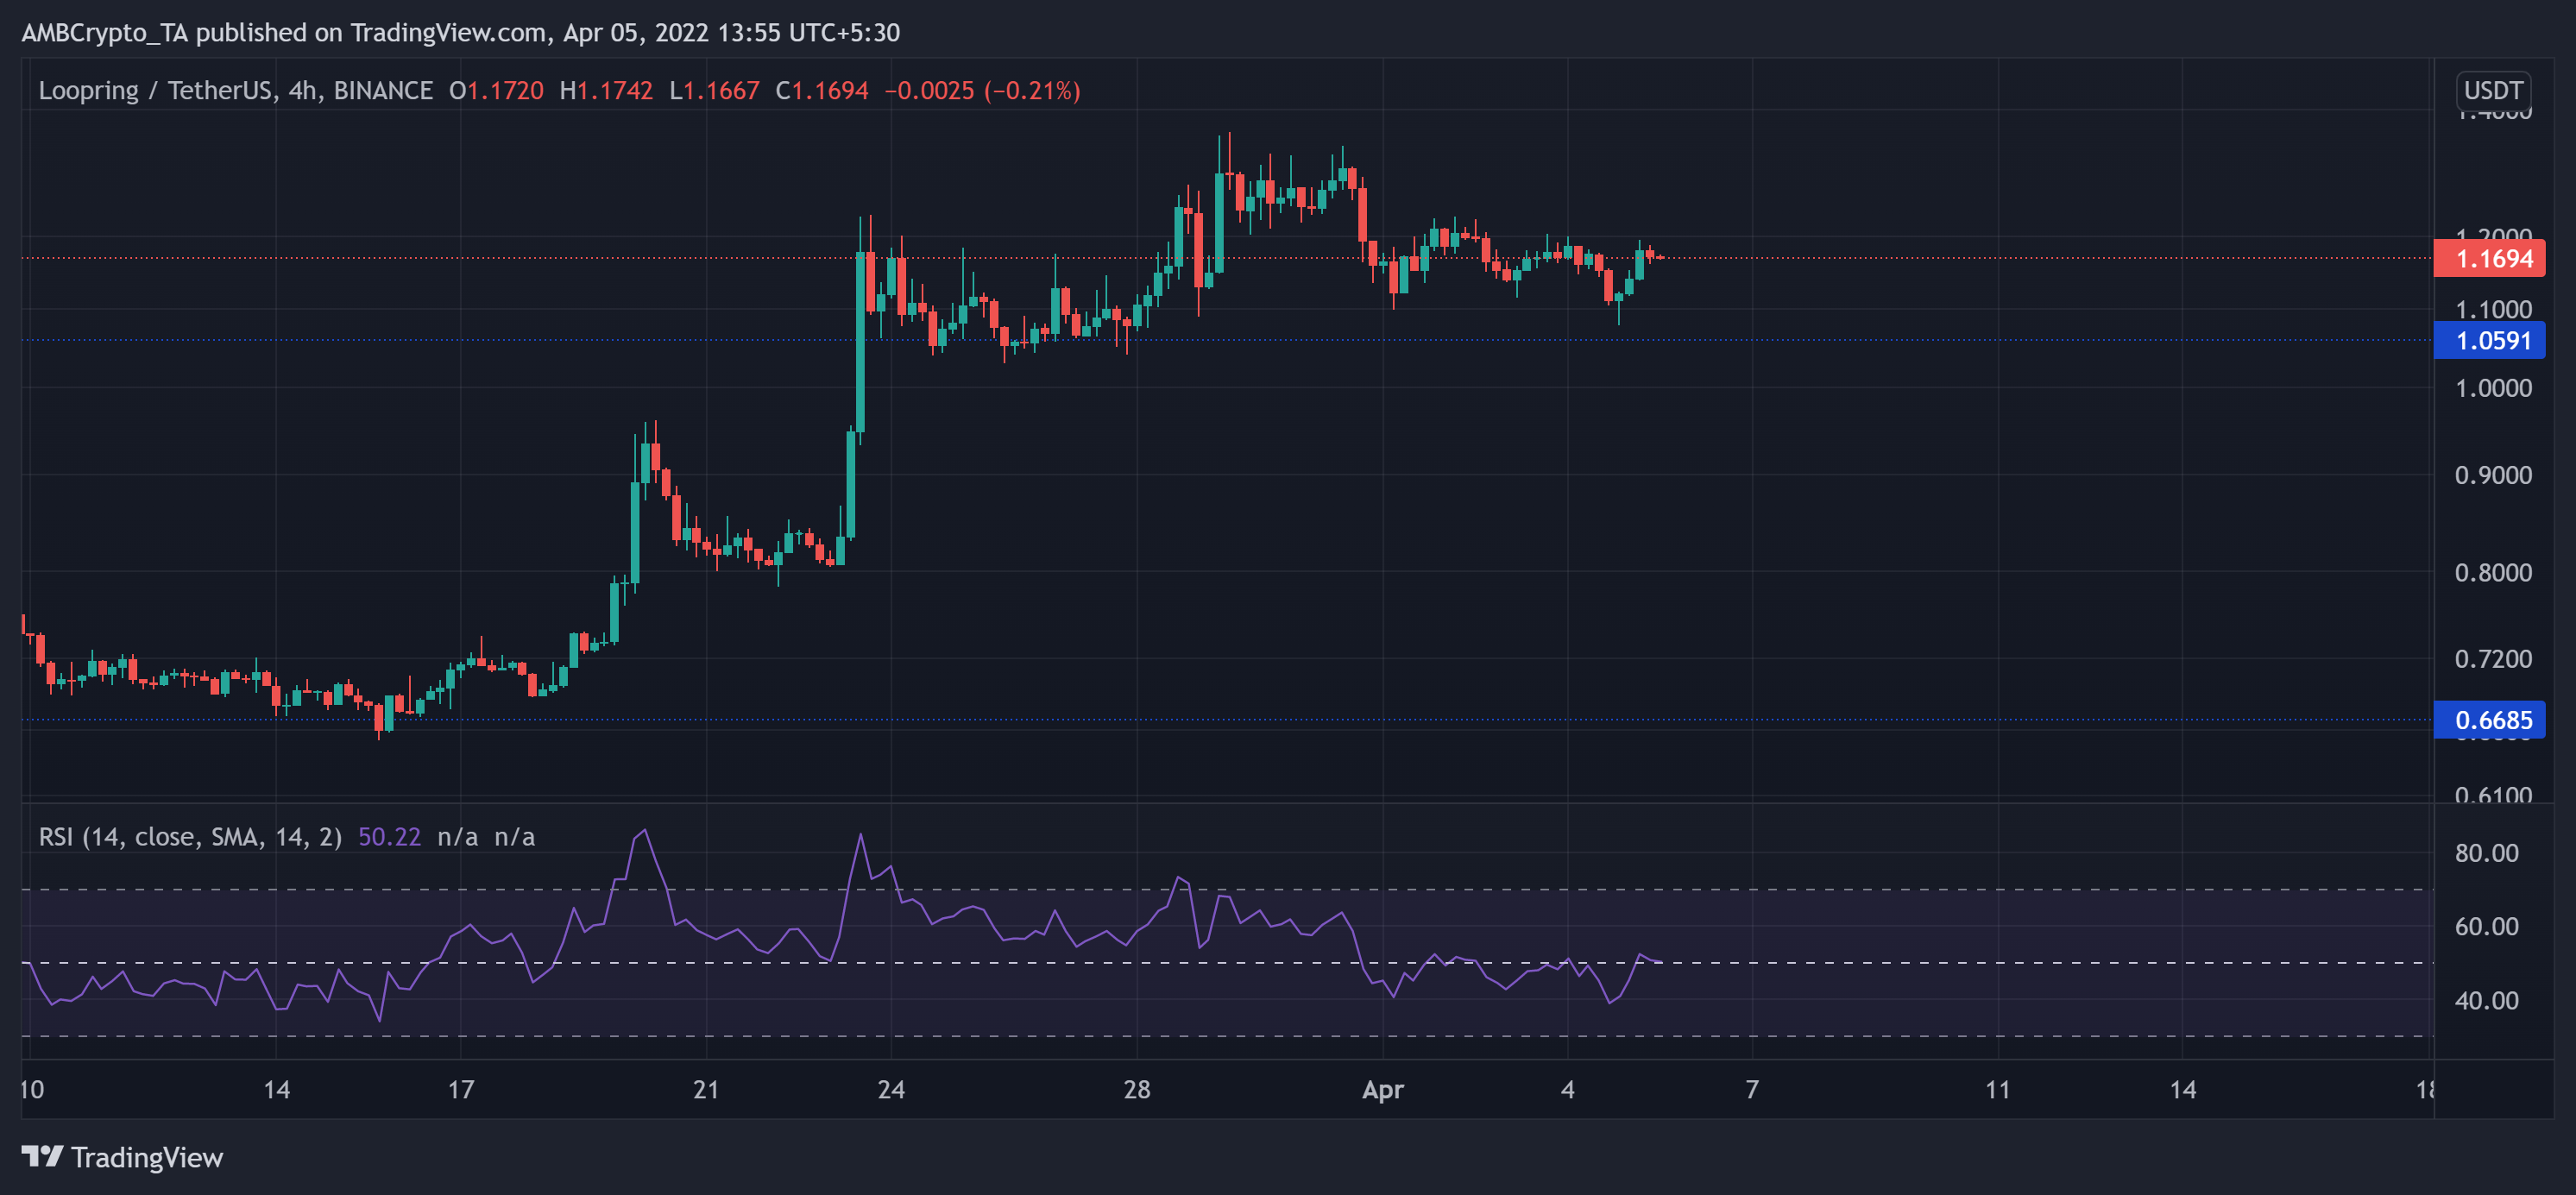
After a bull-pennant breakout in November, LRC entered into price discovery and struck its ATH at $3.85 on 10 November.
Since then, the price fell firmly while losing some critical price points but found a base at the $0.66-level. The token lost nearly 70% of its value in the past five months. From here on, the immediate support stood at the $1.05-level.
At press time, LRC traded at $1.1694. The RSI saw a solid recovery but struggled to find a compelling close above the midline. Any close below the 50-mark would cause a short-term setback for bulls.
Oasis Network (ROSE)

The latest bullish rally snapped its long-term trendline resistance (white) and flipped it to support in the 4-hour timeframe. Since then, ROSE grew steeply in an ascending channel (yellow).
It marked a staggering 58% growth in just the last three weeks as the bulls continued to exhibit their sustained pressure. Consequently, the price action kept hovering near the upper band of the Bollinger Bands. A possible reversal from this point should not surprise the investors/ traders.
At the time of writing, ROSE was trading at $0.32222. The RSI diverged with the price action as it saw lower peaks. This trajectory affirmed a bearish divergence on its chart.