Tezos, Ethereum Classic, Dash Price Analysis: 17 July

Several leading cryptocurrencies have seen a slump lately. Bitcoin was down by 0.8% over the last 24 hours, Ethereum too lost value by 1.6% within the same time frame.
For Tezos, market capitalization fell by 5.10% at press time owing to its daily decline. Ethereum Classic has seen a considerable dip in buying pressure since the last week of June. The downtrend in DASH’s price could drop further below to the support level of $110.
Tezos [XTZ]

XTZ/USD, TradingView
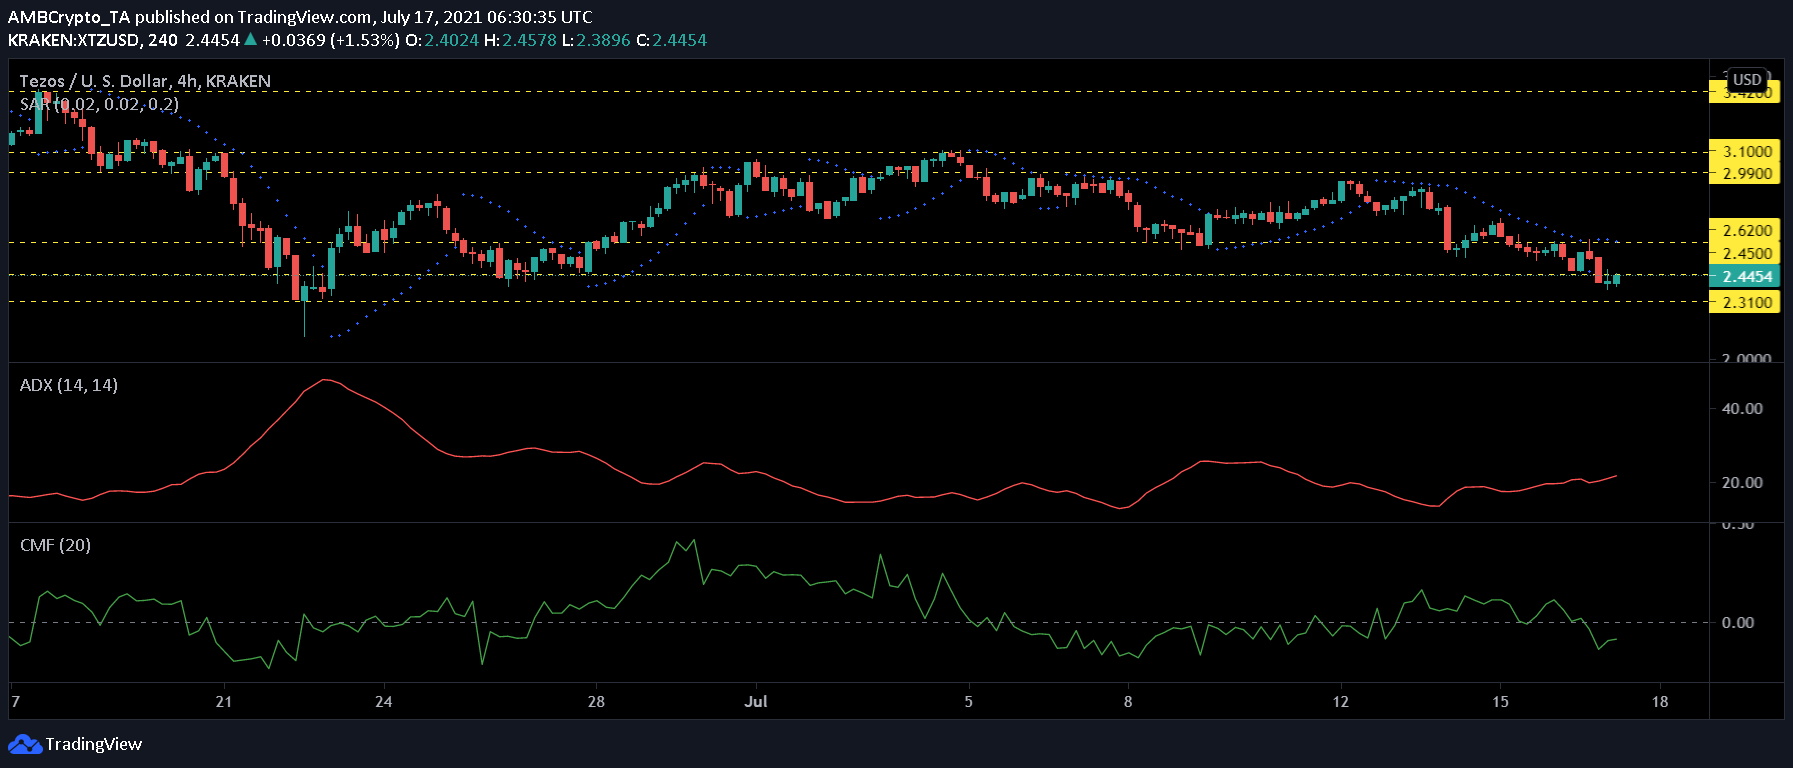
The price movement of Tezos saw a downside over the last couple of days. With mostly bearish outcomes, the coin could dip below its press time price level of $2.44. At the time, the alt was trading in the green, but it hovered very near to the next support level of $2.30.
If the decline continues, XTZ could rest on the support level of $2.30 or even below that. With XTZ’s price at $2.44, at the time of writing, the coin marked an 11.5% decrease over the last week.
The dotted lines of the Parabolic SAR were aligned above the candlesticks since July 13 and at press time, the indicator gave off the same reading owing to further drop in prices. Market strength diminished along with the price, and the Average Directional Index stood a little over the 20-mark and pictured a weak trend.
Conversely, capital inflows shot up a little as pictured on the Chaikin Money Flow. This meant that buyers entered the market as the crypto explored lower prices over the last week.
Ethereum Classic [ETC]

ETC/USD, TradingView
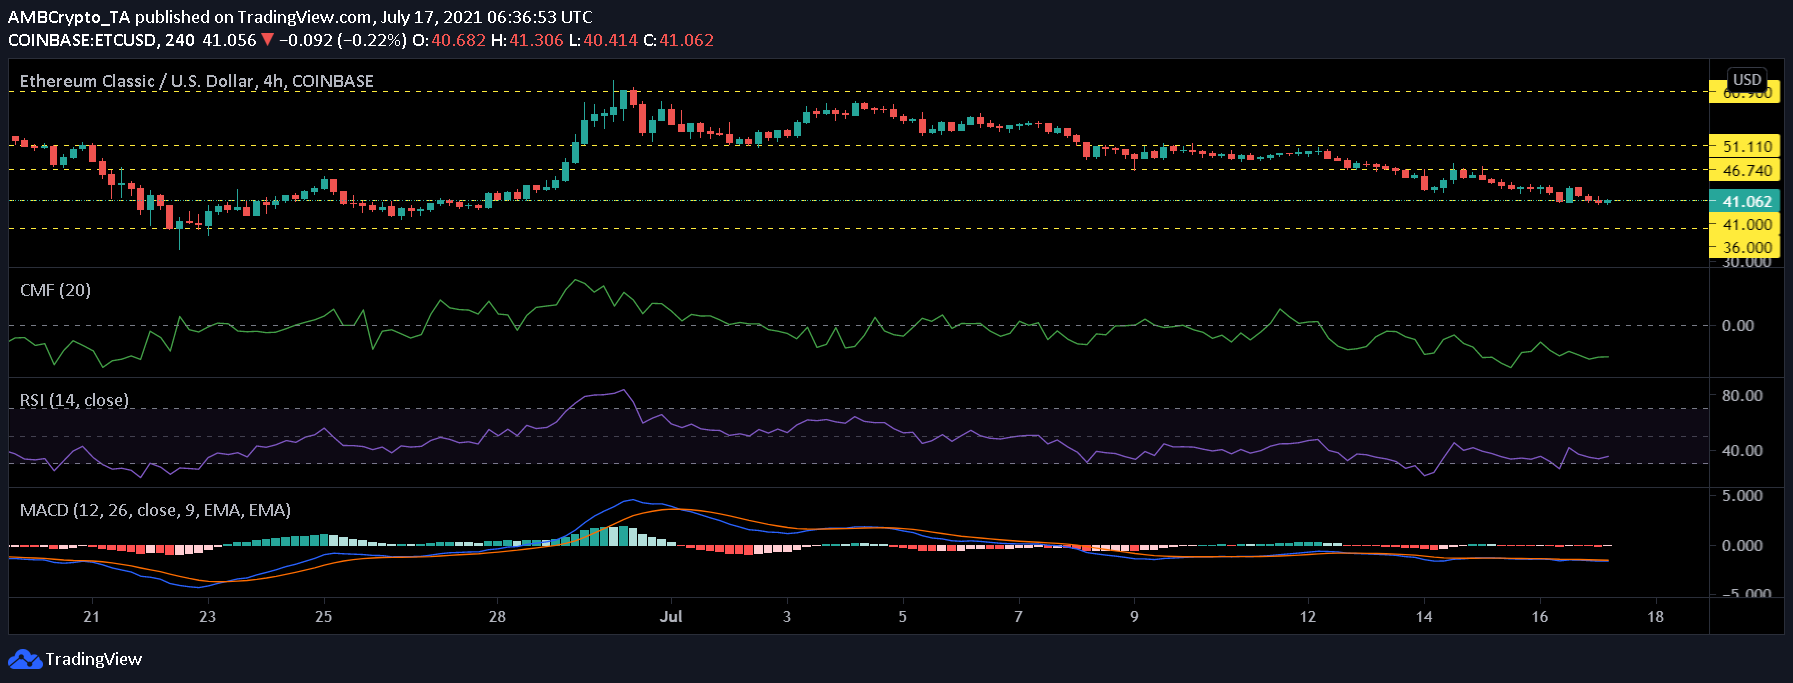
ETC’s prices have fallen substantially since June 28 with almost negligible signs of recovery. The demand for the token has also disappeared since then. The altcoin’s underperformance led its market capitalization to dip by 4.07% at press time.
The asset registered an 18.2% decline over the last week and a daily loss of 4.0%, at the time of writing. It was priced at $41.00 and if it continues its freefall, then the next support level would be at $36.00.
ETC’s withered demand forced the coin to touch the oversold zone a couple of times this month. At the time of writing, buyers were still less in number, when compared to sellers. However, the RSI was just above the oversold zone. Similarly, the Chaikin Money Flow pointed to reduced capital inflows.
The MACD’s histograms flashed a prolonged bearish trend on the charts.
DASH

DASH/USD, TradingView
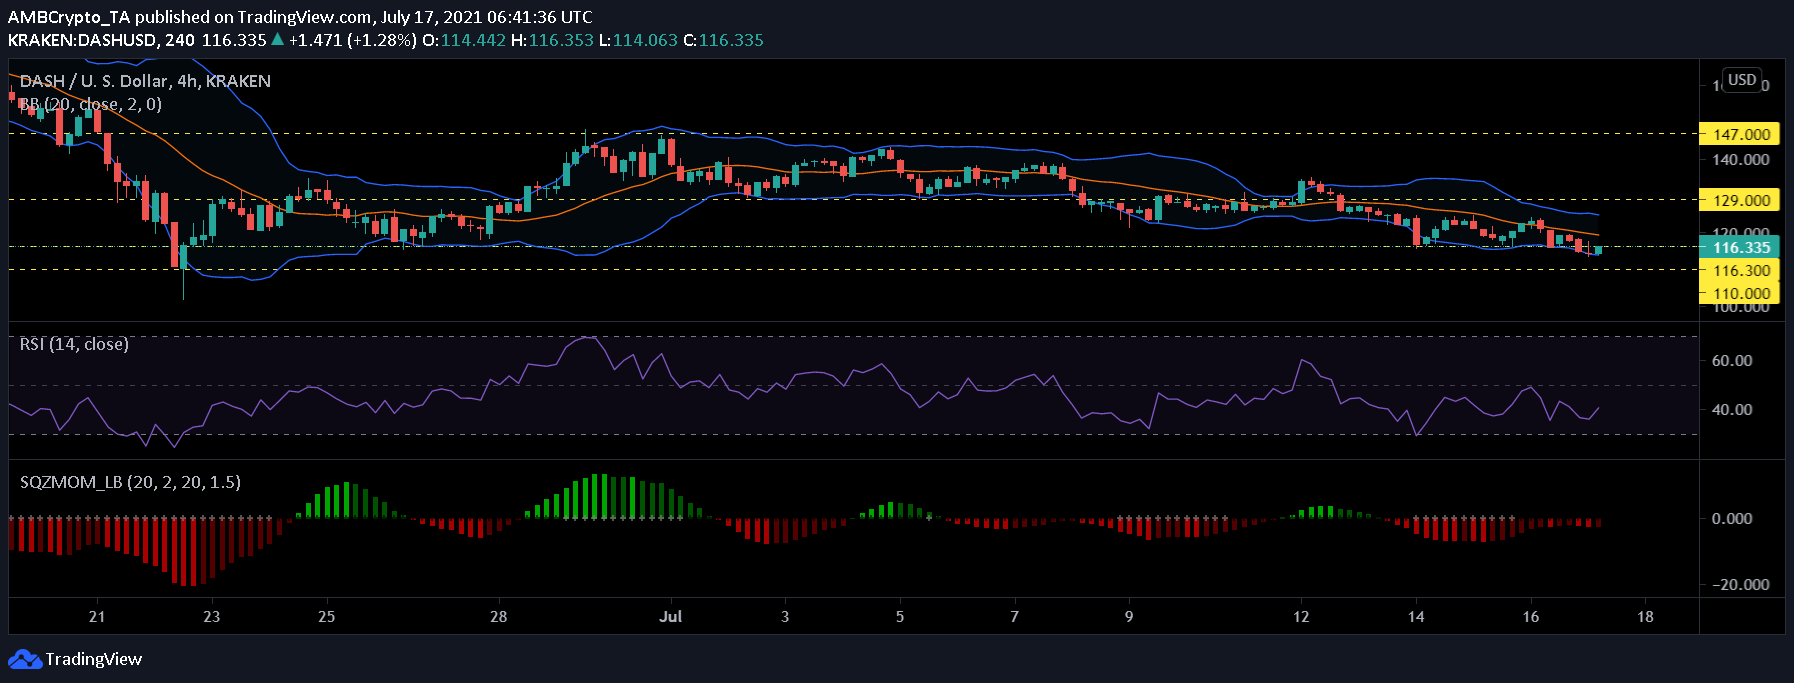
The technical charts for DASH underlined the downtrend in price, and at press time, the coin was valued at $116.335. It may move lower to hit the support level of $110 soon if the alt’s price doesn’t recover over the next few trading sessions.
The asset went up by a meager 0.5% over the intraday trading session. Only if the price reverts back to an uptrend to touch the $129-mark, will the coin see some recovery.
The Bollinger Bands pictured a contraction at press time, pointing towards low volatility. Correspondingly, the Squeeze Momentum Indicator also pictured black crosses on the midline; a reading that implied that the market had just stepped into a squeeze and could prepare itself for a breakout. The appearance of the red bars also meant that DASH could see further small dips in price.
Finally, the Relative Strength Index noted an uptick which pointed towards an increase in buying pressure. However, sellers were still dominant.


