XRP, Ethereum and Polkadot Price Analysis: 15 August

As Bitcoin dipped, Ethereum too registered a 1.4% decline in prices over the last 24 hours. Altcoins such as XRP have paved their own trade trajectory as they recorded a multi-month high after surging by 22% since yesterday. DOT, despite rising only 0.9%, kept inching closer to test its $22.82 resistance mark.
XRP

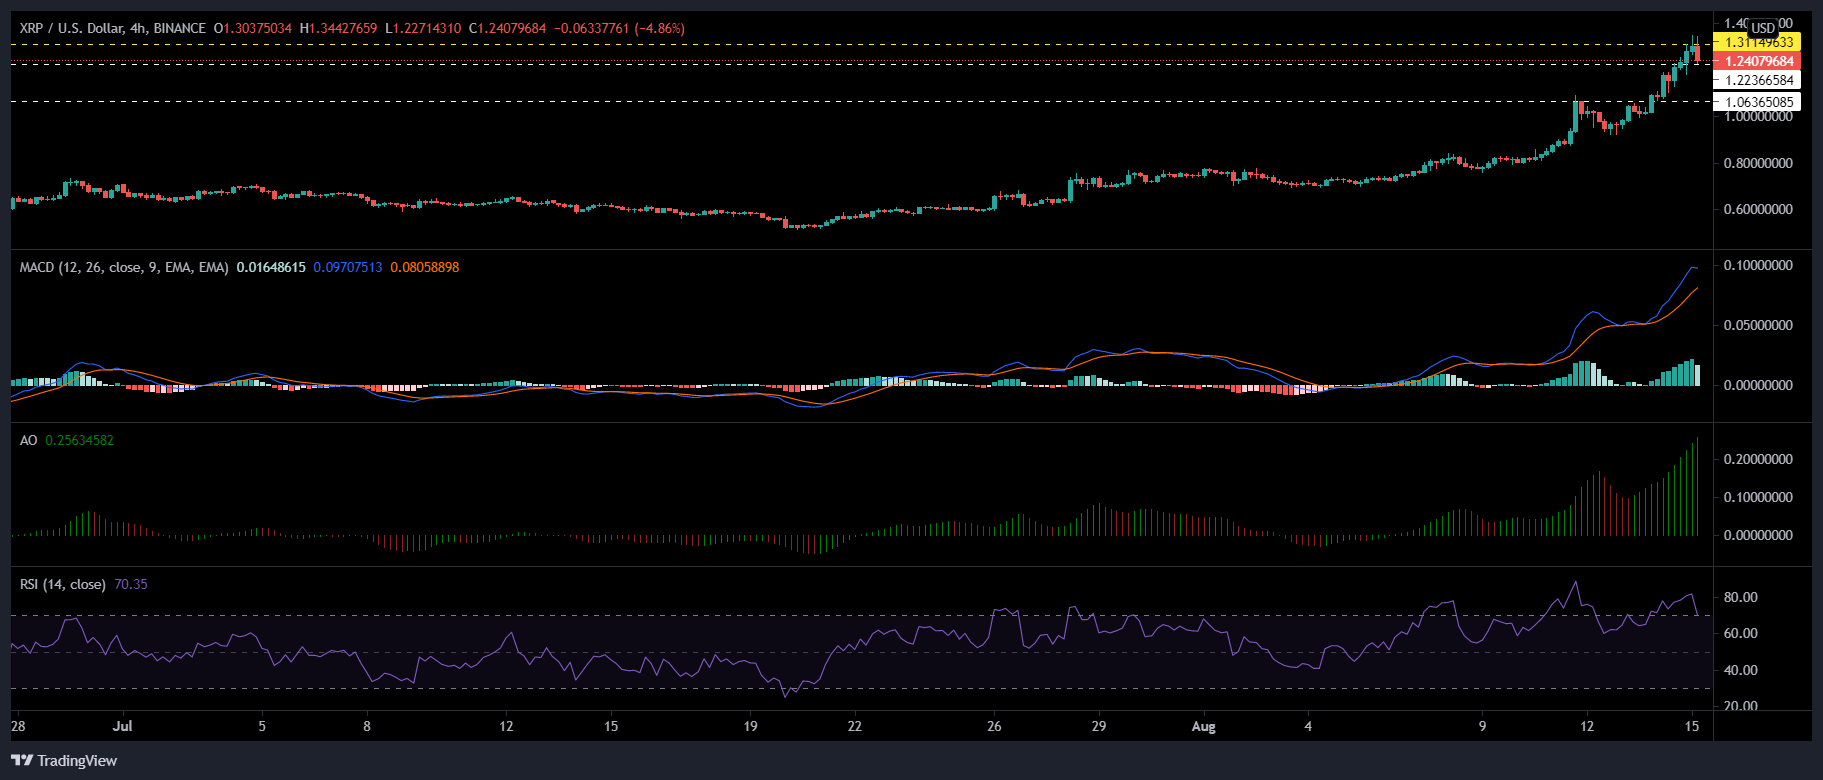
XRP/USD, TradingView
XRP registered a staggering 22% growth over the last 24 hours, as it touched a high at $1.24. With a continued uptrend, XRP could topple over its $1.31 resistance.
Indicators displayed bullish momentum in the market. Awesome Oscillator noted growing green signal bars along with MACD flashing a bullish crossover, followed by green bars on its histogram.
Relative Strength Index highlighted that XRP was overbought however, it also flashed bearish divergence, thereby hinting at possible chances of a price decline. In case XRP’s uptrend retreats, it may find support on $1.06.
Ethereum (ETH)

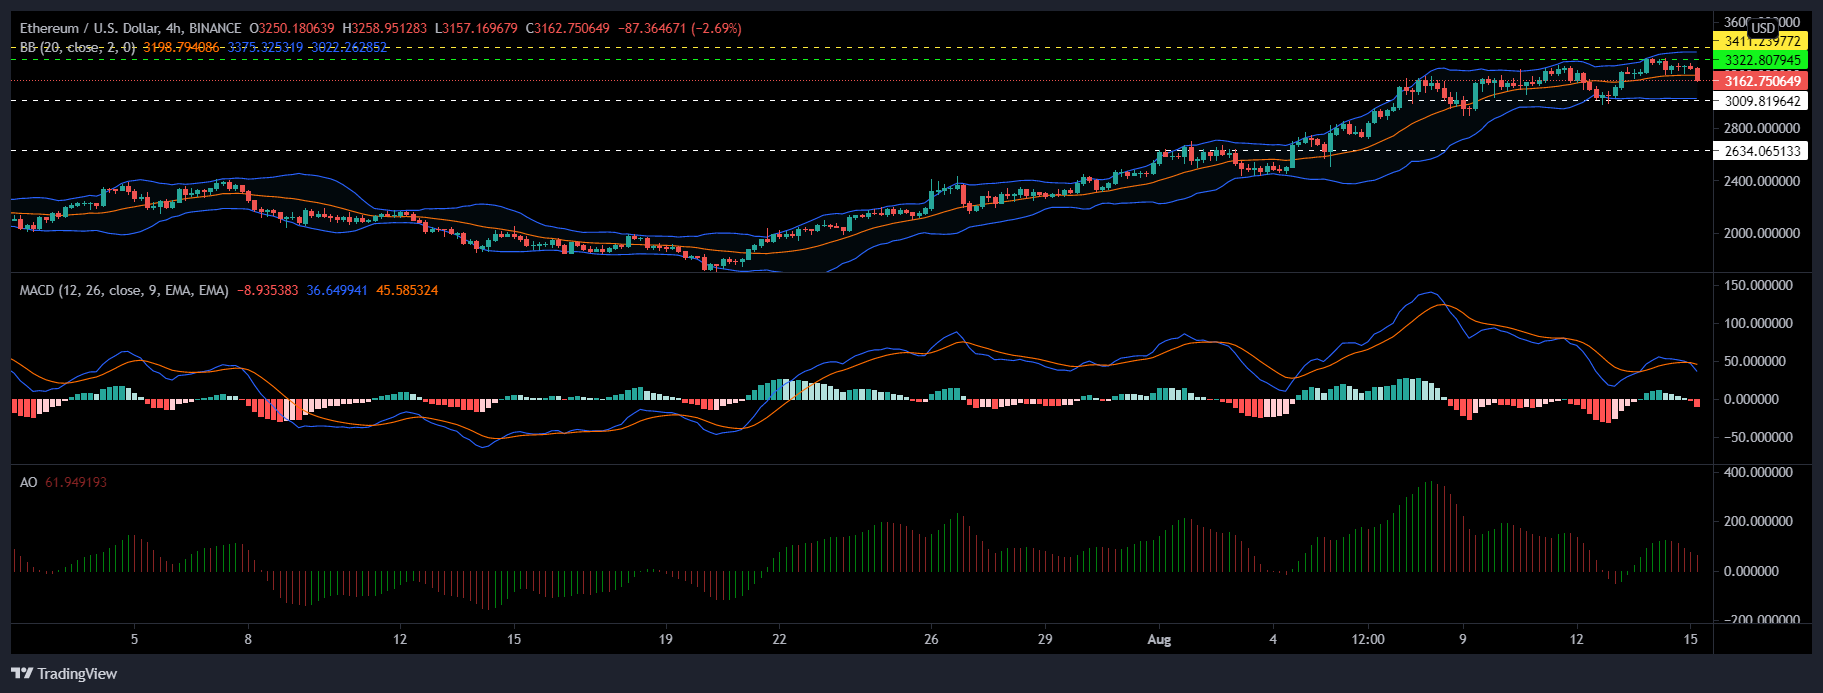
ETH/USD, TradingView
Ethereum’s upward movement was halted as the coin registered a 1.4% fall over the last 24 hours. ETH was priced at $3162 and with a further fall in prices, ETH could touch the $3009.81 support line.
The 4-hour chart underlined a bearish sentiment in the market. Red signal bars were seen on the Awesome Oscillator along with red bars observed beneath the midline on the MACD histogram.
Bollinger Bands opened up and suggested probable chances of increased market volatility. In case the bulls regain strength, ETH could retest the $3322.80 immediate resistance mark.
Polkadot (DOT)

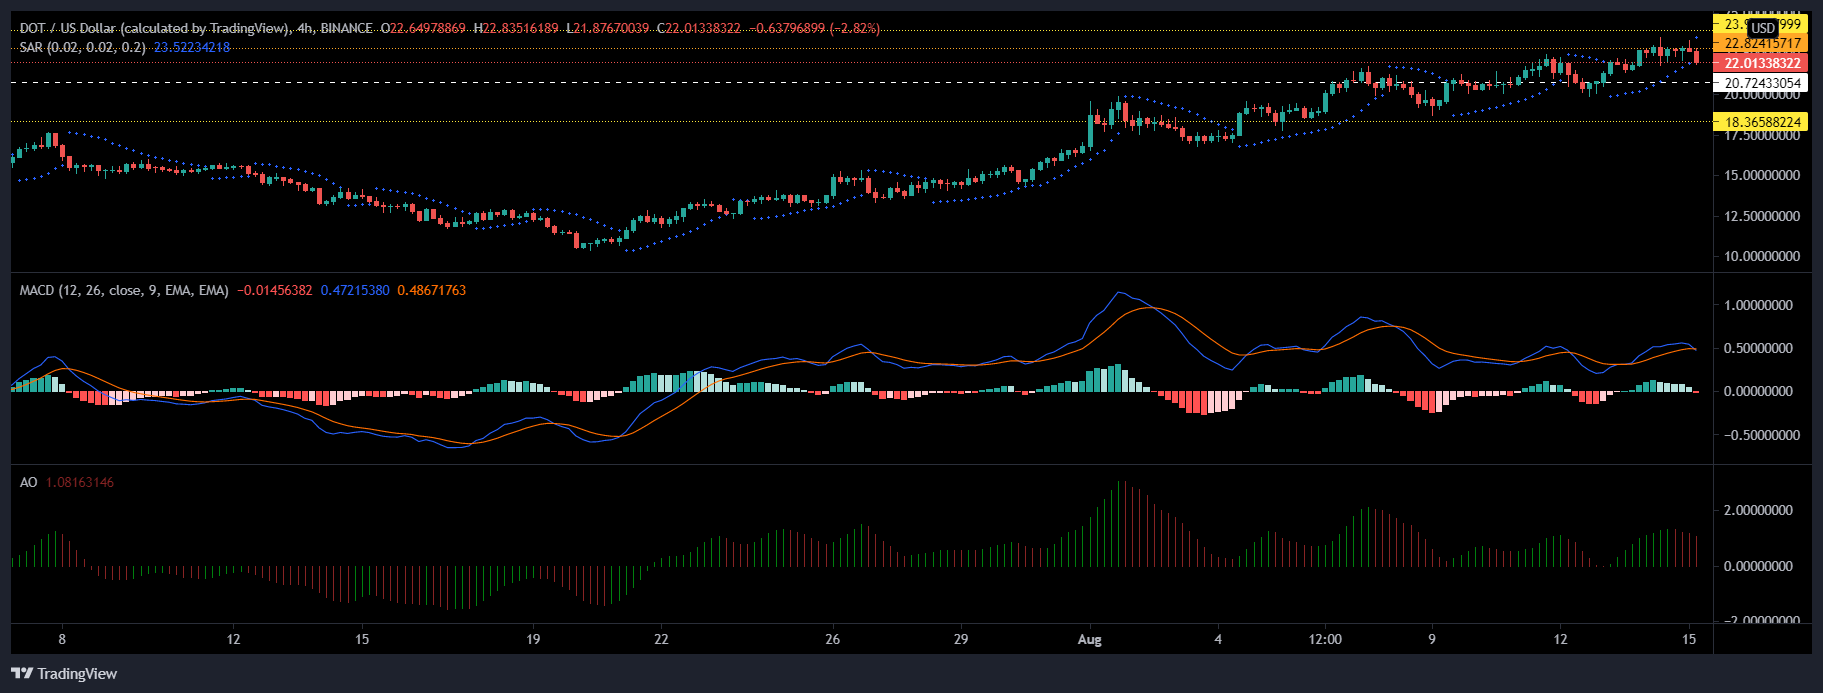
DOT/USD, TradingView
DOT’s movement on the charts was minor with regards to the gains it registered. Over the last 24 hours, it gained only 0.9% as prices stood at $22.01.
DOT registered a downtrend on its four-hour chart, Awesome Oscillator flashed red signal bars above the half-line while MACD recorded an onset of bearish movement. A fall from its current level would make DOT fall to the $20.72 support.
The Parabolic SAR also validated the downtrend by observing a dotted line above the candlesticks. DOT has tried to topple over its $22.82 resistance, a couple of times over the past few days. It is likely that a tiny thrust could send DOT above the same.


